ETH Take that Buy positionthe trend is going back bullish , you must be buying at this time , it's all about positionning to catch the trend
Trade ideas

ETHmas Tree...Oh, ETHmas Tree...Thy Candles are so Falling!!!What in the World is going on with ETH, you say??? Well, this is following our market structure almost to a T. See my previous posts on ETH to see how we got here and why the market is moving the way it is. This is Structural Market Making Moves, and has absolutely nothing to do with the News, Tariffs, Fed Reports, etc.
What just happened:
In the last look, we had an H1 BOS up that led us all the way back up to this H4 Supply Zone. Over the Thanksgiving Holiday and long weekend, the market tried to push up and break out of this zone. BUT...it is an H4 Supply zone, and as mentioned previously, there are a LOT of sellers waiting to sell their ETH here. After failing to overcome those sellers, we have seen the huge rejection expected.
What is significant about this move:
It is VERY important to note now that during all of this up and down over the weekend, and the ultimate failure to break any higher, we have gotten an H4 BOS Up from the lows....This H4 Supply Zone was broken with a closed H4 Candle. So, at this point we are looking for the market to push back down to the Source of that H4 BOS ~ (2680 - 2750). So, this huge fall we've just seen should take us back down to that area to retest and see IF the overall Fall from All Time Highs is finally over.
What to look for:
From here, we need to watch as we approach this H4 BOS Source and look for signs on the 15 min that the drop will end there. The H4 BOS could hold, but there is still the prevailing Weekly Demand Zone (~2150 - 2670) that is what is overall pulling the price down. So, this H4 BOS zone is the first attempt to see if the Weekly Zone is satisfied.
If this H4 BOS Zone holds and we do not get an H4 close below it, ETH could finally start to regain strength. Otherwise, if this H4 BOS Zone gets broken with an H4 close, then the weekly takes over again, and we're back to looking at the Weekly View. The Daily Source of that large weekly zone is still the target (~2150-2300).

Etherium is following the bear marketetherium couldn't push any further , that to low market cap and the following syndrome to bitcoin , overall market sentiment is bearish on the higher time frame . it's a set a forget

ETHUSD 1H — Short Opportunity After Channel BreakCOINBASE:ETHUSD
Price is trading inside a broad descending structure, and the recent move appears corrective, forming a rising channel. This type of structure often represents distribution before continuation lower.
A sweep into the 3,250–3,320 supply zone aligns with previous imbalance and trendline rejection. If the price rejects this zone with momentum, the bearish continuation setup becomes valid.
Key Scenarios
❌ Bearish Case (Primary Setup) 📉
Ideal Entry: 3,250–3,320 Zone (Supply)
→ 🎯 Target: 2,700–2,650 (Liquidity Sweep + Demand Zone)
→ 🛑 Stop Loss: Above 3,380
Confirmation triggers:
• Break of rising channel
• Bearish engulfing candle
• Wick rejection into the zone
Levels to Watch
Type Price
Short Entry 📍 3,250–3,320
Target 🎯 2,650–2,700
Stoploss ❌ 3,380
Invalid if Broken Trendline + Structure Flip
⚠️ This analysis is for educational purposes only — not investment advice.

Price break the resistance at 3050.00ETHUSD is looking like is about to change the character after a Bearish character week of sells, Buyers are looking to step up for long positions. Buy at 3,050.00 SL 2,990.67 TP at 3,230.00

eth still more to bleed eth has been going sideways since 2021. we clearly have a bearish double top (inside) an ascending triangle and have rejected off support. now we will likely see a pull back to support which would be another 30% drop before we see a bull market. this looks like a bearish break and simple retest of the old high from 2018 price to watch 1500.00

$ETH, $4.7K+ Before End of 2027? Retracement Potential?Ethereum is one of those that I am neutral on but invested for long term holds. They have a monopoly on tokenization, yet at the same time, the whole purpose of Ethereum has changed dramatically.
The PoS transition when Ethereum Classic was the original Ethereum and Ethereum PoW is currently the "decentralized newer Ethereum" have left various technologist confused along with the removal of the Ropsten testnet. This has shown Ethereum to be much more centralized than promised and it is entering muddy waters in that sense.
Likewise, can Ethereum differentiate itself from Namecoin, Peercoin and these original PoS forks who got outpaced? Ethereum's technical transition also emphasizes the need for subnets, rollups and speed. Currently they are competing against Solana as well as other players including Z-Cash or minimal small players like Celo and Cardano. The technical differentiation needs to be expanded however in order to allow for scalability. Likewise, Ethereum is still prime in terms of PoS and name-brand but may not be prime in terms of technology.
That said, the long-term potential is still there and Ethereum has a hard to replace developer ecosystem. The patterns when considering fib retracement along with the past cipher and PnL setup showcase the potential of a $4.7K price point by October 2027. As always, none of this is investment or financial advice. Please do your own due diligence and research.

ETH BULLISHPlease don’t judge the set up lol I’m still learning. I’d love some constructive criticism cause I know I got a rookie setup but I am bullish on ETH.

ETHSUD test area 0.618 fiboAfter breaking through resistance at $2750 in early July, Ethereum ( CRYPTOCAP:ETH ) is attempting to establish it as new support, which is also the 0.618 Fibonacci retracement area.
Crypto Panic and DUMP!?We have just had a MAJOR dump over the last 12 hours in the crypto market.
This was expected, as we are expecting MANIPULATION to take place - and this usually happens in the beginning of the month.
I'd like to see the previous months low of NOV get taken out, creating further fear in the markets making everyone believe the true bear marketc is here. The idea is to flush everyone out of the market and make them believe its over, and once we get that, price will likely move AGGRESSIVELY to the upside.
The biggest sign for us right now to convince me we are not yet in a bearish cycle is the MONTHLY NOV close on TOTAL.
We still do have a lot of downside risk but ideally I'd like to see DEC close pretty strongly bullish.
⚠️ Disclaimer:
I am not a financial advisor. The content shared on this channel is for educational and informational purposes only and should not be considered financial advice.
Trading and investing in cryptocurrency involve high risk — you could lose some, or all, of your money. Always do your own research and make sure you understand the risks before making any financial decisions.


WEEKEND FORECAST - 1ST WEEK OF DECEMBER 2025Interesting overview for this coming. Markets are good.
5 Pairs on TOP WATCH. As well as 2 more Pairs on my WILDCARD.
Do like, follow for more overviews. Have a great month ahead.

ETHUSD – You have been warnedImagine you are on a high way speeding with a Porche 911 and running kinda low on gas, and you spot a station where you could get gas for free. You would fill 3 tanks right away, right?
That is exactly why market makers love this repeating pattern in a bearish market. Why?! Because its free "gas"...free liquidity.
descending channel → fake breakout → long manipulation → deeper bleed.
---------------------------------------------------
Look at what happened in 2024
Price broke above structure swing high, dragged liquidity, faked strength…
and instantly got rejected back down
That’s not bullish momentum. That’s a liquidity fuel for the market.
Markets do this right before a bigger move down.
---------------------------------------------------
To be honest, ETH chart is full of F U moves all over the place. But, the basic principles kinda remain intact.
In 2024 after the long manipulation, price fully respected the previous swing low.
And that should be the same case now with our swing low.
We are in a bearish trend, don't ego fight the market.
However, if price broke our previous swing low its literally free fall to $800~$1k
---------------------------------------------------
Your chart’s projection is clear:
Sweep the lows, Trap the late shorts, Send ETH flying back to $4k+
But not before the pain.
---------------------------------------------------
Good Luck!

Selena | ETHUSD 2H — Bullish Momentum Retest Setup |COINBASE:ETHUSD
After a strong sell-off, ETH formed a base around $2620 and reclaimed structure. The recent breakout and consolidation suggest accumulation before continuation. As long as price holds above $2940–$3000, bullish continuation remains favored toward the next supply zone
Key Scenarios
✅ Bullish Case 🚀
If price holds above $2940–$3000 support:
🎯 Target 1: $3200
🎯 Target 2: $3350–$3450 (major supply zone)
❌ Bearish Case 📉
A clean break below $2940 may invalidate the bullish structure and open deeper retracement.
Current Levels to Watch
Support Zone: $2940–$3000
Rising Channel Support
Liquidity Target: $3350–$3450
⚠️ Disclaimer: This analysis is for educational purposes only. Not financial advice.

ETH/USD on the 30-minute timeframeNeutral Chart Interpretation
This chart shows ETH/USD on the 30-minute timeframe, with focus on how price is reacting around moving averages and key zones.
1. Price Near Short-Term Compression
ETH is moving sideways close to the EMA 7, EMA 9, and EMA 21.
This clustering of EMAs usually reflects reduced volatility and a short-term indecision zone.
2. Immediate Resistance (R1)
A small green zone (R1) marks the first area where price previously reacted.
Price is testing this zone again, suggesting that this is an area where sellers have shown interest before.
3. Higher Resistance Zone
A larger green resistance zone is placed above R1.
This area reflects a bigger supply region where price may face additional difficulty continuing upward.
4. Support Zone Below Current Price
A red support region is highlighted under the EMAs.
This shows the nearest area where ETH previously stabilized after downward movement.
5. Lower Support (S2)
A deeper support zone is marked further below.
This is a broader area where price experienced a strong reaction earlier, possibly indicating stronger interest from buyers.
6. EMA21 Trend Context
The EMA21 (black line) is trending downward and still positioned above price.
This suggests the broader timeframe is still recovering from prior weakness.

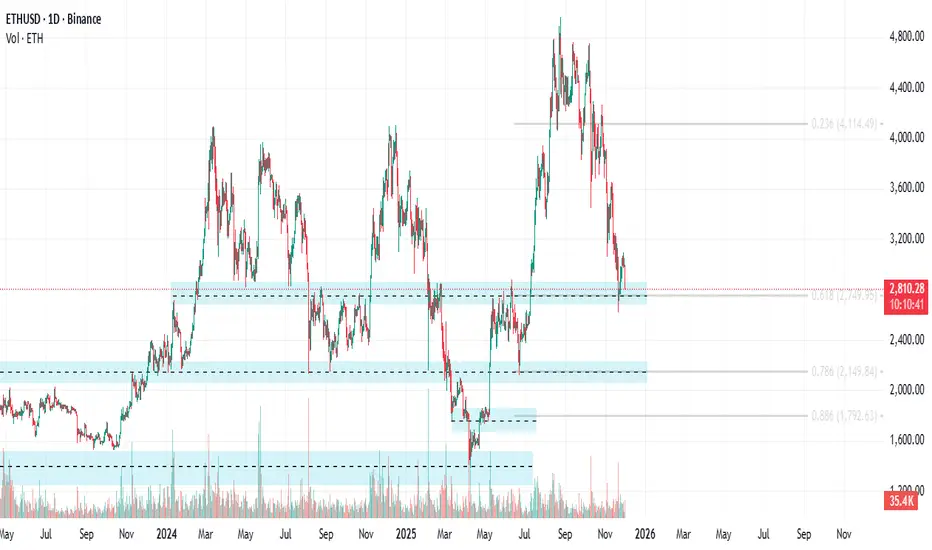
ETH/USD — Downtrend Extends as Price Tests Key Support ZoneETH/USD remains in a medium-term downward trend, correcting against the long-term structure.
The pair has broken below the descending channel and is now testing the support area at 2812.50–2720.00
(Murray , 61.8% Fib). A firm daily/weekly close below 2720.00 would confirm downside continuation toward:
• 2187.50 (Murray )
• 1875.00 (Murray )
A reversal scenario becomes valid only if ETH reclaims the 3437.50–3540.00 resistance zone
(Murray , 38.2% Fib, upper Bollinger Band). A breakout above this area would open targets at:
• 4062.50 (23.6% Fib, Murray )
• 4687.50 (Murray )
• 5000.00 (Murray )
Indicators:
Bollinger Bands are sloping downward, MACD stays negative, and Stochastic is turning lower.
On the weekly chart, price has reached the lower Bollinger Band, increasing the probability of another leg down.
⸻
Key Levels
Resistance: 3540 • 4062.50 • 4687.50 • 5000
Support: 2720 • 2187.50 • 1875
⸻
TradingView Scenarios
Primary Scenario — SELL STOP
• Entry: 2700
• TP: 2187.50 / 1875
• SL: 3100
• Bias: Bearish below 2720
• Timeframe: Weekly
Alternative Scenario — BUY STOP
• Entry: 3570
• TP: 4062.50 / 4687.50 / 5000
• SL: 3240
• Bias: Bullish above 3540

eth on smaller time blood be comingfor everyone this is a picture how things will look we can see clearly there was a triple top rejection off resistance and it looks as if we are in wave 3 of 5 update is a possible 45% draw down.time frame is we are in a bear market that started in October since then we have seen a 45% drop and if next major support would make from the high to my target a total of 65% which is not uncommon in crypto. extremely possible another 45% down from current price. be safe

$ETH – Classic Breakdown → Bounce → Reshort Setup Into 20 SMACRYPTOCAP:ETH – Classic Breakdown → Bounce → Reshort Setup Into 20 SMA Resistance
Ethereum ( CRYPTOCAP:ETH ) is giving one of my all-time favorite continuation short setups — a clean breakdown, followed by a weak bounce right back into the 20 SMA, which is exactly where momentum names often fail.
🔹 The Setup:
• After the big swoosh down, CRYPTOCAP:ETH is now bouncing right into the shaded zone between the 9 EMA and 20 SMA.
• I call this area the Bone Zone — where broken trends come to die.
• CRYPTOCAP:ETH is showing zero character change on the bounce: lighter volume, lower high structure, no real demand.
🔹 Why This Is Textbook:
• Breakdown → weak retrace → touch of the 20 SMA = the exact continuation short I’ve traded for nearly 20 years.
• The 20 SMA often acts as the “kiss of death” in downtrends when momentum has already flipped.
• Crypto across the board is soft — CRYPTOCAP:BTC cracking key levels, CRYPTOCAP:ETH failing to reclaim anything meaningful.
🔹 My Trade Plan:
1️⃣ Entry: Short into the 20 SMA rejection inside the Bone Zone.
2️⃣ Risk: Stop just above the 20 SMA — clean and mechanical.
3️⃣ Target: A retest of the breakdown lows first, then mid to low -$2,000s if momentum continues.
Why I Love This Setup:
• Same breakdown pullback pattern I’ve run for decades — clean, high R/R, predictable.
• Structure is perfect and risk is tight.

ETHUSD | Don’t get fooled...Understand the chartTL;DR: This chart looks like what happened in 2021 in a ridiculous way. A breakout, a rejection, a relief rally, then a painful descent through layered support zones.
I really don’t want to be the guy who says “I told you so” but charts teach with loss as often as profit.
Look at what happened when ETH reached ATH in 2021. A clear breakout and immediate rejection. Price then collapsed with multiple spikes to trick HODLers and bull for life traders.
----------------------------------------------
The lesson the chart here to offer
If our analysis is correct, we’ll see a short-lived manipulation into resistance ($3.6–$4.0k) that will suck in all longs.
What happens next you may ask? Straight down to support zones.
Breaking one support usually leads to the next.
----------------------------------------------
Practical rules to survive this (educational only):
Assume rallies are traps until proven otherwise. Wait for structure (higher lows + higher highs) on higher timeframes before adding long positions.
Manage size. If you trade this, keep position sizing small and protect capital with stops and trailing stops when in a winning trade.
Use multi-timeframe confirmation. Don’t buy solely on daily candles. Micro structure of a daily candle forms on smaller timeframes.
If you want to accumulate, always scale. Don’t all-in. That way you better position yourself, increase your profit and decrease your loss
As always...Stay disciplined.
----------------------------------------------
Good Luck!
P.S: Check the linked idea for a better understanding.

ETHUSD SIGNALThis signal is generated using a disciplined, data-driven approach that evaluates price action, trend dynamics, and liquidity distribution. The trade setup highlights a moment where market conditions align to create a balanced opportunity with a favorable risk-to-reward profile.
The analysis emphasizes precision and clarity, focusing on key decision zones where buyers or sellers are most likely to take control. This signal is crafted to help traders navigate the market with structure, consistency, and confidence.
📌 Signal Breakdown
Entry Level: Identified through market structure validation and momentum confirmation
Stop-Loss (SL): Placed at a strategic invalidation zone for controlled downside risk
Take-Profit (TP): Target levels modeled around liquidity pockets, trend projections, and volatility range
Technical Reasoning: A brief yet clear explanation outlining the logic behind the chosen direction
Market Scenarios: Expected price behavior under both bullish and bearish conditions
⚠️ Disclaimer
This signal is not financial advice and is intended solely for analytical and educational purposes. Always manage your risk appropriately and stay adaptable to changing market conditions.

ETHUSD H1 | Bullish Bounce Off SupportMomentum: Bullish
Price is currently above the ichimoku cloud, and is still above the ascending trendline.
Buy entry: 2,982
- Overlap support
- 50% Fib retracement
Stop Loss: 2,896.63
- Swing low support
Take Profit: 3,076.67
- Swing high resistance
High Risk Investment Warning
Stratos Markets Limited (tradu.com/uk ), Stratos Europe Ltd (tradu.com/eu ):
CFDs are complex instruments and come with a high risk of losing money rapidly due to leverage. 70% of retail investor accounts lose money when trading CFDs with this provider. You should consider whether you understand how CFDs work and whether you can afford to take the high risk of losing your money.
Stratos Global LLC (tradu.com/en ): Losses can exceed deposits.
Please be advised that the information presented on TradingView is provided to Tradu (‘Company’, ‘we’) by a third-party provider (‘TFA Global Pte Ltd’). Please be reminded that you are solely responsible for the trading decisions on your account. Any information and/or content is intended entirely for research, educational and informational purposes only and does not constitute investment or consultation advice or investment strategy. The information is not tailored to the investment needs of any specific person and therefore does not involve a consideration of any of the investment objectives, financial situation or needs of any viewer that may receive it. Past performance is not a reliable indicator of future results. Actual results may differ materially from those anticipated in forward-looking or past performance statements. We assume no liability as to the accuracy or completeness of any of the information and/or content provided herein and the Company cannot be held responsible for any omission, mistake nor for any loss or damage including without limitation to any loss of profit which may arise from reliance on any information supplied by TFA Global Pte Ltd.

ETHUSD – Inverse Head & Shoulders Reversal TargetEthereum (ETHUSD) on the 1-hour timeframe has formed a clean Inverse Head & Shoulders structure, signaling a potential bullish reversal after an extended downtrend. The price has produced a classic three-point pattern: Left Shoulder, a deep Head, and a developing Right Shoulder, all aligning beneath a descending neckline.
🔍 Key Technical Highlights
Strong downtrend transitioning into a basing reversal formation.
Clear identification of Left Shoulder, Head, and Right Shoulder.
A descending neckline has formed, acting as major breakout resistance.
Once price breaks above the neckline, a bullish continuation toward the projected target becomes likely.
The measured-move target (pattern height) aligns near the $3,600–$3,700 zone.
🎯 Bullish Breakout Target
Target Zone: ~$3,600 – $3,700
(based on the height from the head to neckline)
⚠️ Notes for Traders
Confirmation requires a candle close above the neckline.
A retest of the neckline may offer a high-probability entry.
Failure below the right shoulder low may invalidate the pattern.
ETH can move aggressively during breakouts—risk management is essential.

