ETH - Long - 3880ETHUSD is expected to bounce back from the levels of 2970.
The Crypto has strong support on that level of 2970.
Further support at 2680.
Trade ideas

ETHUSD Outlook!**Swing Analysis →Daily chart**
Price is in a bullish trend. We recently saw a correction towards discounted prices on daily timeframe. I am expecting longs around the marked OB{2335.8-2102.89} which lines up with the weekly key level around {2122.50}. From this point we could potentially see buyers stepping in, as this level has proven to be a key area for institutions to start buying Ethereum. Swing structure is Bullish.
**Internal structure → 4H chart**
Following internal structure, price is in a bearish trend and we recently broke below the last LL and reacted from the weekly key level {2816.00{ and we saw buyers stepping in correctively to push price higher towards the previous weekly {3056.75} level/LL which lines up perfectly with daily OB {3245.99-3102.00} and 50% Fibonacci level which has been common retracement point for ETHUSD since the bearish trend has started. I am expecting shorts to push price lower towards daily OB or key level mentioned above. Initially target is 2620.68 and a break below will open doors towards the weekly key level. Internal structure is bearish.

ETH USD
HI GUYS
UPDATE ON THE ON GOING TREND
I expect buys sat,sun double bottom for long entries.
if u guys are still holding the 1st entries we made at the beginning,well congratulation


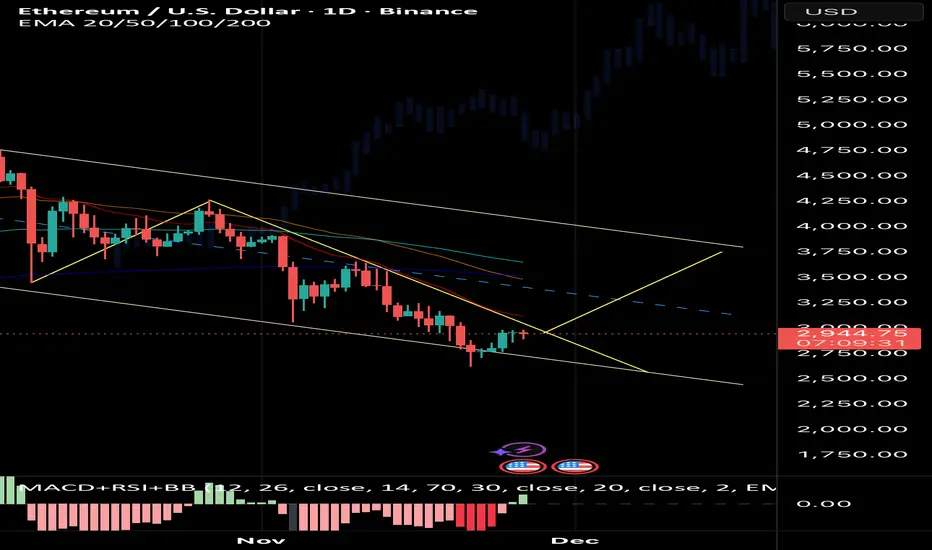
ETH Technical Analysis: Relief Bounce, But the Downtrend RemainsETH Technical Analysis: Relief Bounce, But the Downtrend Remains Intact
1. ETHUSD has been forming lower swings continuously, reinforcing a dominant downtrend. Supported by a sign of bearish EMA stack to the 100 EMA, signalling a broader corrective phase with strong bearish momentum.
2. There are still no bullish reversal signals yet, suggesting that any rebound is likely to be a short-term relief rally, forming a lower high before the downtrend resumes.
3. Initial resistance is seen near 3,275, where former support and the EMA20 may act as a supply zone before another leg lower.
4. If ETHUSD breaks below support at 2,730, it could unlock further downside toward the next key support around 2,100.
Analysis by: Krisada Yoonaisil, Financial Markets Strategist at Exness

ETHUSD oversold bounce back capped at 3,246The ETHUSD pair continues to display a bearish outlook, in line with the prevailing downward trend. Recent price action suggests a corrective pullback, potentially setting up for another move lower if resistance holds.
Key Level: 3,246
This zone, previously a consolidation area, now acts as a significant resistance level.
A failed test and rejection at 3,246 would likely resume the bearish momentum.
Downside targets include:
2,860 – Initial support
2,777 – Intermediate support
2,670 – Longer-term support level
Bullish Scenario (breakout above 3,246):
A confirmed breakout and daily close above 3,246 would invalidate the bearish setup.
In that case, potential upside resistance levels are:
3,350 – First resistance
3,460 – Further upside target
Conclusion
ETHUSD remains under bearish pressure, with the 3,246 level acting as a key inflection point. As long as price remains below this level, the bias favours further downside. Traders should watch for price confirmation around that level to assess the next move.
This communication is for informational purposes only and should not be viewed as any form of recommendation as to a particular course of action or as investment advice. It is not intended as an offer or solicitation for the purchase or sale of any financial instrument or as an official confirmation of any transaction. Opinions, estimates and assumptions expressed herein are made as of the date of this communication and are subject to change without notice. This communication has been prepared based upon information, including market prices, data and other information, believed to be reliable; however, Trade Nation does not warrant its completeness or accuracy. All market prices and market data contained in or attached to this communication are indicative and subject to change without notice.

ETHUSD | Short ideaLooking for the next move down on ETHUSD here.
ETHUSD has been trending up for the last few days but I don't think the downtrend is over for now.
Could be right or could be wrong, I would like to hear what you are thinking.
Stay safe out there and do your own due diligence, this is not investment advise!

ETH hit my downside target now what?Wave 1 appears to have completed a leading diagonal with a poke above all-time high- what we expect from wave 1. Wave 2 is underway, testing the weekly 200EMA so far, and an expected reversal point- also the 0.382 Fibonacci retracement.
The retracement has been shallow, but ETH was beaten down and undervalued, making a shallow pullback expected. The 0.5 Fibonacci retracement is the next downside target at the S1 pivot.
🎯 Terminal target for the business cycle could see prices as high as $9000
📈 Weekly RSI was oversold with bearish divergence and has now reset below the channel EQ.
👉 Analysis is invalidated only if we get below the wave (4) bottom $1365
Safe trading

Buy and sell at 3400We are in the good buy position and go parabolic; love the buy at 3050 zone and 3040.. sell at 3400 should be a good short sell correction before going higher

ETH to at least $3700 on breakoutThe measured move from the breakout of this triangle atleast takes us to 36-3700$. Will have to clear 3100$ first, if we reject here then this idea is voided.
ETH Reversal??? Is it Finally Here???So, ETH has been pushing up quite a bit now these last couple of days, but is this a real pump back up, or is it a TRAP? I'll let you decide. Here's what I see....
As posted previously, we have seen an H1 BOS out of the HUGE Weekly Demand Zone. In fact, it came out of the Daily Source of that Weekly Zone, so this push back up is definitely expected. We have fallen so much and fell down to near the bottom of the Weekly Demand Zone.
So, this H1 BOS will nearly always lead to a pullback to the H1 Source of that break, or to the H4 Supply Zone. This is playing out perfectly. We have just pulled back to this H4 supply Zone.
So....This is the area to look for any confirmation that the overall sell will continue. This H4 Supply Zone is full of sellers waiting to dump ETH, and it needs to be tested.
What to look for here:
Inside of this H4 Supply Zone, we need to see a 15 Min BOS down to signal that this whole move was a huge fakeout to trap buyers. IF we see that, look for another fake-out return to the source of that break for the Fall of Falls.
What if it doesn't Stop:
We are ALWAYS Reading the market, not predicting it. So, if this move up is to continue, we must see a clear break of that H4 Supply Zone. An H4 Candle needs to close above that zone and give us a retest, with a bullish rejection. IF that happens, ETH can keep pushing up to the next target - the H1 Supply Source (3170 - 3200).
This is just clear, technical trading, folks, and if you've been following, the market has done almost exactly what it has TOLD us it would do.

Ethereum ( $ETH) Whales Load Up as Price Holds Key SupportEthereum trades near $2,939 after a volatile month that flushed out weak hands and pulled price into long-term support. The market now watches whale behavior closely, because large wallets often position early before major trend shifts. A well-known Hyperliquid whale — famous for earning nearly $200M shorting the October crash — has now opened a $44.5M ETH long, gaining over $300K within the first hour. His timing historically matters, and many traders view this as a signal that smart money expects a reversal.
On-chain data strengthens this view. Wallets holding 10,000–100,000 ETH added 440,000 ETH in one week, aligning their cost basis with current prices. Meanwhile, mid-tier wallets continue to sell into strength. This creates a classic compression scenario: institutional-grade buyers accumulate while smaller players distribute. One group will break soon — and whales rarely fold first.
Institutional flows also support the bullish narrative. US spot-ETH ETFs recorded $96.67M in inflows, ending an eight-day outflow streak. The Coinbase Premium Index climbed from -0.12 to -0.02, showing improving US demand. With rate-cut expectations above 80%, the macro backdrop now leans favorable for risk assets like ETH.
Regulatory developments add another catalyst. US regulators approved banks to custody Ethereum, unlocking access for pension funds, insurers, and large financial institutions. Combined with the upcoming Fusaka Hard Fork on December 3, 2025, which boosts scalability and blob capacity, Ethereum enters a new phase of adoption.
Technically, ETH hovers at its long-term support zone. If $3,000 holds, targets sit at $3,450 and $3,800. A close below $2,900 opens a path toward $2,150–$2,200. For now, whale accumulation, ETF flows, and improving sentiment signal accumulation rather than fear.

$ETH - Under $1400 in 2026You may not believe this I don't either, but this is my Scenario number 1 right now.

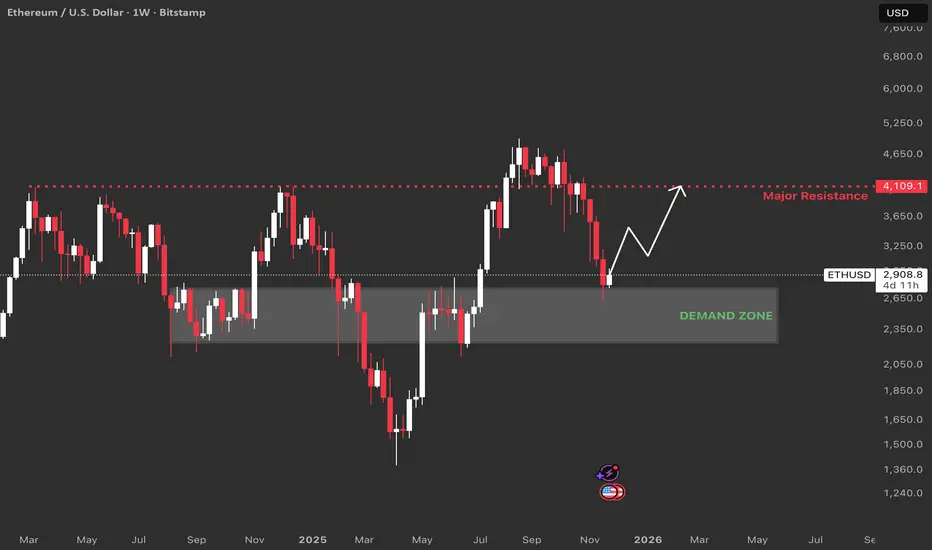
Ethereum Trade Setup: Weekly ChartDemand Zone : This area marks where ETH found buyers over multiple months, rejecting further declines. Historically, when price revisits this zone after a sell-off, it tends to bounce. The recent reaction confirms buyers are active and defending this level.
Major Resistance (4,109 USD) : It shows a prior weekly high and an expected supply or resistance area. This level also aligns with a golden pocket Fibb level, making it a confluence point where sellers could re-enter or bulls take profits.
Invalidation point: Weekly close below demand zone or multiple rejections with lower highs near demand.
ETH Trade Plan (December 10, 2025)ETH Trade Plan (December 10, 2025)
(D1 / H4 / H1 / M15)
⬛️ 1. Higher Timeframe Context (D1 and H4)
• D1 bias: bullish
• D1 range (approx): $3,000 – $4,000
• Key D1 zones:
• Supply: $3,800–$4,000 (historical resistance)
• Demand: $3,000–$3,300
• H4 bias: buy dips
• H4 zones of interest:
• H4 Sell Zone 1: – highs cluster
• H4 Buy Zone 1: – OB + demand
Active setups are trend-aligned with D1/H4.
⬛️ 2. Preferred Setups by Horizon
🔳 2.1 Swing Setup (D1/H4)
• Idea: Buy dips to $3,300 for $4,000+ (trend-aligned).
• Time horizon: multi-day.
• Context: Macro risk-on + on-chain strength.
🔲 2.2 Intraday Setup (H1 focus)
• Idea: Long above $3,370.
• Time horizon: intraday.
• Context: H4 impulse + rally regime.
▫️ 2.3 Scalp Setup (M15 focus)
• Idea: Buy pullbacks to $3,350 with absorption.
• Time horizon: minutes–hours.
▪️ 2.4 Arbitrage/Pairs Concept (if relevant)
• Long ETH/BTC – outperforming bias.
⬛️ 3. Entry Zones and Triggers
🟩 3.1 Long Setup (Trend-Aligned)
• Execution timeframe: H1
• Trigger timeframe: M15
• Entry zone:
• Context: H4 demand, whale flows supportive.
• Pattern tags:
Trigger conditions:
• Reclaim above $3,370 with positive delta.
• ML-Predictive (15m): upside ≥ downside.
• No extreme risk flags.
🔴 4. Stops (Invalidation Levels)
Long setups:
• Stop: $3,300.
• Logic: Break of demand; idea wrong below.
🟢 5. Targets
Long:
• TP1: $3,500 – H1 extension.
• TP2: $3,800 – H4 supply.
• TP3 (optional): $4,000 – D1 objective.
⬛️ 6. Position Sizing
• Baseline risk:
• Trend-aligned setups: 1.0.
• Adjust: low uncertainty + high alignment.
Final: 1.0 for trend long.
⬛️ 7. Risk Flags
• Put skew volatility.
• Fed event risk.
• High OI crowding.
⬛️ 8. Flip Conditions
• Long to bear: Close below $3,300 + negative funding.
⬛️ 9. Alternative Scenario
Rejection at $3,800: double top, short zone $3,750–$3,800, stop $3,850, targets $3,500/$3,300. Differs as failed breakout vs continuation.
⬛️ 10. Model Self-Critique
• Assumptions: Rally sustains on macro, no Fed surprise.
• Vulnerabilities: Sudden risk-off, misinterpreted flows.
• Do not chase highs without confirmation.
⬛️ 11. Uncertainty and Constraints
• Uncertainty.level: low.

ETHUSD H1 | Bullish Bounce Off Pullback SupportMomentum: Bullish
Price is currently above the ichimoku cloud.
Buy entry: 3,226.27
- Pullback support
- 50% Fib retracement
Stop Loss: 3,083.94
- Multi-swing low support
Take Profit: 3,380.09
- Overlap resistance
High Risk Investment Warning
Stratos Markets Limited (tradu.com/uk ), Stratos Europe Ltd (tradu.com/eu ):
CFDs are complex instruments and come with a high risk of losing money rapidly due to leverage. 70% of retail investor accounts lose money when trading CFDs with this provider. You should consider whether you understand how CFDs work and whether you can afford to take the high risk of losing your money.
Stratos Global LLC (tradu.com/en ): Losses can exceed deposits.
Please be advised that the information presented on TradingView is provided to Tradu (‘Company’, ‘we’) by a third-party provider (‘TFA Global Pte Ltd’). Please be reminded that you are solely responsible for the trading decisions on your account. Any information and/or content is intended entirely for research, educational and informational purposes only and does not constitute investment or consultation advice or investment strategy. The information is not tailored to the investment needs of any specific person and therefore does not involve a consideration of any of the investment objectives, financial situation or needs of any viewer that may receive it. Past performance is not a reliable indicator of future results. Actual results may differ materially from those anticipated in forward-looking or past performance statements. We assume no liability as to the accuracy or completeness of any of the information and/or content provided herein and the Company cannot be held responsible for any omission, mistake nor for any loss or damage including without limitation to any loss of profit which may arise from reliance on any information supplied by TFA Global Pte Ltd.

Bullish bounce off overlap suport?Ethereum (ETH/USD) is falling towards the pivot, which has been identified as an overlap support and could bounce to the 1st resistance, which acts a a swing high resistance.
Pivot: 3,238.27
1st Support: 3,047.27
1st Resistance: 3,620.30
Disclaimer:
The opinions given above constitute general market commentary and do not constitute the opinion or advice of IC Markets or any form of personal or investment advice.
Any opinions, news, research, analyses, prices, other information, or links to third-party sites contained on this website are provided on an "as-is" basis, are intended to be informative only, and are not advice, a recommendation, research, a record of our trading prices, an offer of, or solicitation for, a transaction in any financial instrument and thus should not be treated as such. The information provided does not involve any specific investment objectives, financial situation, or needs of any specific person who may receive it. Please be aware that past performance is not a reliable indicator of future performance and/or results. Past performance or forward-looking scenarios based upon the reasonable beliefs of the third-party provider are not a guarantee of future performance. Actual results may differ materially from those anticipated in forward-looking or past performance statements. IC Markets makes no representation or warranty and assumes no liability as to the accuracy or completeness of the information provided, nor any loss arising from any investment based on a recommendation, forecast, or any information supplied by any third party

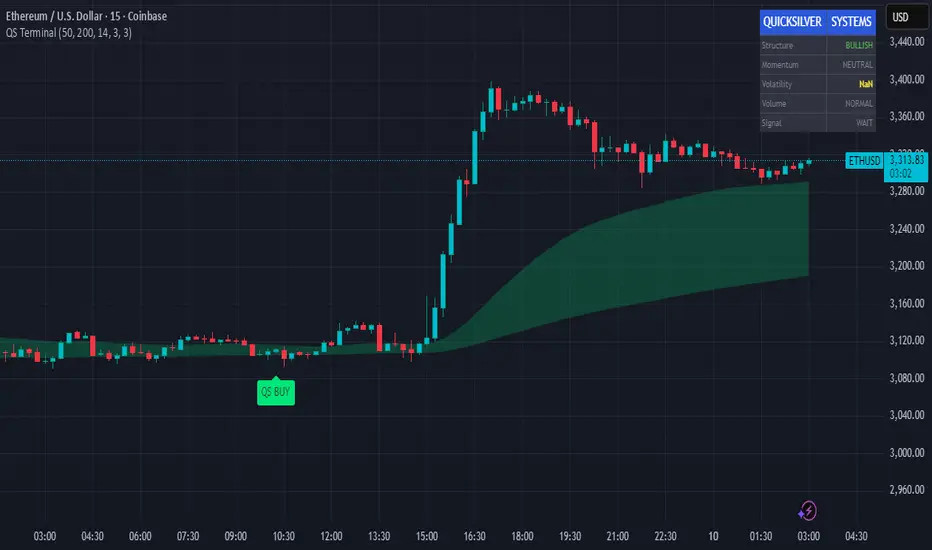
Quicksilver Master Terminal Overview
The Quicksilver Master Terminal is a comprehensive data visualization interface designed to bring institutional-grade market awareness to the retail chart. It replaces the need for multiple cluttered indicators by consolidating Trend, Momentum, Volatility, and Structure into a single Heads-Up Display (HUD).
Designed by Quicksilver Algo Systems, this tool is engineered for precision scalpers and prop firm traders who require instant situational awareness without switching timeframes.
Features
1. The Institutional HUD (Heads-Up Display)
Located in the top-right corner, this live dashboard provides real-time metrics on:
Market Structure: Instantly identifies if the asset is in a Bullish or Bearish regime relative to the 200 EMA.
Momentum Status: Tracks overbought/oversold conditions using smoothed Stochastic logic.
Volatility (ATR): Displays live Average True Range data for precise Stop Loss placement.
Volume Flow: Detects institutional volume spikes (1.5x average).
2. The Trend Cloud
A dynamic visual ribbon that fills the space between the Fast EMA (50) and Slow EMA (200).
Green Cloud: Strong Bullish Trend (Look for Longs).
Red Cloud: Strong Bearish Trend (Look for Shorts).
Cross: Visual warning of trend reversals.
3. Sniper Signal Logic
The script paints "INSTITUTIONAL BUY" and "INSTITUTIONAL SELL" labels only when high-probability confluence occurs:
Exhaustion: Stochastic RSI breaches extreme levels (<20 or >80).
Confirmation: Price action aligns with Heikin Ashi smoothing to filter noise.
Momentum: Fast %K crosses Slow %D.
How to Use
For Scalping (1m - 5m): Wait for the Trend Cloud to align with the Signal. Take "BUY" signals only when the Cloud is Green.
For Risk Management: Use the live "Volatility" number in the HUD to set your Stop Loss (e.g., 1.5x the current Volatility value).
About the Developer
This script is part of the Quicksilver Ecosystem. We build algorithmic solutions focused on capital preservation and risk management for funded traders.
Disclaimer: This tool is for educational market analysis only. Past performance is not indicative of future results.
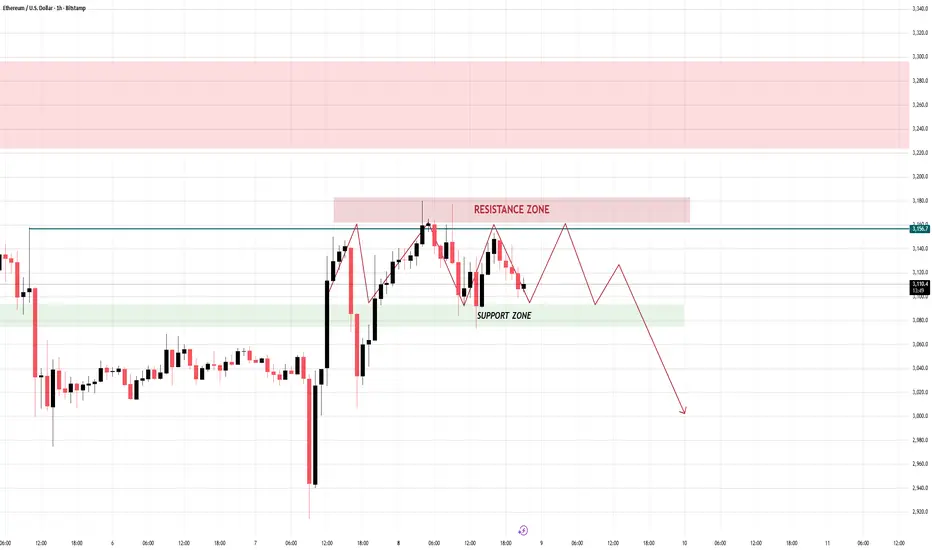
ETH Is Setting Up Something Big…1. Market Structure Overview
ETH is currently trading between two important HTF zones:
- Resistance Zone: 3150 – 3180
- Support Zone: 3050 – 3080
Price recently created a lower high rejection inside the resistance zone and is now pulling back toward support, signaling early weakness.
The overall structure shows:
- Short-term bullish push, but failing to break resistance
- Formation of LH → LL → LH, indicating bearish momentum emerging
- Market is compressing, preparing for a larger directional move
This aligns with the transition phase where liquidity is being collected before a breakout — typically to the downside.
2. Technical Analysis
Here’s what the chart reveals:
A. Resistance Rejection
Price tapped directly into the 3150–3180 resistance zone, leaving a long wick followed by impulsive selling.
→ This confirms strong sell-side presence.
B. Weak Bullish Recovery
The bounce from support lacks strength:
- Candles are smaller
- Momentum slowing
- Lower highs forming
This reflects a market losing bullish pressure.
C. Bearish Structure Development
The zig-zag projection shown matches current behavior:
- Price likely retests 3150
- Forms another Lower High
- Then breaks down sharply toward deeper support
D. Liquidity Map
- Liquidity sits below 3050
- Market is likely to sweep this level before strong buyers step in
→ Expect a liquidity grab before any major reversal.
3. Trading Plan (Entry – SL – TP)
🎯 SELL Setup (High-Probability)
Entry: 3145 – 3160
Stop Loss: 3188
Take Profit 1: 3080
Take Profit 2: 3020
Final Target: 2980
Reason:
Price is forming clean LH structure at resistance + bearish rejection → ideal position for swing short.
⚠️ Alternate Scenario (If invalidation occurs)
If price closes above 3190 on H1 → bearish idea invalid.
→ Stay out and wait for a bullish retest to re-enter long.
4. Summary
ETH is showing strong signs of distribution at resistance. The market is forming Lower Highs and preparing for a deeper decline toward the 2980 zone. The most optimal play is a sell entry at the resistance rejection, with tight SL and clear profit targets.
ETH USD HI GUYS,
There has been a delay on the sells , i expect sells to continue some time tomorrow price pattern (tue, wed) double top and target is (fri, sun) HS
Any way lets see what happens by end of the week as i read and track down this short swing sell

CRYPTO BULLISHETH and SOL break a HIGHER time frame trendline and look to lead in the crypto pump!!! What will happen next???

Crypto diversification checklist for your portfolioCrypto diversification checklist for your portfolio
When the market runs hot, it feels tempting to dump all capital into one coin that moves right now. The story usually ends the same way. Momentum fades, the chart cools down, and the whole account depends on one or two tickers. Diversification does not make every decision perfect. It simply keeps one mistake from breaking the account.
What a diversified crypto portfolio really means
Many traders call a mix of three alts and one stablecoin a diversified basket. For crypto it helps to think in a few clear dimensions:
asset type: BTC, large caps, mid and small caps, stablecoins
role in the portfolio: capital protection, growth, high risk
sector: L1, L2, DeFi, infrastructure, memecoins and niche themes
source of yield: spot only, staking, DeFi, derivatives
The more weight sits in one corner, the more the whole portfolio depends on a single story.
Checklist before adding a new coin
1. Position size
One coin takes no more than 5–15% of total capital
The total share of high risk positions stays at a level where a drawdown does not knock the trader out emotionally
2. Sector risk
The new coin does not fully copy risk you already have: same sector, same ecosystem, same news driver
If the portfolio already holds many DeFi names, another similar token rarely changes the picture
3. Liquidity
Average daily volume is high enough to exit without massive slippage
The coin trades on at least two or three major exchanges, not on a single illiquid venue
The spread stays reasonable during calm market hours
4. Price history
The coin has lived through at least one strong market correction
The chart shows clear phases of accumulation, pullbacks and reactions to news, not only one vertical candle
Price does not sit in a zone where any small dump is enough to hurt the whole account
5. Counterparty risk
Storage is clear: centralized exchange, self-custody wallet, DeFi protocol
Capital is not concentrated on one exchange, one jurisdiction or one stablecoin
There is a simple plan for delisting, withdrawal issues or technical outages
6. Holding horizon
The time frame is defined in advance: scalp, swing, mid term, long term build
Exit rules are written: by price, by time or by broken thesis, not only “I will hold until it goes back up”
Keeping the structure stable
Diversification helps only when the rules stay in place during noise and sharp moves. A simple base mix already gives a frame:
core: BTC and large caps, 50–70%
growth: mid caps and clear themes, 20–40%
experiments: small caps and new stories, 5–10%
cash and stablecoins for fresh entries
Then the main routine is to rebalance back to these ranges every month or quarter instead of rebuilding the whole portfolio after each spike.
A short note on tools
Some traders keep this checklist on paper or in a spreadsheet. Others rely on chart tools that group coins by liquidity, volatility or correlation and highlight weak spots in the structure. The exact format does not matter. The key is that the tool makes it easy to run through the same checks before each trade and saves time on charts instead of adding more noise. Many traders simply lean on indicators for this routine work because it feels faster and more convenient.
ETHUSD H1 | Bullish Breakout Off Pullback SupportMomentum: Bullish
Price is currently above the ichimoku cloud.
Buy entry: 3,129.51
- Pullback support
- 23.6% Fib retracement
Stop Loss: 3,075.69
- Swing low support
Take Profit: 3,225.90
- Swing high resistance
High Risk Investment Warning
Stratos Markets Limited (tradu.com/uk ), Stratos Europe Ltd (tradu.com/eu ):
CFDs are complex instruments and come with a high risk of losing money rapidly due to leverage. 70% of retail investor accounts lose money when trading CFDs with this provider. You should consider whether you understand how CFDs work and whether you can afford to take the high risk of losing your money.
Stratos Global LLC (tradu.com/en ): Losses can exceed deposits.
Please be advised that the information presented on TradingView is provided to Tradu (‘Company’, ‘we’) by a third-party provider (‘TFA Global Pte Ltd’). Please be reminded that you are solely responsible for the trading decisions on your account. Any information and/or content is intended entirely for research, educational and informational purposes only and does not constitute investment or consultation advice or investment strategy. The information is not tailored to the investment needs of any specific person and therefore does not involve a consideration of any of the investment objectives, financial situation or needs of any viewer that may receive it. Past performance is not a reliable indicator of future results. Actual results may differ materially from those anticipated in forward-looking or past performance statements. We assume no liability as to the accuracy or completeness of any of the information and/or content provided herein and the Company cannot be held responsible for any omission, mistake nor for any loss or damage including without limitation to any loss of profit which may arise from reliance on any information supplied by TFA Global Pte Ltd.
