ETH Flips MSB and Holds Demand – 3.1K CrucialEthereum flipped bullish MSB off the 2.7–2.9 demand block and is now testing structure at 3.1K. RSI and MACD both support continuation, but price is hesitating below major OB zones near 3.6K and 4.2K.
If ETH holds 3.05, bulls can target 3.5K short-term. A failure here puts 2.9 back on the table.
Momentum is building — now ETH needs to deliver.
Bias: Bullish
Pair: ETH/USDT
Timeframe: 12H
Trade ideas

ETH Pauses as Market Awaits Fed SignalETH on the H4 timeframe is moving sideways between 3,080–3,130 after a strong rebound from 2,750–2,800, signaling a shift into consolidation rather than continuation. The current zone overlaps a previous high-volume distribution area, while a flat Ichimoku cloud reflects indecision. Price hasn’t broken past the last high, and the lower FVG at 2,980–3,050 may still attract a retest. A clean breakout above 3,150–3,200 is needed to confirm upside momentum; until then, ETH remains in wait-and-see mode ahead of the Fed.

ETHUSD Long Bias ExplanationLet me walk you through why I’m positioned for buys on ETHUSD, and how the structure aligns with the institutional price-delivery model I’ve used for over a decade.
1️⃣ Higher-Timeframe Context — The Range Is Defined
ETH is currently trading within a well-defined HTF range, with:
A major supply zone above
A clear liquidity shelf below
Clean mid-range levels that are being actively traded
Price has shown multiple rejections from the lower parts of the range, confirming that institutions are accumulating positions rather than distributing.
2️⃣ The Sell-Off Into Discount Was an Accumulation Phase
The sharp drop you see on the left side wasn’t random — that was engineered liquidity, pulling price into a discount zone.
Inside that drop, we see:
A liquidity sweep of the equal lows
A mitigation of a previous inefficiency
A strong displacement candle back upward
This is a textbook model of institutional accumulation before expansion.
3️⃣ Break of Structure ⇒ Transition Into a Bullish Cycle
Once price completed the sweep of the lows, it immediately delivered:
A strong BOS (Break of Structure)
A shift from corrective pullbacks to impulsive bullish delivery
Displacement candles clearing internal liquidity
This is the exact transition signature that confirms the bearish phase has ended and the bullish phase is beginning.
4️⃣ The Trendline Break + Retest Confirms Institutional Buy-Side Delivery
On your chart, the downward trendline acted as:
A liquidity magnet
A retail-based bearish structure trap
An engineered point of interest for institutions to gather liquidity
Price broke through this trendline aggressively, then pulled back to retest the underside of it.
This retest wasn’t random — it was:
A mitigation of the origin of the impulse
A validation that sell-side liquidity below the trendline has been collected
A high-probability higher-low formation
This is exactly the kind of confluence I wait for in my own trades — break, retest, confirm.
5️⃣ Internal Structure Shows Clear Bullish Re-Accumulation
After the breakout, the internal structure demonstrates:
Higher highs and higher lows
Bullish re-tests of key horizontal levels
Reduced selling momentum after each pullback
Imbalances being filled before continuation
Everything about this structure suggests smart money is supporting the move upward.
6️⃣ Liquidity Pools Are Above Current Price — A Magnet for Continuation
Above your entry zone, price has:
Untapped buy-side liquidity
Equal highs
Clean inefficiency pockets
A large unmitigated supply zone
These areas represent targets for bullish delivery.
Institutions don’t leave liquidity behind — they go collect it.
7️⃣ TP1 Matches Institutional POI Targeting
TP1 lines up almost perfectly with:
A prior structural high
A liquidity pool
A breaker block that price previously used as a reaction point
This TP placement isn’t random — it’s aligned with the exact levels institutions target during expansions.
It’s the first logical take-profit point before price reaches the major HTF supply above.
8️⃣ Summary — Why I’m Bullish on ETHUSD
Here’s the institutional reasoning shaping my bias:
HTF range defined → price trading near discount
Lows swept → liquidity collected
Strong BOS → bullish transition confirmed
Trendline broken & retested → confluence for continuation
Internal structure bullish → accumulation, not distribution
Liquidity above → strong magnet for upward delivery
TP1 aligns with liquidity + structural POI
This is the same setup I’ve taken hundreds of times:
accumulation → structural shift → breakout → retest → expansion.

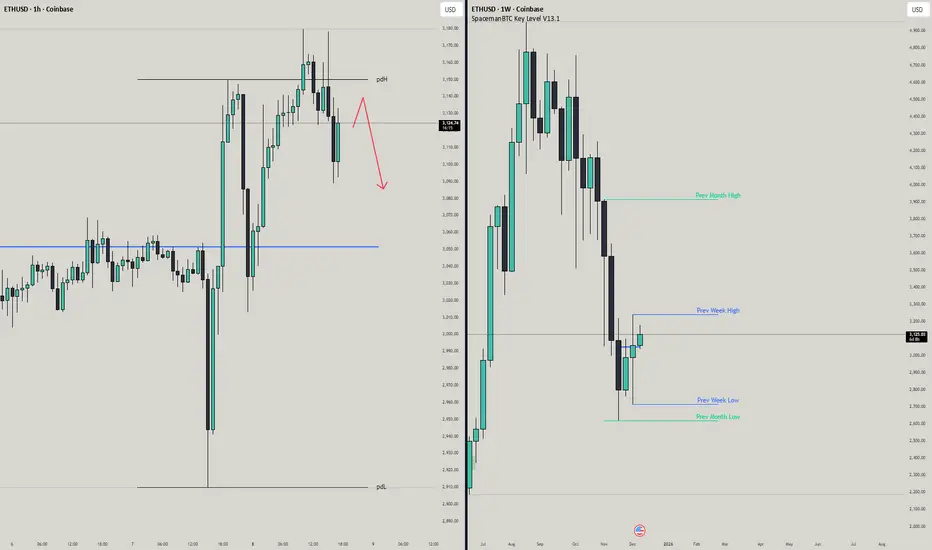
ETHUSD | RejectedEthereum showed a big rejection from the previous day high, same with bitcoin.
Will be looking for a retest of this level before going into any short positions.
When this retest happens I will be looking for a 15-30 minute candle close under the PDH.
Will be very careful entering though, daily chart is starting to look funky, with the weekly showing 2 green candles as well.
There certainly has been some bullish momentum that came in the last few days.
Let me know what your analysis is!
Stay safe out there and do your own due diligence, this is not investment advise!
ETHUSD — Bearish Retracement Toward Demand ZoneETHUSD is currently trading inside a broader distribution structure, with price repeatedly rejecting the strong supply zone near the 3,230–3,260 area. Multiple seller zones, along with the breakdown from the recent range, indicate weakening bullish momentum.
Price has shifted from an earlier UTA uptrend channel into a more corrective DTA structure, showing clear signs of distribution. After failing to break above supply, the market is forming lower highs and consolidating near 3,120—suggesting bearish pressure is building.
If the current range fails to reclaim upside levels, ETHUSD is likely to continue its downward corrective move toward the marked support around 3,030. A deeper drop could extend to the 2,910–2,950 demand zone, which is the next strong liquidity pocket. This is where buyers previously stepped in aggressively, making it a high-reaction area.
Overall, structure favors downside continuation unless price reclaims the upper seller zone with strong bullish momentum.
If this chart helped you understand the market structure more clearly, show some support! Like the post, drop a comment, and follow the profile to get more consistent updates, smart money concepts, and high-quality trade setups.

Gold in Global Trade: An Analysis of SafetyHistorical Stability of Gold
Historically, gold has been valued for its scarcity, durability, and universal acceptance. Unlike fiat currencies, which can be printed and devalued by governments, the supply of gold is limited. This scarcity ensures that gold retains intrinsic value, making it a reliable store of wealth. During periods of economic crisis, wars, or geopolitical instability, investors have consistently turned to gold as a safeguard against currency depreciation and inflation.
For example, during the 2008 global financial crisis, while stock markets plunged worldwide, the price of gold surged as investors sought a safe store of value. Similarly, countries with unstable economies often rely on gold reserves to stabilize their currencies and trade imbalances. This historical consistency has cemented gold’s reputation as a safe and liquid asset in global trade.
Gold as a Hedge Against Currency Fluctuations
One of the primary reasons gold is considered safe in global trade is its role as a hedge against currency fluctuations. In international trade, currency values are volatile and can be affected by inflation, monetary policy, and political instability. Gold, priced in major currencies like the US dollar, provides a buffer against these risks. When the dollar weakens, gold prices often rise, maintaining purchasing power for traders and investors.
Central banks around the world also hold substantial gold reserves as a part of their foreign exchange strategy. By diversifying their reserves between currencies and gold, they can mitigate risks associated with sudden currency devaluation. This demonstrates the critical role gold plays not only for individual investors but also in stabilizing global trade systems.
Liquidity and Global Acceptability
Another factor contributing to gold’s perceived safety is its universal acceptability and liquidity. Unlike other commodities, gold can be traded easily in almost any market globally, from New York to Dubai, Singapore, or London. This ease of transaction ensures that gold can be converted into cash quickly in times of need, which is particularly important during trade disruptions or financial crises.
Gold is also highly standardized, with global markets adhering to consistent purity standards (typically 24-karat or 99.99% pure). This standardization reduces transaction friction, making gold a reliable medium in global trade, especially in situations where other financial instruments or fiat currencies may lose value due to instability.
Risks Associated with Gold in Global Trade
Despite its historical reliability, gold is not entirely risk-free. Investors and traders should consider several factors before assuming that gold is “completely safe.”
1. Price Volatility: Although gold is less volatile than stocks or cryptocurrencies, it still experiences significant price fluctuations. Global demand, interest rates, inflation expectations, and geopolitical events can all cause sharp swings in gold prices. For example, during periods of rising interest rates, gold often underperforms because it does not generate income like bonds or equities.
2. Storage and Security Costs: Physical gold requires secure storage, insurance, and sometimes transportation logistics, which can add costs and reduce liquidity. In international trade, shipping large quantities of gold is expensive and risky, particularly in politically unstable regions.
3. Regulatory Risks: Governments may impose taxes, tariffs, or restrictions on gold trading and export, especially during periods of economic crisis. For instance, India historically imposed restrictions on gold imports to manage trade deficits, which affected international trade dynamics.
4. Opportunity Cost: Holding gold exclusively, without diversifying into other assets, carries an opportunity cost. In bullish equity markets or high-growth sectors, gold may underperform relative to other investment vehicles. Traders relying solely on gold may miss opportunities for higher returns elsewhere.
Gold in Modern Financial Systems
In today’s financial ecosystem, gold remains an essential instrument in global trade and investment, albeit with a more nuanced role. Beyond physical gold, financial derivatives such as gold futures, options, and exchange-traded funds (ETFs) have expanded its accessibility. These instruments allow investors and corporations to hedge against currency risk, inflation, and commodity price fluctuations without physically holding gold.
Gold ETFs, for example, have made gold trading more liquid and efficient, allowing smaller investors to participate in global gold markets. Central banks and large corporations also use gold swaps and forward contracts to stabilize their balance sheets and hedge risks in international trade. However, these financial instruments introduce counterparty risk, which is a new dimension compared to physical gold.
Gold and Global Trade Policy
Gold’s role in global trade is also influenced by geopolitical factors. Nations with substantial gold reserves are better positioned to weather economic sanctions, currency crises, or trade disruptions. Conversely, countries with limited access to gold may face vulnerabilities in international trade.
Additionally, the global pricing of gold is heavily influenced by the US dollar, as most gold transactions are denominated in dollars. This dependence means that shifts in US monetary policy or currency valuation can impact the global perception of gold’s safety. Thus, while gold remains a reliable hedge, its safety is not absolute; it is contingent on global economic and geopolitical dynamics.
Conclusion: Safe, But Not Risk-Free
In conclusion, gold is widely regarded as one of the safest assets in the global trade market due to its historical stability, scarcity, liquidity, and role as a hedge against currency fluctuations. It has consistently provided a buffer during financial crises, inflationary periods, and geopolitical instability. Its universal acceptability and standardization make it a reliable medium in international transactions.
However, gold is not entirely free from risks. Price volatility, storage and security costs, regulatory constraints, and opportunity costs mean that relying solely on gold is not a guaranteed safeguard. Modern financial instruments linked to gold, while increasing accessibility, also introduce new dimensions of risk.
Therefore, gold can be considered a relatively safe asset in global trade, but its safety is contextual. Investors, traders, and policymakers should treat it as a critical component of a diversified portfolio, rather than a standalone guarantee of security. In a complex and interconnected global economy, the “safest” strategy is one that balances gold with other financial instruments, currencies, and commodities to mitigate risk and maximize stability.

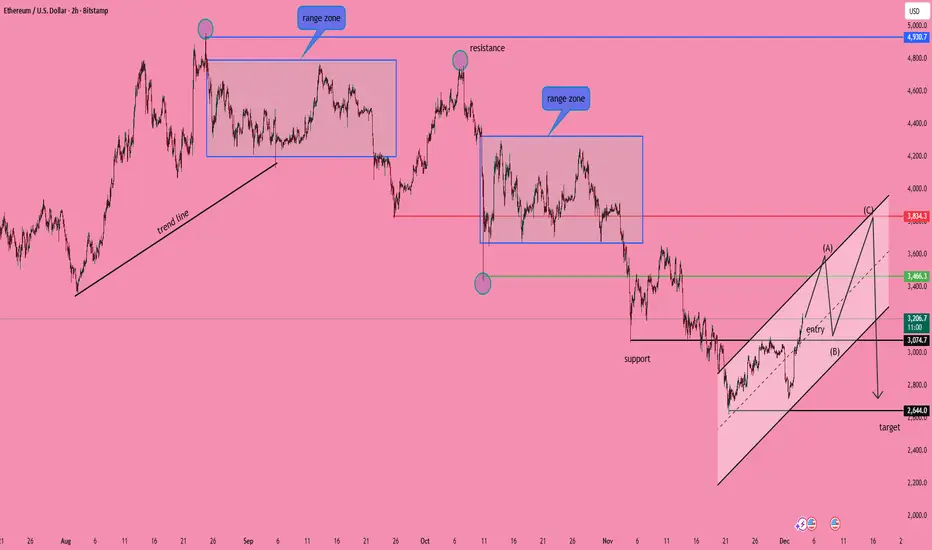
ETHUSD — two scenariosScenario 1:
Price may fluctuate within the 2,600–3,450 range for some time. After that, a move toward the 2,100–2,200 area becomes possible.
Scenario 2:
A direct drop into the 2,100–2,200 zone.
Since markets usually fall faster than they rise, the second scenario currently looks more likely.
---
Please subscribe and leave a comment.
You’ll get new information faster than anyone else.
---

Ethereum Outlook: Divergence + MA Breakout = Bearish Swing Bias🔍 ETH/USD – “Ethereum vs U.S. Dollar” Market-Capital-Flow Blueprint (Swing Trade) 💼💥
🧭 Overview
Hey Thief Tribe 👋, here’s the game plan for Ethereum (ETH/USD) in the crypto arena!
We’ve spotted a confirmed bearish breakout, with momentum fading on the downside.
This setup blends technical precision with layered stealth entries, built the Thief way 🕶️
Let’s stay sharp, swing smart, and rob those pips — professionally, of course! 😎
⚙️ Plan (Bearish Blueprint)
Two strong confirmations back the downside setup:
🔻 Moving Average Breakout – price sliced below key dynamic support (MA line).
🔻 MACD Divergence – momentum fading with lower highs on MACD.
📉 This combo confirms a short bias, preparing us for controlled, layered entries.
💰 Entry (Thief Style – Layering Strategy Explained)
This isn’t a one-shot entry — it’s a strategic ambush plan 😏
We’ll use multiple sell limit orders, spacing them for precision & flexibility:
🧩 Example Layer Setup:
1️⃣ Sell Limit – $3 900.0 → Top layer, catching early weakness near resistance.
2️⃣ Sell Limit – $3 800.0 → Second layer, adding position as momentum confirms.
3️⃣ Sell Limit – $3 700.0 → Sweet zone: aligns with MA retest area.
4️⃣ Sell Limit – $3 600.0 → Deep layer for confirmation or fake-out retrace.
💡 You can expand or tighten your layers based on volatility or personal risk tolerance.
This “scaling-in method” helps manage risk while improving average entry.
🧨 Stop Loss (Defensive Shield)
🛑 Thief’s SL: $4 000.0 — aligned with the previous Higher-High structure.
🔸 This level invalidates the bearish setup if broken with strong volume.
⚠️ Note to all Thief OG’s:
I’m not recommending you use only my SL — trade smart, adapt your protection.
Your capital, your call, your responsibility. 💼
🎯 Target (Profit Escape Zone)
💎 Target: $3 200.0 — key support confluence zone where:
Moving average = police barricade 🧱
RSI likely hits oversold region 📊
Smart money may reverse from here 🔄
So once price nears that trap-reversal area, it’s time to secure profits & vanish gracefully 🏃♂️💨
⚠️ Note to all Thief OG’s:
You’re free to adjust your take profit. When you see green, take your gain! 💰
🔗 Correlated Pairs & Market Flow Watchlist
Stay alert with cross-checks 👇
🔹 BINANCE:ETHBTC → if ETH weakens vs BTC, bearish setup strengthens.
🔹 BITSTAMP:BTCUSD → if BTC falls too, it amplifies crypto market pressure.
🔹 TOTAL / TOTAL2 (Crypto Market Cap Charts) → confirm capital flow rotation.
📊 Correlations help validate or cancel our bias. Always zoom out before striking.
✨ If you find value in my analysis, a 👍 and 🚀 boost is much appreciated — it helps me share more setups with the community!
#ETHUSD #Ethereum #CryptoSwing #BearSetup #LayeringStrategy #ThiefTrader #LimitOrders #MACDDivergence #MovingAverageBreakout #CryptoFlow #SwingTrading #CryptoMarket

ETH Long RiskySpotted a potential long opportunity on ETH after a clean pullback into a demand area.
Price is currently retracing after a strong bullish leg, showing signs of slowing momentum on the way down.
🔹 Entry: 3049
🔹 Stop-Loss: 2974.72
🔹 Take-Profit: 3326.79, giving roughly a 1:4 R/R
🔹 Risk: ~2.4%
🔹 Reward: ~9.1%
Why I like this setup:
Clear bullish structure on the higher timeframes
Liquidity grab below previous lows
Price pulling back into a strong demand zone
Good risk-to-reward for a continuation play
Waiting for confirmation before full entry — a change of character (CHoCH) or bullish rejection wick would strengthen the setup.
Let’s see how it plays out. 🚀

Investing Worldwide: A Comprehensive Guide1. Why Invest Globally?
Global investing provides several advantages:
Diversification: Investing across different countries reduces the impact of localized economic downturns. For instance, if the U.S. market declines due to domestic issues, gains in Asian or European markets can offset losses.
Growth Opportunities: Emerging markets often exhibit higher economic growth rates than developed markets, providing potential for significant capital appreciation. Countries such as India, China, and Brazil have rapidly growing middle classes and expanding consumer markets, offering unique investment opportunities.
Currency Exposure: Investing internationally introduces currency diversification. A strengthening foreign currency against the investor’s home currency can amplify returns, although it can also magnify losses.
Access to Global Innovation: Many groundbreaking technologies, sustainable energy solutions, and healthcare advancements originate outside domestic markets. By investing globally, investors can participate in these high-growth sectors.
2. Types of Global Investments
Global investing can take various forms, each with distinct risk-return profiles:
Equities (Stocks):
Direct investment in foreign companies via local exchanges or American Depositary Receipts (ADRs).
Stocks offer growth potential but are susceptible to market volatility, political instability, and currency fluctuations.
Bonds:
Government and corporate bonds from different countries offer fixed income. Developed markets provide safety, while emerging markets often offer higher yields with increased risk.
Currency risk and interest rate differences are important considerations.
Mutual Funds and Exchange-Traded Funds (ETFs):
These pooled investment vehicles provide diversified exposure to international equities and bonds.
Specialized funds can target specific regions, sectors, or themes, such as technology in Asia or renewable energy in Europe.
Real Estate:
International property investments include commercial and residential real estate or Real Estate Investment Trusts (REITs).
Real estate offers income through rent and potential appreciation, but it requires awareness of local regulations and market dynamics.
Commodities and Natural Resources:
Investing in oil, gold, or agricultural commodities allows participation in global supply-demand trends.
Commodities are influenced by geopolitical events, weather conditions, and currency movements.
Alternative Investments:
Private equity, hedge funds, and venture capital provide access to high-risk, high-reward opportunities worldwide.
These typically require larger capital and a higher risk tolerance.
3. Key Factors Influencing Global Investing
Investing internationally requires analyzing factors that impact financial performance beyond domestic borders:
Economic Indicators: GDP growth, inflation, employment rates, and consumer spending patterns indicate a country’s economic health.
Political Stability and Governance: Elections, regulations, trade policies, and geopolitical tensions can significantly affect market confidence and investment returns.
Monetary Policy: Central bank policies on interest rates and liquidity influence investment decisions, particularly for bonds and currency-sensitive assets.
Currency Fluctuations: Currency appreciation or depreciation can enhance or reduce returns. Hedging strategies are often employed to mitigate currency risk.
Market Liquidity and Accessibility: Some markets, especially in emerging economies, may have lower liquidity or restrictions on foreign ownership, affecting entry and exit strategies.
Cultural and Social Factors: Consumer behavior, labor practices, and technological adoption can influence the success of sector-specific investments.
4. Investment Strategies for a Global Portfolio
A global portfolio requires careful allocation and strategic planning:
Geographical Diversification:
Spread investments across developed, emerging, and frontier markets to balance risk and opportunity.
For example, an investor may allocate 50% to developed markets (USA, UK, Japan), 30% to emerging markets (India, China, Brazil), and 20% to frontier markets (Vietnam, Nigeria).
Sector Diversification:
Allocate across industries such as technology, healthcare, energy, and consumer goods to mitigate sector-specific risks.
Currency Hedging:
Use financial instruments like forwards, options, or ETFs to protect against adverse currency movements.
Active vs. Passive Management:
Active management involves selecting individual securities and timing market entry/exit, aiming for superior returns.
Passive strategies, like investing in global index funds, provide broad market exposure with lower costs.
Thematic and ESG Investing:
Investors can focus on global themes such as clean energy, artificial intelligence, or sustainable development.
ESG (Environmental, Social, and Governance) investing is growing worldwide, attracting capital towards responsible companies.
5. Risks Associated with Global Investing
While global investing offers diversification and growth potential, it also introduces unique risks:
Market Volatility: International markets may experience higher volatility due to political events, economic crises, or natural disasters.
Currency Risk: Investments denominated in foreign currencies can fluctuate in value when converted to the investor’s home currency.
Regulatory Risk: Differences in taxation, securities regulations, and legal systems can impact returns and exit strategies.
Liquidity Risk: Some international markets may have limited liquidity, making it challenging to buy or sell assets quickly.
Geopolitical Risk: Trade wars, conflicts, sanctions, and terrorism can affect investment performance.
6. Global Investment Trends
Emerging Market Growth: Asia, Africa, and Latin America continue to attract capital due to high growth potential.
Technology and Innovation: Investments in AI, biotechnology, fintech, and electric vehicles are reshaping global markets.
Sustainable Investing: ESG and impact investing are becoming mainstream, reflecting investor preference for socially responsible strategies.
Digital Assets and Fintech: Cryptocurrencies, blockchain, and online trading platforms have increased access to global investments.
7. Practical Steps for Global Investors
Assess Risk Tolerance: Determine how much exposure to foreign markets aligns with your financial goals and risk appetite.
Research Markets: Analyze economic indicators, political stability, and sector potential.
Diversify: Avoid over-concentration in a single country or asset class.
Consider Costs: Factor in transaction fees, taxes, and currency conversion costs.
Use Professional Help: Global investing can be complex; financial advisors, international brokers, or global fund managers can provide valuable guidance.
Monitor Regularly: Global markets evolve rapidly; continuous monitoring and rebalancing are essential to optimize returns.
Conclusion
Investing worldwide offers immense opportunities for growth, diversification, and participation in global innovation. While the potential rewards are significant, investors must navigate risks associated with currency fluctuations, political instability, regulatory differences, and market volatility. By adopting a well-researched, diversified, and disciplined approach, global investors can enhance portfolio resilience, capture emerging opportunities, and achieve long-term financial goals. As globalization continues to deepen economic interconnections, international investing is no longer a niche strategy—it is increasingly essential for those seeking to maximize returns while managing risk in a complex, interconnected world.

ETH/USD 1H — Bearish Breakdown Towards Liquidity ZoneBITSTAMP:ETHUSD
ChatGPT said:
Below is exactly what you asked:
🧭 MARKING GUIDE (Chart Structure Explained)
Zone / Label Meaning
Market Zone (Sideways) Accumulation/distribution area → liquidity build-up
Trendline Support Break Structure shift → bearish control confirmed
Rejection Point Strong wick rejection → aggressive selling confirmation
Support = Demand Zone Buy orders activated → price rebounded strongly
Resistance Zone 3236-3225 Major supply area — liquidity consumed → reversal
Current Price Range Weak bounce — no strong buyer reaction
Target Zone 2980 ➜ 2721 Sell-side liquidity + unmitigated imbalance below
Bias → Bearish until price breaks 3098 convincingly.
✍️ TRADINGVIEW DESCRIPTION – Professional Format
📊 ETH/USD 1H — Bearish Breakdown Towards Liquidity Zone
Ethereum lost bullish structure after rejecting the 3236–3225 resistance and breaking below the rising trendline. Price retested the structure cleanly and failed to close back above 3098, confirming sellers remain dominant.
Market zones above show distribution — liquidity was taken → now price is hunting downside inefficiencies.
Current consolidation under resistance suggests continuation, targeting unfilled liquidity at the lower demand zone.
🔥 Key Scenarios
❗ Bearish Case (Primary Bias) 📉
Below 3098 → continuation expected
🎯 Target 1: 2980
🎯 Target 2: 2721 (full sweep)
⚠️ Invalidation
Break + hold above 3098, then price may revisit 3225–3236.

ETHUSD - Bullish Setup with Clear Risk-RewardTrade Setup:
Entry Point:
Enter at the price level of 3,020 only.
Stop-Loss:
Set the stop-loss at 2,965.86 (below the recent low), a 1.79% risk.
Target:
The target for this trade is 3,208.39, providing a potential upside of 5.17% (around 156.23 points).
Risk/Reward Ratio:
The setup offers a 3.01 risk/reward ratio—great potential for reward compared to risk.
📈 Why This Setup?
This trade has a solid risk-to-reward profile, with a clear entry point, stop-loss, and target.
The entry zone aligns with current market structure, and the target is based on key price levels.
💡 Trading Tip:
Stick to your risk management plan. Adjust the trade if market conditions change. Always be ready for any market movements!
Let’s see how this setup unfolds! 🔥
#ETHUSD #Crypto #Trading #TechnicalAnalysis #CryptoTraders #ETH #TradeSetup #RiskManagement

ETH 15m Analysis – Symmetrical TriangleETH 15m Analysis – Symmetrical Triangle
Price is consolidating inside a symmetrical triangle, showing lower highs and higher lows. This pattern usually leads to a directional breakout, and the breakout decides the next move.
EMAs (7/21/50) are close together, showing momentum compression before expansion.
✅ 📈 Long Setup (Bullish Breakout)
A long setup becomes valid if price breaks above the triangle resistance with a candle close.
🔺 Long Entry
Buy above: 3208–3210
🎯 Targets
TP1: 3225
TP2: 3240
TP3: 3260
🛑 Stop-Loss
SL below breakout: 3192
Reasoning:
A breakout above the triangle indicates renewed bullish momentum with EMAs supporting an upward push.
✅ 📉 Short Setup (Bearish Breakdown)
A short setup becomes valid if price breaks below triangle support.
🔻 Sell Entry
Sell below: 3180–3178
🎯 Targets
TP1: 3160
TP2: 3145
TP3: 3125
🛑 Stop-Loss
SL above broken support: 3195
Reasoning:
A break below the lower trendline signals sellers taking control, likely pulling price back toward EMA50 or lower.
📌 Summary
ETH is squeezing inside a symmetrical triangle.
Volume contraction confirms the compression phase.
Break above = bullish continuation.
Break below = bearish correction.

ETH Reclaims 3K – First Bullish Momentum Since BreakdownETH is showing its first convincing push since the mid-November breakdown. Price just reclaimed 3K with MACD flipping bullish and RSI crossing 60.
However, the price is still beneath the 3.6K–4.2K supply zone, meaning bulls still have work to do. A bullish MSB above 3.4K would confirm full reversal.
Momentum has shifted. Now it’s about follow-through.
Bias: Bullish
Pair: ETH/USDT
Timeframe: 12H
This is not financial advice, only data analysis. Please consult a qualified financial professional for personalized guidance.

ETHUSD (Ethereum / US Dollar) 15m Analysis & Trade SignalETHUSD (Ethereum / US Dollar) 15m Analysis & Trade SignalBias: Strong Bearish Continuation
Key Confluences: Major supply zone / distribution area at ~3,200–3,240 (multiple rejections)
Clear break of the bullish trendline + lower timeframe structure
Price has left a large Fair Value Gap (FVG) below and is now retracing into premium
Bearish order flow dominant after the deviation above 3,200
Trade Signal: SELL ETHUSDEntry: 3,165 – 3,185 (current zone or on a small pullback into the 15m/5m supply)
Stop Loss (SL): 3,252 (above the recent swing high & supply zone) → ~70–85 points risk
Take Profit 1 (TP1): 3,070 (liquidity grab + FVG fill) → ~100–120 points
Take Profit 2 (TP2): 2,930 – 2,900 (major demand zone & round number) → ~260–280 points
Risk-Reward: 1:3 – 1:4 (excellent RR)
Aggressive traders can add on confirmation of rejection (bearish engulfing, shooting star, etc.) inside the 3,180 area.#ETHUSD #Ethereum #SellSignal #BearishContinuation #CryptoSignal #SmartMoneyConcepts #FVG This is purely my personal technical analysis and trade idea.
NOT financial advice. Trading involves high risk. Always do your own research and use proper risk management. Trade at your own risk.

ETHUSD H4 | Bullish Bounce Off Pullback SupportMomentum: Bearish
Price is currently falling toward the buy entry, which aligns with a pullback support level sitting slightly above the 38.2% Fibonacci retracement. The market is also trading above the Ichimoku cloud, suggesting this zone could provide potential support for a bounce.
Buy Entry: 3,079.09
Pullback support
Slightly above the 38.2% Fibonacci retracement
Stop Loss: 2,876.32
Pullback support
Slightly below the 61.8% Fibonacci retracement
Take Profit: 3,407.09
Pullback resistance
Slightly above the 161.8% Fibonacci extension
High Risk Investment Warning
Stratos Markets Limited (tradu.com ), Stratos Europe Ltd (tradu.com ):
CFDs are complex instruments and come with a high risk of losing money rapidly due to leverage. 70% of retail investor accounts lose money when trading CFDs with this provider. You should consider whether you understand how CFDs work and whether you can afford to take the high risk of losing your money.
Stratos Global LLC (tradu.com ): Losses can exceed deposits.
Please be advised that the information presented on TradingView is provided to Tradu (‘Company’, ‘we’) by a third-party provider (‘TFA Global Pte Ltd’). Please be reminded that you are solely responsible for the trading decisions on your account. Any information and/or content is intended entirely for research, educational and informational purposes only and does not constitute investment or consultation advice or investment strategy. The information is not tailored to the investment needs of any specific person and therefore does not involve a consideration of any of the investment objectives, financial situation or needs of any viewer that may receive it. Past performance is not a reliable indicator of future results. Actual results may differ materially from those anticipated in forward-looking or past performance statements. We assume no liability as to the accuracy or completeness of any of the information and/or content provided herein and the Company cannot be held responsible for any omission, mistake nor for any loss or damage including without limitation to any loss of profit which may arise from reliance on any information supplied by TFA Global Pte Ltd.

ETHUSD – 2H Corrective Repricing Channel | Range Redistribution BITSTAMP:ETHUSD
ETH is currently retracing after a deep sell-off, forming a rising channel. Bulls remain corrective, not impulsive. A rejection from 3466 or 3834 may trigger continuation of the dominant macro downtrend toward liquidity resting below 2644.
Key Scenarios
📈 Bullish Extension (Short-Term Rally)
Hold 3074 and break above 3466 leads to:
🎯 Target (A) → 3466
🎯 Target (C) → 3834 liquidity sweep zone
📉 Primary Swing Bias → Bearish Continuation
If price rejects 3466–3834 and breaks channel:
🎯 Downside Target → 2644 (full breakdown FVG retest zone)
Current Levels to Watch
Resistance 🔴 3466 → 3834
Support 🟢 3074
Break & close below = bearish strength continuation
⚠️ Disclaimer: Educational analysis only — not financial advice
ETHUSD 30m – Bullish Trend Continuation SetupBITSTAMP:ETHUSD
ETH delivered a sharp bullish leg after sweeping the support zone near 2718. Price is now holding above resistance-turned-support (2850.7). As long as the trend channel remains intact, structure favors continuation toward the final target.
Key Scenarios
✅ Bullish Case 🚀
Ideal entry: pullback toward trend support
Confirmation: rejection + bullish candle
🎯 Target 1: 3030
🎯 Final Target: 3095–3100 region
❌ Bearish Case 📉
Failure below 2850 invalidates bullish scenario
Possible drop towards 2780 → 2718 support
Current Levels to Watch
Resistance: 3030 / 3095
Support: 2850 / 2780 / 2718
⚠️ Disclaimer: This analysis is for educational purposes only. Not financial advice.

Bullish Divergence on ETH Signals Potential Upside Toward $3,600On the 4-HOURS chart, Ethereum CRYPTO:ETHUSD is showing a clear bullish divergence between price and momentum indicators, reinforcing the upside scenario we discussed previously. This divergence signals fading selling pressure and a potential bullish reversal.
The first resistance to watch is $3,150, followed by $3,600. If ETH fails to break above these levels, price may revisit the $2,750 zone for another liquidity test.
على فريم الأربع ساعات، يُظهر الإيثيريوم ( CRYPTO:ETHUSD ) بوادر انفراج إيجابي واضح بين حركة السعر ومؤشرات الزخم، مما يعزز السيناريو الصعودي الذي ناقشناه سابقًا. هذا الانفراج يشير إلى تراجع قوة البائعين وزيادة احتمال حدوث انعكاس صاعد.
أولى المقاومات التي يجب مراقبتها هي 3150$، تليها 3600$. وفي حال فشل السعر في اختراق هذه المستويات، قد يعاود الإيثيريوم زيارة منطقة 2750$ لاختبار السيولة من جديد.

ETHUSD downtrend continuation below 3,185The ETHUSD pair continues to display a bearish outlook, in line with the prevailing downward trend. Recent price action suggests a corrective pullback, potentially setting up for another move lower if resistance holds.
Key Level: 3,185
This zone, previously a consolidation area, now acts as a significant resistance level.
A failed test and rejection at 3,185 would likely resume the bearish momentum.
Downside targets include:
2,730 – Initial support
2,640 – Intermediate support
2,513 – Longer-term support level
Bullish Scenario (breakout above 3,185):
A confirmed breakout and daily close above 3,185 would invalidate the bearish setup.
In that case, potential upside resistance levels are:
2,640 – First resistance
2,513 – Further upside target
Conclusion
ETHUSD remains under bearish pressure, with the 3,185 level acting as a key inflection point. As long as price remains below this level, the bias favours further downside. Traders should watch for price confirmation around that level to assess the next move.
This communication is for informational purposes only and should not be viewed as any form of recommendation as to a particular course of action or as investment advice. It is not intended as an offer or solicitation for the purchase or sale of any financial instrument or as an official confirmation of any transaction. Opinions, estimates and assumptions expressed herein are made as of the date of this communication and are subject to change without notice. This communication has been prepared based upon information, including market prices, data and other information, believed to be reliable; however, Trade Nation does not warrant its completeness or accuracy. All market prices and market data contained in or attached to this communication are indicative and subject to change without notice.

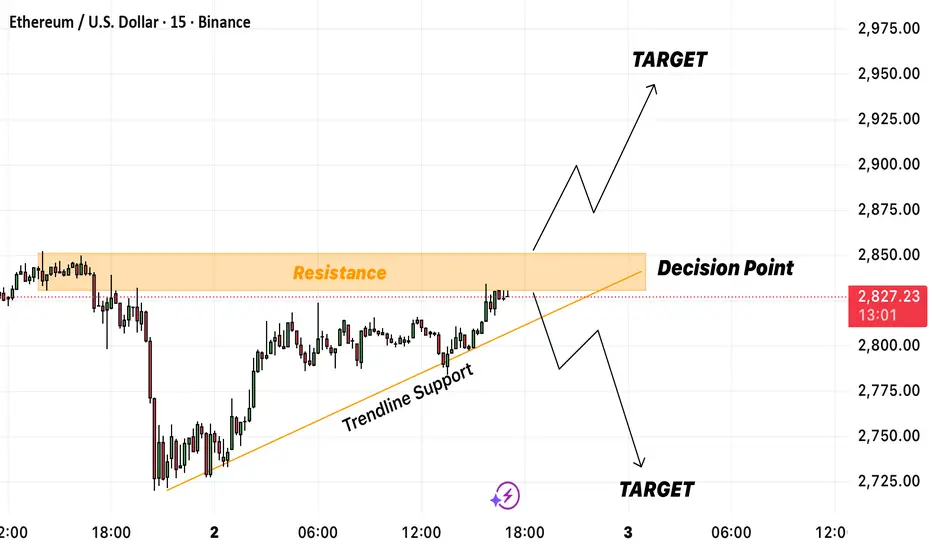
ETH/USD at Key Decision Zone – Breakout or Rejection?Ethereum is approaching a major resistance zone around $2,830 – $2,850, which previously acted as strong supply. Price has been climbing steadily along a rising trendline support, indicating sustained bullish momentum.
This creates a decision point where ETH will likely choose its next directional move.
🔼 Bullish Scenario
If price breaks and closes above the resistance zone, it confirms bullish continuation.
In this case, buyers may push price toward the next liquidity zone around:
Target: $2,900 – $2,950
A successful breakout with retest would strengthen the bullish case.
🔽 Bearish Scenario
If price rejects the resistance and breaks back below the trendline support, selling pressure may return.
Downside targets would be:
Target: $2,750
Extended Target: $2,720
This would signal a shift in short-term structure from bullish to bearish.
📌 Key Levels to Watch
Resistance (Decision Zone): $2,830 – $2,850
Trendline Support: Rising from the $2,750 region
Bullish Target: $2,900 – $2,950
Bearish Target: $2,720 – $2,750
📈 Summary
ETH is sitting at a critical decision point. A breakout above resistance opens the door for bullish continuation, while a rejection could trigger a deeper pullback. Traders should wait for confirmation—either a clean breakout or a trendline breakdown.
ETHUSD H1 | Bearish Reversal Off 38.2% FIibonacci ResistanceMomentum: Bearish
Price is rising towards the sell entry, which aligns with the 38.2% Fibonacci retracement and remains below the Ichimoku cloud.
Sell Entry: 2,867.98
Overlap resistance
38.2% Fibonacci retracement
Stop Loss: 2,972.02
Pullback resistance
Slightly above the 61.8% Fibonacci retracement
Take Profit: 2,695.74
Pullback support
High Risk Investment Warning
Stratos Markets Limited (tradu.com ), Stratos Europe Ltd (tradu.com ):
CFDs are complex instruments and come with a high risk of losing money rapidly due to leverage. 70% of retail investor accounts lose money when trading CFDs with this provider. You should consider whether you understand how CFDs work and whether you can afford to take the high risk of losing your money.
Stratos Global LLC (tradu.com ): Losses can exceed deposits.
Please be advised that the information presented on TradingView is provided to Tradu (‘Company’, ‘we’) by a third-party provider (‘TFA Global Pte Ltd’). Please be reminded that you are solely responsible for the trading decisions on your account. Any information and/or content is intended entirely for research, educational and informational purposes only and does not constitute investment or consultation advice or investment strategy. The information is not tailored to the investment needs of any specific person and therefore does not involve a consideration of any of the investment objectives, financial situation or needs of any viewer that may receive it. Past performance is not a reliable indicator of future results. Actual results may differ materially from those anticipated in forward-looking or past performance statements. We assume no liability as to the accuracy or completeness of any of the information and/or content provided herein and the Company cannot be held responsible for any omission, mistake nor for any loss or damage including without limitation to any loss of profit which may arise from reliance on any information supplied by TFA Global Pte Ltd.

eth live update looking ugly eth on smaller time waiting for conformation and the creation of a bearish channel only and i mean only we get conformation in the next few hours . so if we dont break above this channel we will see 2500.00... invalidated if we see a break above resistance
