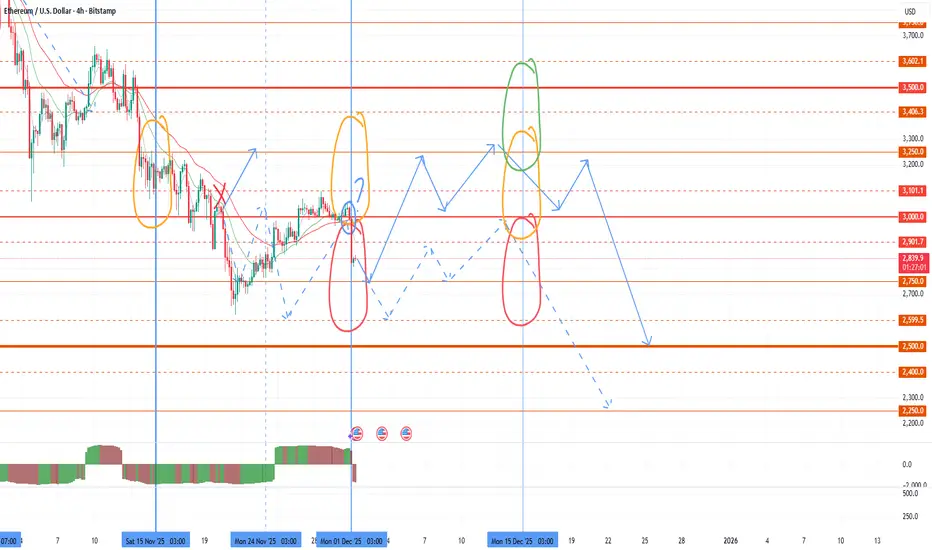
eth live update looking ugly eth on smaller time waiting for conformation and the creation of a bearish channel only and i mean only we get conformation in the next few hours . so if we dont break above this channel we will see 2500.00... invalidated if we see a break above resistance
Trade ideas

Chart any asset against another - Tradingview Trick!In this video, I show you how to chart any asset against another in Tradingview.
In this example I chart CRYPTOCAP:ETH vs NYSE:CRCL and show the relationship between the two assets. It is much easier to view the relationship between two entirely different assets when you chart them correctly!
This will give you a view you didn't see otherwise.

#ETHUSD - Short Term Levels (Dec 2025)Date: 01-12-2025
#ETHUSD Current Price: $2,813.00
Pivot Point: $2,917.72
Support: $2,777.37
Resistance: $3,059.33
Upside Targets:
--------------------------------
| Target | Price |
---------------------------------
| 🎯 Target 1 | $3,241.31
| 🎯 Target 2 | $3,423.28
| 🎯 Target 3 | $3,612.87
| 🎯 Target 4 | $3,802.45
Downside Targets:
| 🎯 Target 1 | $2,594.77
| 🎯 Target 2 | $2,412.16
| 🎯 Target 3 | $2,222.58
| 🎯 Target 4 | $2,032.99
#Crypto #Bitcoin #BTC #CryptoTA #TradingView #PivotPoints #SupportResistance

An Attempt at Seasonal Market Growth and BTC RollbackTo date, we have reached another bifurcation point in the market and it's time for another review. So far, there is a share of positivity in the market situation. As I wrote earlier, there is strong medium-term support for BTC in the 85-90k zone, from which a rollback is likely. Unfortunately, last month we broke through the 85k level, which is a signal for a possible test of 75k in the spring. However, the probability of a rollback from 85k to 90-100 still prevails. The broadcast opened the month ambiguously. According to Asian time, the opening is in the negative zone below 3000, higher in the neutral zone at GMT. I think the market will move this month based on the bullish BTC signal, and the coins will continue to move in different directions.
The seasonal growth period in the first half of December is also a positive signal. Once again, I would like to draw attention to the background trigger used by the United States to manipulate the market - brent oil. At the last bifurcation point, prices still collapsed, despite the positive data on US stocks, to which ETH immediately reacted with a consolidation below 3k, as I warned in the review. The current monthly candle opened above the interim support of $ 62.5, against which there is a signal for growth in the first half of the month at least.
As a result, we have signals for new growth waves for individual altcoins that have reached supports and have high growth goals, as part of seasonal growth, attempts to rollback BTC with oil and rollback according to the annual schedule. However, most of the alcoins, especially those with high capitalization or upcoming aggressive issuance, will not have time to show significant growth in this short period and will continue the medium-term bearish trend. Be careful with new purchases in the next couple of weeks. Today - tomorrow is the time when coins draw a shadow down the new monthly candle, but starting tomorrow evening or Wednesday, the probability of a reversal for individual coins will increase. If positive oil data is released in the middle of the week, then the growth of the crypt is likely to accelerate steadily by the end of the week, with a continuation in the next weekly candle. Next, the opening zone of the second half of the month will be of great importance.
For altcoins, in the event of a reversal attempt, the minimum target will be to overshoot the last monthly candle. For work today, I am considering the TURTLE NTRN ENSO VIC MITO BMT HOOK first of all. These tools were recently listed on binance, which reduces the threat of delisting hanging over projects from 20-22. The issue of these instruments is also smooth, which reduces the likelihood of further large drawdowns. Given today's circulating supply, these instruments are already in an oversold position and the likelihood of a reversal to growth at the slightest provocation from the market prevails. They also previously provided strong technical signals for growth up to 300%+, which will be worked out in the medium term.
Secondly, I am considering CHESS UTK COS DATA QUICK FIO for scalping, which can give new growth waves of up to 40-50% at least, but I recommend using a smaller position size for them. CHESS has been assigned the monitoring tag, but there are strong technical signals for a 0.1 retest, which is why a large exit pump is likely. After that, I will no longer consider using the token.
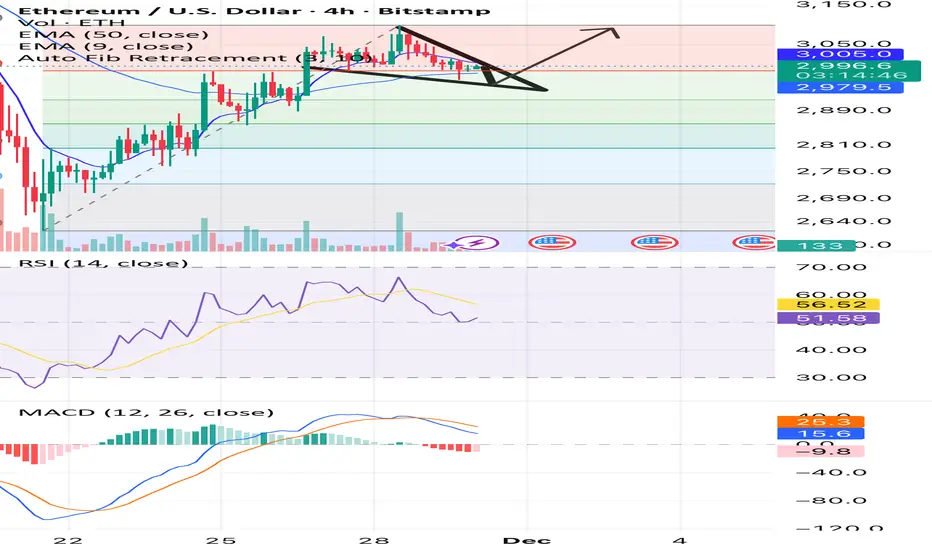
ETHUSD H1 | Bullish Bounce Off SupportMomentum: Bullish
Price is currently above the ichimoku cloud, and is still above the ascending trendline.
Buy entry: 2,982
- Overlap support
- 50% Fib retracement
Stop Loss: 2,896.63
- Swing low support
Take Profit: 3,076.67
- Swing high resistance
High Risk Investment Warning
Stratos Markets Limited (tradu.com/uk ), Stratos Europe Ltd (tradu.com/eu ):
CFDs are complex instruments and come with a high risk of losing money rapidly due to leverage. 70% of retail investor accounts lose money when trading CFDs with this provider. You should consider whether you understand how CFDs work and whether you can afford to take the high risk of losing your money.
Stratos Global LLC (tradu.com/en ): Losses can exceed deposits.
Please be advised that the information presented on TradingView is provided to Tradu (‘Company’, ‘we’) by a third-party provider (‘TFA Global Pte Ltd’). Please be reminded that you are solely responsible for the trading decisions on your account. Any information and/or content is intended entirely for research, educational and informational purposes only and does not constitute investment or consultation advice or investment strategy. The information is not tailored to the investment needs of any specific person and therefore does not involve a consideration of any of the investment objectives, financial situation or needs of any viewer that may receive it. Past performance is not a reliable indicator of future results. Actual results may differ materially from those anticipated in forward-looking or past performance statements. We assume no liability as to the accuracy or completeness of any of the information and/or content provided herein and the Company cannot be held responsible for any omission, mistake nor for any loss or damage including without limitation to any loss of profit which may arise from reliance on any information supplied by TFA Global Pte Ltd.

ETHUSD Daily Timeframe Based on my analysis of the Ethereum/U.S. Dollar (ETH/USD) daily chart, it appears we are at a critical juncture. The price is currently trading around the $2,841 level after a period of consolidation.
My projection suggests a potential bearish move in the short to medium term. I'm anticipating a downward correction towards a key support zone, which I've identified between approximately $1,380 and $2,220. This area has previously acted as a significant price floor, and I expect it to attract buying interest once again.
Looking at the MACD indicator, the bearish momentum seems to be building, which supports the thesis of a near-term price decline.
However, should the price find solid footing within that support zone, I foresee a strong bullish reversal. My long-term target is a significant rally, potentially pushing Ethereum back towards the $5,000 resistance level.
In summary, the strategy would be to watch for a dip into the key support area as a potential buying opportunity, with a long-term bullish outlook toward the $5,000. My stop just below the demand zone.

ETHUSD - Daily Timeframe Based on my analysis of the Ethereum/U.S. Dollar (ETH/USD) daily chart, it appears we are at a critical juncture. The price is currently trading around the $2,841 level after a period of consolidation.
My projection suggests a potential bearish move in the short to medium term. I'm anticipating a downward correction towards a key support zone, which I've identified between approximately $1,380 and $2,220. This area has previously acted as a significant price floor, and I expect it to attract buying interest once again.
Looking at the MACD indicator, the bearish momentum seems to be building, which supports the thesis of a near-term price decline.
However, should the price find solid footing within that support zone, I foresee a strong bullish reversal. My long-term target is a significant rally, potentially pushing Ethereum back towards the $5,000 resistance level.
In summary, the strategy would be to watch for a dip into the key support area as a potential buying opportunity, with a long-term bullish outlook toward the $5,000 mark. My stop just below the Highlighted demand zone.

Ethereum: Reversal or Deeper Lows?BINANCE:ETHUSD has sharply retreated to the $2,800 zone as of December 1. If Ethereum selling pressure continues, price may seek stronger support in the $2,000–$2,400 range. A rebound from this zone followed by a break above $3,000 would open the path toward the $3,800 target. However, failure to hold the $2,200 region could trigger a deeper decline toward $1,500–$1,750, signaling broader bearish momentum.


Ether projection 2025
Ether may hit all time high this week($5k). Price made clear market shift and pulled back to a demand zone where it met bullish order block and fair value gap where it will start buying. Also, dollar index has shown weakness which will give power to all dollar paired asset.
#Eth
#Btc
#Altcoin
#Cryptonews
#cryptotrading
#Cryptocurrency
#Tradertinomars

ETHUSD - MA Support ETHUSD is showing support along the MA line in white on this indicator, I believe it is showing the Monthly chart.
I dont think it will go below this line as it has been seen to support price consistently, instead i think a new ATH will be seen.
Long term chart and a new indicator.

ETH - Long - 3880ETHUSD is expected to bounce back from the levels of 2970.
The Crypto has strong support on that level of 2970.
Further support at 2680.

Previous Target Achieved. What now?
Crash & I have a New Setup🤑
The previous target was hit just as expected. It almost did at least. Profits are booked. Now let's look at a new setup. This time, the target would still be the same. Good luck!
#ETH #ETHEREUM #CRYPTOCURRENCY #TRADINGVIEW #TechnicalAnalysis #ToTheMoon
🚀 BINANCE:ETHUSDT to Reach $5K
> ATH Breakout: A sustained move above the $4,891 previous All-Time High is the final hurdle. Clearing this resistance puts ETH into price discovery, making $5,000 the immediate psychological and measured target.
> Deflationary Supply: Net negative ETH issuance (due to fee burning/EIP-1559 and staking rewards) continuously shrinks the circulating supply. This persistent supply shock is a major fundamental driver for upward price pressure.
> Long-Term Pattern: Confirmation of a breakout from a major multi-year structure (like an ascending channel or bull pennant) on high timeframes projects significant measured moves, often validating $5,000 as a logical next step.
And that's it!
#ETH #ETHEREUM #CRYPTOCURRENCY #TRADINGVIEW #TechnicalAnalysis #ToTheMoon

bullish patternetherium in a bullish reversal pattern a down till 2960 with a bullish divergence . entry between 2955/2965 stop loss 2930 tp 3090
ETH Daily Outlook | November 29, 2025Still looking really clean on the 1-hour. Higher lows are holding firm, no bearish break of structure at all. We’re just in a shallow corrective pullback right now, price sitting right on the 5 EMA while the 10 and 50 are stacked perfectly below and still pointing up.Volume’s basically gone to sleep on the dip and funding is quiet, classic sign the move isn’t over. As long as we stay above the last higher low and that 50 EMA zone, this is nothing more than a healthy pause in the markup.A quick bounce off the 5/10 area and we flip straight back into impulse mode for the next leg up.My bias stays aggressively bullish as long as the EMA stack and structure stay intact. Any touch of the 50 EMA is a buy for me.

Arbitrage Opportunities Across World MarketsTypes of Arbitrage Opportunities in World Markets
Spatial Arbitrage (Geographical Arbitrage)
Spatial arbitrage occurs when the same asset is priced differently in two different locations. For instance, a stock listed on multiple exchanges, such as a dual-listed company on the NYSE and LSE, may have a price discrepancy due to currency exchange rates, local demand, or time zone differences.
Example: If Company X trades at $50 in New York and £40 in London, and the exchange rate is $1.25/£1, a trader can buy in London and sell in New York, locking in risk-free profit after accounting for transaction costs.
Triangular Currency Arbitrage
This form of arbitrage involves discrepancies in the foreign exchange (FX) market. Traders exploit differences in the quoted exchange rates of three currencies. The process is simple: convert Currency A to B, B to C, and then C back to A. If the resulting amount of Currency A exceeds the initial investment, a profit is realized.
Global FX markets, due to their size and high-frequency trading, often have momentary inefficiencies that allow for this type of arbitrage. However, modern algorithmic systems have significantly reduced the frequency of such opportunities.
Covered Interest Rate Arbitrage
In international finance, covered interest rate arbitrage occurs when interest rate differentials between countries do not align with forward currency rates. For example, if U.S. interest rates are lower than in Germany, a trader can borrow in the U.S., convert to euros, invest in Germany, and simultaneously hedge currency risk using a forward contract. The profit arises from exploiting the mismatch between interest rate differentials and forward exchange rates.
Statistical Arbitrage
Statistical arbitrage leverages mathematical models and historical data to identify pricing inefficiencies across markets. Rather than relying on direct price differences, traders look at correlated assets, market pairs, or index movements to generate returns. While not risk-free in the pure sense, statistical arbitrage is widely used in global equity and derivative markets.
Merger and Acquisition Arbitrage (Risk Arbitrage)
When global companies announce mergers or acquisitions, the stock price of the target often lags behind the expected acquisition price due to uncertainty. Traders can take positions anticipating the deal's completion. For example, if Company A in Japan announces a takeover of a U.S.-based Company B, the price of B may be lower on U.S. exchanges compared to its implied value post-merger. Cross-border arbitrage allows traders to exploit these gaps.
Global Market Dynamics Driving Arbitrage
Several factors contribute to arbitrage opportunities across world markets:
Time Zone Differences
Markets around the world operate at different hours, creating windows where one market may react to news before another. For example, Asian markets close before European markets open, which can lead to temporary pricing mismatches in assets that are traded globally.
Currency Fluctuations
Exchange rate volatility is a major source of arbitrage in international trading. Currency mismatches can cause the same asset to have different values when measured in local currencies. Traders can exploit this by engaging in currency-hedged arbitrage strategies.
Regulatory Differences
Different countries have unique rules on taxation, capital controls, and trading restrictions. Sometimes, these regulatory differences can create temporary price gaps for identical assets across borders.
Market Inefficiencies
Even in highly liquid markets, inefficiencies exist due to information asymmetry, technological delays, or mispricing. For example, an earnings report released in the U.S. may take minutes to reflect in Asian markets. Traders with rapid information access can profit during these periods.
Transaction Costs and Liquidity Constraints
While arbitrage seeks risk-free profits, transaction costs, taxes, and liquidity can limit profitability. Global arbitrage strategies often rely on high volumes and low latency systems to ensure that profits exceed costs.
Examples of Arbitrage Across Global Markets
Equity Arbitrage
Large multinational companies listed on multiple exchanges are prime candidates for arbitrage. For instance, Royal Dutch Shell, historically listed on both the Amsterdam and London stock exchanges, had frequent arbitrage opportunities when share prices diverged due to local market demand.
Commodity Arbitrage
Global commodities such as oil, gold, and natural gas often trade at different prices in different countries due to transportation costs, supply-demand imbalances, and currency differences. Traders can buy in one market and sell in another, factoring in shipping and storage costs.
Cryptocurrency Arbitrage
The cryptocurrency market, still relatively fragmented globally, offers arbitrage opportunities where coins trade at different prices across exchanges. For example, Bitcoin might trade at a premium on a South Korean exchange compared to a U.S. platform due to local demand and capital restrictions.
Risks in Global Arbitrage
Despite being theoretically risk-free, global arbitrage is not without challenges:
Execution Risk – Prices may converge before the trade is executed, erasing profits.
Currency Risk – Unhedged positions in foreign currencies can lead to losses if exchange rates move unfavorably.
Regulatory Risk – Changes in cross-border trading rules or capital controls can disrupt strategies.
Liquidity Risk – Certain assets may be illiquid in one market, preventing the arbitrage trade from being completed.
Technological Risk – Latency in trading platforms or connectivity issues can prevent timely execution of trades.
Technology and Arbitrage
In modern finance, technology has both created and eliminated arbitrage opportunities:
High-Frequency Trading (HFT): Firms use algorithms to detect and exploit price differences across global markets in milliseconds. This has made classical arbitrage rare but opened new avenues in microsecond-level inefficiencies.
Blockchain and Crypto Arbitrage: Decentralized exchanges and crypto platforms offer new arbitrage possibilities globally, though with added cybersecurity and regulatory risks.
Data Analytics and AI: Advanced statistical models help traders identify subtle arbitrage opportunities across correlated global assets, enhancing the scope of international trading strategies.
Conclusion
Arbitrage opportunities across world markets represent the intersection of finance, economics, and technology. They exist due to inefficiencies in pricing, regulatory environments, time zones, and currency fluctuations. Traders exploit these differences to earn theoretically risk-free profits, although real-world factors such as transaction costs, liquidity, and execution delays introduce challenges.
Global arbitrage is evolving with technology, creating sophisticated strategies that rely on speed, analytics, and international market understanding. While pure arbitrage profits have diminished in mature markets due to algorithmic trading, emerging markets and newer asset classes like cryptocurrencies continue to offer lucrative opportunities.
In essence, arbitrage reflects the ongoing dialogue between market efficiency and human ingenuity—a testament to the complexity and interconnectedness of the global financial system.

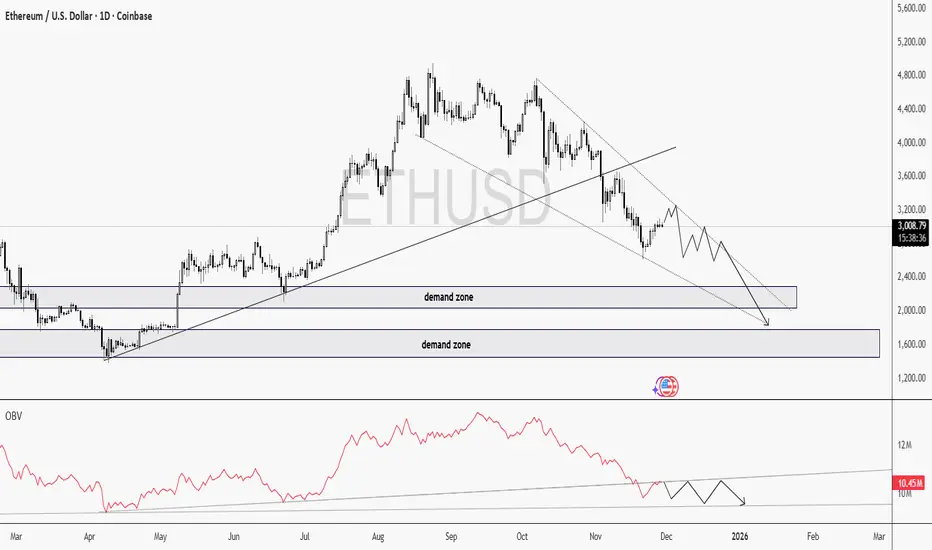
ETH Chart doesn't look prettyI see Ethereum’s chart not looking pretty for long nor hold positions at these prices.
Price Action
ETH continues to make lower highs and lower lows inside a descending wedge.
Price is moving toward two major demand zones, and the momentum is really weak. Just minor price hiccups.
I'm expecting some choppy or even consolidation movements before a possible test of the lower demand blocks.
OBV is such an underrated indicator!
Look at OBV, this is where the things gets interesting..
OBV is breaking its trendline downward, even while price hasn’t fully broken structure yet.
This is a classic sign of volume distribution. Smart money is exiting positions quietly.
When OBV breaks direction before price, it often predicts the next major move.
At the moment, ETHUSD is looking heavily bearish. Given the fact that BTC is also giving early signs of a bearish trend, I don't think buying ETH is a good idea here. I'll wait for a deeper correction.
Good Luck!
ETHUSD H4 | Bearish Reaction Off Key ResistanceMomentum: Bearish
Price is currently within the bearish ichimoku cloud.
Sell entry: 3,200.36
- Overlap resistance
- 50% Fib retracement
- 100% Fib projection
Stop Loss: 3,396.32
- Pullback resistance
Take Profit: 2,974.66
- Overlap support
High Risk Investment Warning
Stratos Markets Limited (tradu.com/uk ), Stratos Europe Ltd (tradu.com/eu ):
CFDs are complex instruments and come with a high risk of losing money rapidly due to leverage. 70% of retail investor accounts lose money when trading CFDs with this provider. You should consider whether you understand how CFDs work and whether you can afford to take the high risk of losing your money.
Stratos Global LLC (tradu.com/en ): Losses can exceed deposits.
Please be advised that the information presented on TradingView is provided to Tradu (‘Company’, ‘we’) by a third-party provider (‘TFA Global Pte Ltd’). Please be reminded that you are solely responsible for the trading decisions on your account. Any information and/or content is intended entirely for research, educational and informational purposes only and does not constitute investment or consultation advice or investment strategy. The information is not tailored to the investment needs of any specific person and therefore does not involve a consideration of any of the investment objectives, financial situation or needs of any viewer that may receive it. Past performance is not a reliable indicator of future results. Actual results may differ materially from those anticipated in forward-looking or past performance statements. We assume no liability as to the accuracy or completeness of any of the information and/or content provided herein and the Company cannot be held responsible for any omission, mistake nor for any loss or damage including without limitation to any loss of profit which may arise from reliance on any information supplied by TFA Global Pte Ltd.

ETHUSD - Monthly RSI ViewMy view on the Monthly RSI for ETH, expecting another extension upward on the RSI towards the green circle. This creates a huge W pattern and allows another bull run.
Vertical lines show the middle of the previous and current bull run.
Good time to enter into ETHUSD on this Monthly timeframe.

ETHERIUM is about to break the resistenceetherium as a major crypto ; try to stay behind bitcoin volatility and assume that it's was just a phase of consolidation aiming for new solid price level , follow the trend

Ethereum OUTCOME!ETH gained strength this week. Waiting to see if it will Break the TrendLine and Cross the Moving Average.

ETHUSD H4 | Bearish Reversal Off Pullback ResistanceMomentum: Bearish
Price is rising toward the sell entry, which sits slightly above the 50% Fibonacci retracement and remains below the Ichimoku Cloud — maintaining a bearish bias.
Sell Entry: 3,208.29
Pullback resistance
Slightly above the 50% Fibonacci retracement
Stop Loss: 3,402.89
Pullback resistance
Aligning with the 50% Fibonacci retracement
Take Profit: 2,786.67
Pullback support
High Risk Investment Warning
Stratos Markets Limited (tradu.com), Stratos Europe Ltd (tradu.com ):
CFDs are complex instruments and come with a high risk of losing money rapidly due to leverage. 70% of retail investor accounts lose money when trading CFDs with this provider. You should consider whether you understand how CFDs work and whether you can afford to take the high risk of losing your money.
Stratos Global LLC (tradu.com): Losses can exceed deposits.
Please be advised that the information presented on TradingView is provided to Tradu (‘Company’, ‘we’) by a third-party provider (‘TFA Global Pte Ltd’). Please be reminded that you are solely responsible for the trading decisions on your account. Any information and/or content is intended entirely for research, educational and informational purposes only and does not constitute investment or consultation advice or investment strategy. The information is not tailored to the investment needs of any specific person and therefore does not involve a consideration of any of the investment objectives, financial situation or needs of any viewer that may receive it. Past performance is not a reliable indicator of future results. Actual results may differ materially from those anticipated in forward-looking or past performance statements. We assume no liability as to the accuracy or completeness of any of the information and/or content provided herein and the Company cannot be held responsible for any omission, mistake nor for any loss or damage including without limitation to any loss of profit which may arise from reliance on any information supplied by TFA Global Pte Ltd.

Bullish bounce?Ethereum (ETH/USD) is falling towards the pivot and could bounce to the 1st resistance, which aligns with the 61.8% Fibonacci retracement.
Pivot: 2,994.49
1st Support: 2,878.88
1st Resistance: 3,233.25
Disclaimer:
The opinions given above constitute general market commentary and do not constitute the opinion or advice of IC Markets or any form of personal or investment advice.
Any opinions, news, research, analyses, prices, other information, or links to third-party sites contained on this website are provided on an "as-is" basis, are intended to be informative only, and are not advice, a recommendation, research, a record of our trading prices, an offer of, or solicitation for, a transaction in any financial instrument and thus should not be treated as such. The information provided does not involve any specific investment objectives, financial situation, or needs of any specific person who may receive it. Please be aware that past performance is not a reliable indicator of future performance and/or results. Past performance or forward-looking scenarios based upon the reasonable beliefs of the third-party provider are not a guarantee of future performance. Actual results may differ materially from those anticipated in forward-looking or past performance statements. IC Markets makes no representation or warranty and assumes no liability as to the accuracy or completeness of the information provided, nor any loss arising from any investment based on a recommendation, forecast, or any information supplied by any third party.
