ETHEREUM: Two Setups On The Horizon.Switching it up to Ethereum today. There are two trade setups potentially setting up over the next two weeks. One is a short and one is a long and both depend on how price structure unfolds in light of the major catalysts on the horizon. The Clarity Act, NFP, unexpected tweets, geopolitical events,
Related pairs
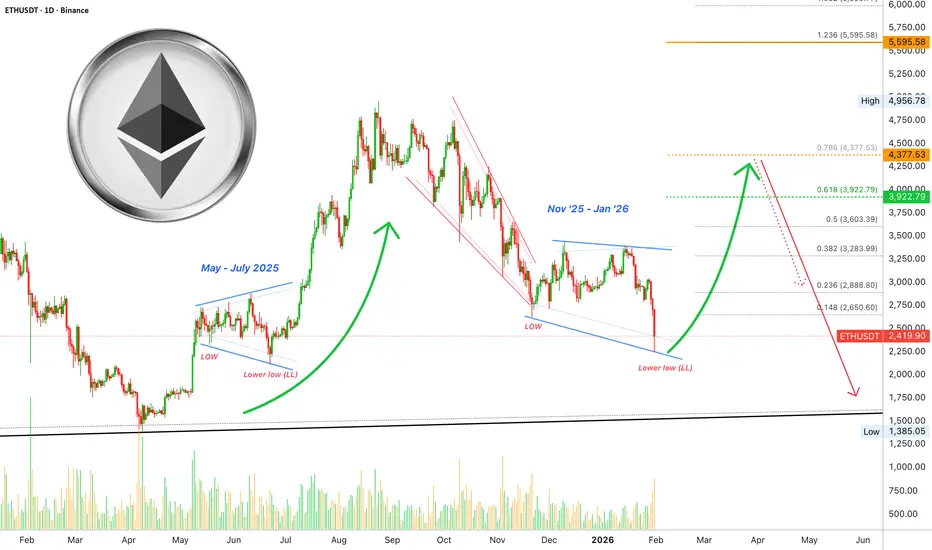
ETHEREUM(ETHUSDT): One Final Drop Then $8000 Long Term ViewDear traders,
I hope you’re doing well. ETHUSDT is on the brink of a strong bullish reversal and a shift in momentum. We now have a strong possibility of an impulse pattern with price moving in a powerful upward bullish trend. However, we need strong confirmation before committing to this analysis.

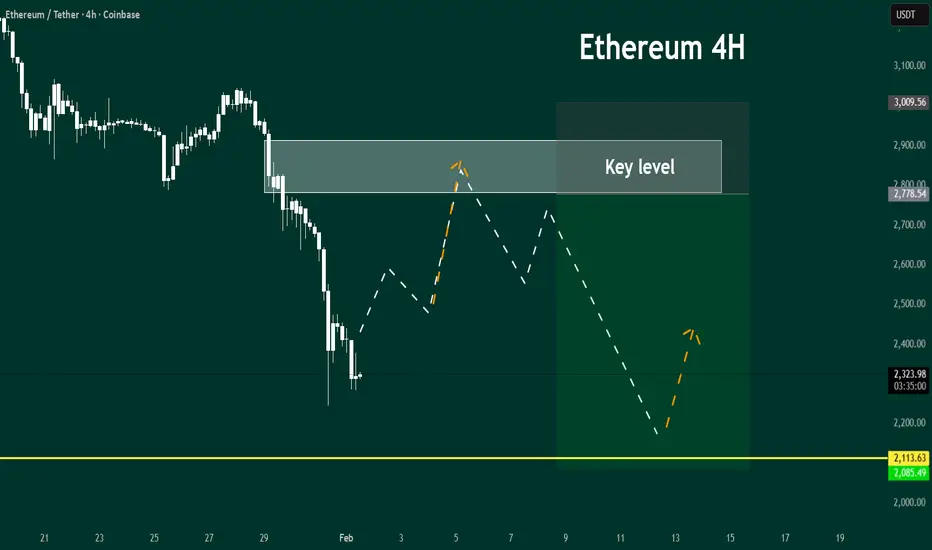
Ethereum (ETH): Either We Bounce To $3,400 or We Dumping HardA steady downside movement has been happening after the last touch to the $3,400 resistance area, where currently the price is sitting slightly above the smaller support area, where buyers are still holding the dominance over this zone.
The plan is very simple; as we have seen some struggle alread
ETHUSDT Trendline Rejection Confirms Bearish Continuation PhaseETHUSDT (1D) remains firmly bearish following the confirmed loss of the $2,770–$2,640 supply zone, which has now flipped into strong resistance. The macro structure continues to print lower highs, with major rejections recorded at $4,946, $4,768, and most recently $3,385, all aligning with the desce

Vitalik Just Killed the "L2 Narrative."The market is missing the biggest pivot in Ethereum history.
For the last two years, the "Smart Money" trade was to Long L2s and Short L1. That trade ended this week.
On February 3, Ethereum co-founder Vitalik Buterin published a seminal critique declaring that the "Rollup-Centric Roadmap" (L2s ac

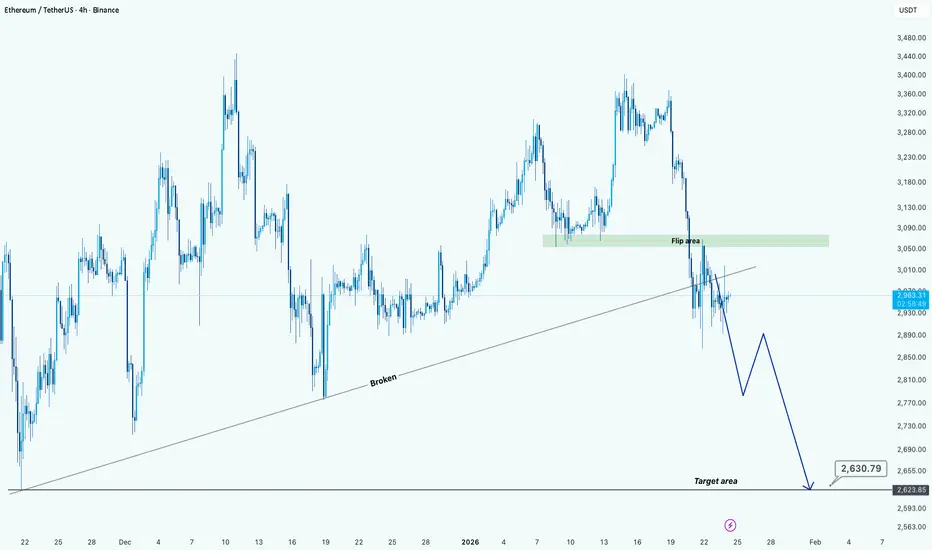
ETH Trendline Breakdown Signals Deeper Pullback RiskHi!
ETH has decisively broken its rising trendline, confirming a shift in short-term market structure. After the breakdown, price retraced into the former support zone (now acting as a flip area), which served as a corrective move rather than a bullish reclaim.
With the flip area holding as resist
Ethereum: Good news & bad newsGood news first: A strong bullish wave is still right around the block, only a few steps (days) away. This chart supports a strong bullish move, an inverted correction, before a major crash; but, all the numbers must be updated because of today's event.
The retrace is no longer a retrace. Based on
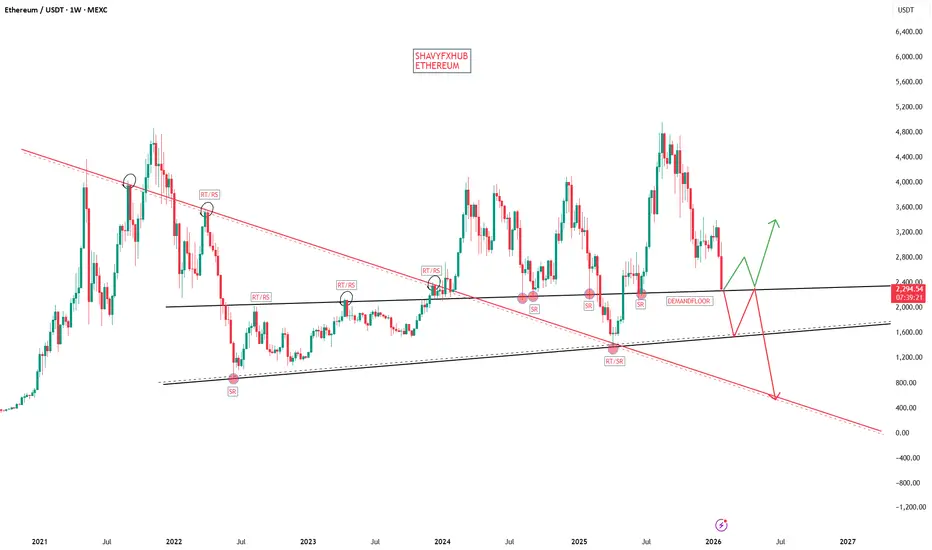
ETHEREUM DIRECTION BASED ON THE STRUCTURE ONLYETHEREUM supply roof will be 2844.83 based on the structure
key demand floor will be 2119.42-2163.00 zone
key demand floor will be 1770.730-1451.11 zone
REST IN PEACE ZONE AND MARKET RESET WILL BE 782.80-811,85 BASED ON MARKET STRUCTURE STRATEGY.
MARKET STRUCTURENEVER LIES.
WHAT IS ETHEREUM??
Ethere
ETH at Big Support: Hold or Break?ETH is now retesting the $2000 support zone, a level that has acted as a major decision point multiple times in the past.
Each time ETH reached this area, the market paused, reacted, and chose its next direction carefully.
From a structure perspective, this is not a random level. It’s a long-term
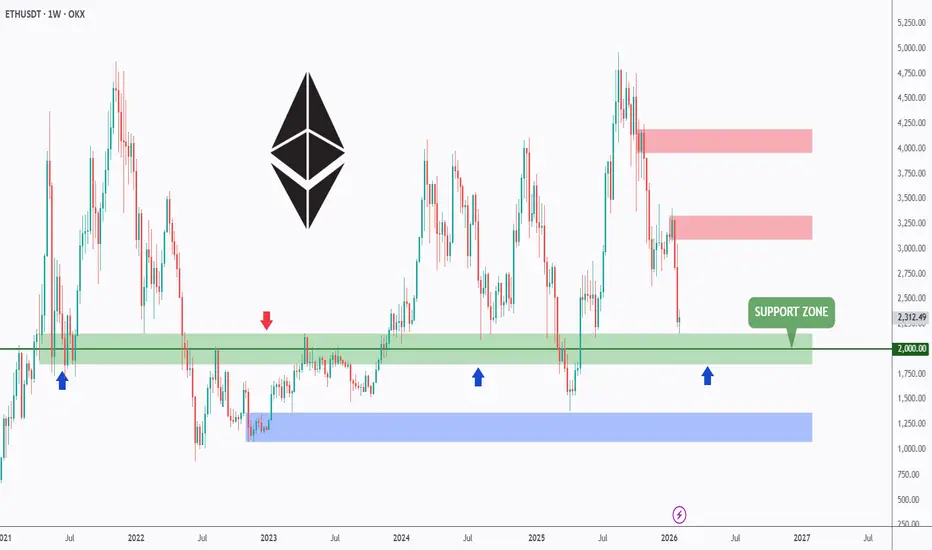
Ethereum (ETH): If This Zone Will Not Hold We Fall To $1380If the current support zone (the lower side of the sideways channel, which is acting as a support) is broken, then ETH will see some very deep downside movement.
But that's not the play for now, as the price remained above the support area even after the recent strong drop we had; the price got sto

See all ideas
Summarizing what the indicators are suggesting.
Oscillators
Neutral
SellBuy
Strong sellStrong buy
Strong sellSellNeutralBuyStrong buy
Oscillators
Neutral
SellBuy
Strong sellStrong buy
Strong sellSellNeutralBuyStrong buy
Summary
Neutral
SellBuy
Strong sellStrong buy
Strong sellSellNeutralBuyStrong buy
Summary
Neutral
SellBuy
Strong sellStrong buy
Strong sellSellNeutralBuyStrong buy
Summary
Neutral
SellBuy
Strong sellStrong buy
Strong sellSellNeutralBuyStrong buy
Moving Averages
Neutral
SellBuy
Strong sellStrong buy
Strong sellSellNeutralBuyStrong buy
Moving Averages
Neutral
SellBuy
Strong sellStrong buy
Strong sellSellNeutralBuyStrong buy
Displays a symbol's price movements over previous years to identify recurring trends.
Frequently Asked Questions
The current price of Ethereum / UST (ETH) is 1,927.00000000 USDT — it has fallen −8.41% in the past 24 hours. Try placing this info into the context by checking out what coins are also gaining and losing at the moment and seeing ETH price chart.
Ethereum / UST price has fallen by −34.65% over the last week, its month performance shows a −39.01% decrease, and as for the last year, Ethereum / UST has decreased by −30.84%. See more dynamics on ETH price chart.
Keep track of coins' changes with our Crypto Coins Heatmap.
Keep track of coins' changes with our Crypto Coins Heatmap.
Ethereum / UST (ETH) reached its highest price on Aug 24, 2025 — it amounted to 4,955.90000000 USDT. Find more insights on the ETH price chart.
See the list of crypto gainers and choose what best fits your strategy.
See the list of crypto gainers and choose what best fits your strategy.
Ethereum / UST (ETH) reached the lowest price of 88.58900000 USDT on Mar 13, 2020. View more Ethereum / UST dynamics on the price chart.
See the list of crypto losers to find unexpected opportunities.
See the list of crypto losers to find unexpected opportunities.
The safest choice when buying ETH is to go to a well-known crypto exchange. Some of the popular names are Binance, Coinbase, Kraken. But you'll have to find a reliable broker and create an account first. You can trade ETH right from TradingView charts — just choose a broker and connect to your account.
Crypto markets are famous for their volatility, so one should study all the available stats before adding crypto assets to their portfolio. Very often it's technical analysis that comes in handy. We prepared technical ratings for Ethereum / UST (ETH): today its technical analysis shows the sell signal, and according to the 1 week rating ETH shows the strong sell signal. And you'd better dig deeper and study 1 month rating too — it's strong sell. Find inspiration in Ethereum / UST trading ideas and keep track of what's moving crypto markets with our crypto news feed.
Ethereum / UST (ETH) is just as reliable as any other crypto asset — this corner of the world market is highly volatile. Today, for instance, Ethereum / UST is estimated as 13.27% volatile. The only thing it means is that you must prepare and examine all available information before making a decision. And if you're not sure about Ethereum / UST, you can find more inspiration in our curated watchlists.
You can discuss Ethereum / UST (ETH) with other users in our public chats, Minds or in the comments to Ideas.