NAS100 at mjaor resistance area Fib 0.5Price has reached the 0.5–0.382 Fibonacci retracement zone of the recent swing. If the bears are strong, we may see a rejection toward the trendline support. However, if this resistance is broken, a bullish continuation is also possible. Let's see how it plays out.
NAS100 trade ideas

NASDAQ Short This is at the all-time high, showing a lot of resistance
There is an AABCD pattern on H1
All timeframes are overbought
There are multiple tops on M15 and M30 with divergence
Stop loss of 150 pips

US100 SHORT-TERM SELLPrice formed a triple top reversal pattern which signal’s possible correction from the high. Therefore, a sell opportunity is envisaged from the current market price. Target profit is 23508


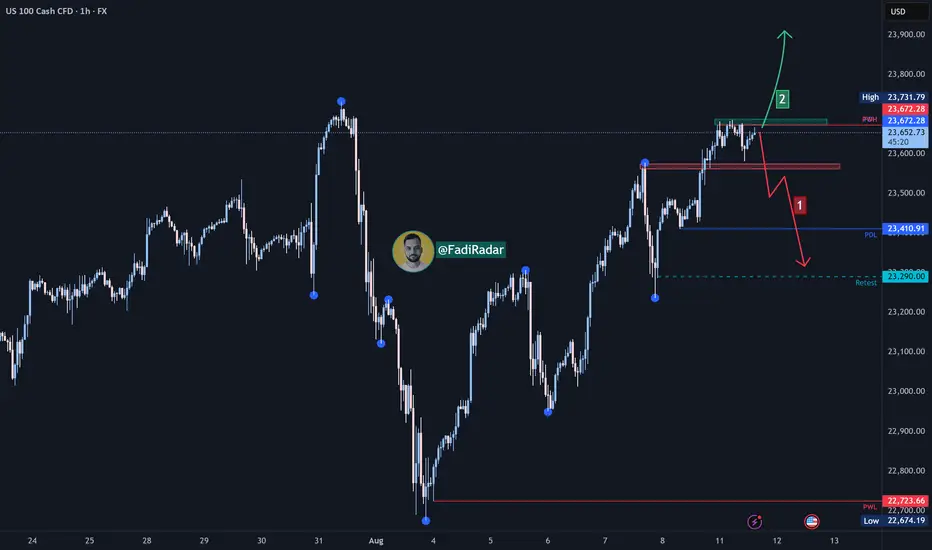
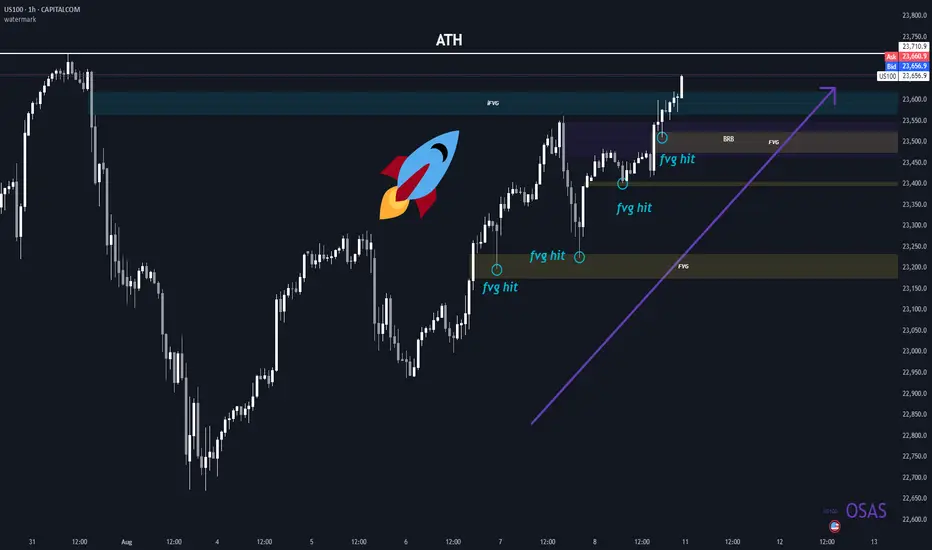
Nasdaq Index Analysis (US100 / NASDAQ)The index is currently trading near $23,670, a pivotal zone between two possible scenarios:
🔻 Bearish Scenario:
If the support at $23,570 is broken and the price holds below it, we may see a decline first toward $23,400, followed by an extended move toward $23,290 as a test area. A break below this level could open the door for further downside corrections.
🔺 Bullish Scenario:
If the price successfully breaks and holds above $23,680, this could support a continuation of the uptrend toward $23,800, and with sustained momentum, a new high could be targeted.
⚠️ Disclaimer:
This analysis is not financial advice. Please monitor market behavior and analyze data carefully before making any investment decisions.
US100 Bullish Momentum Targets AheadThe US100 shows strong bullish structure after completing an ABCD correction, with price eyeing a potential move towards the 1st target at 23,791 and possibly the 2nd target at 24,053. A brief pullback may precede the continuation towards these key resistance levels.
1. Current Structure
The chart follows an ABCD pattern after a strong bullish impulse from the early August lows.
Points A–B–C–D suggest a completed correction phase, with momentum now shifting upward.
Price is currently around 23,629, approaching the first resistance zone.
2. Key Levels
Immediate Support: ~23,500 (recent swing low, short-term demand zone)
1st Target: 23,791 (minor resistance, potential profit-taking zone)
2nd Target: 24,053 (major resistance, psychological round area)
Major Support: 23,200 (break below here could invalidate bullish momentum)
3. Price Action Expectation
Short term:
A small pullback toward 23,500–23,550 is possible before continuing upward (healthy retracement to build buying pressure).

USNAS100 | Consolidation Before CPI –Breakout or Pullback Ahead?USNAS100 Overview
The index reached its all-time high ahead of recent speculation about a potential Fed rate cut. This week’s CPI data will be a key driver, indicating whether the Fed may cut rates in the near term.
Technical Outlook:
As long as the price trades below 23640–23690, a decline toward 23530–23435 is expected. A break below this zone could extend the drop toward 23295.
A 1H close above 23695 would turn the outlook bullish, targeting 23870.
Support: 23535, 23435, 23295
Resistance: 23870, 24040
previous idea:

NAS100 Bearish Correction/Third touch of Support trendlineA correction to the downside and a third touch of the trendline will provide more opportunities to go long. However, confirmations to short are looking strong right now.

NAS100 Trend following tradeNas100 has been on a bullish run and already had a trade running which is already trailing. looking to add a new position after that engulfing on 1hour candle.

NAS100 - Stock market awaits an important week!The index is above the EMA200 and EMA50 on the four-hour timeframe and is trading in its ascending channel. If the index corrects downwards towards the drawn trend line or the specified demand zone, you can buy Nasdaq with better reward for risk.
Many Federal Reserve officials believe that tariffs could weaken the U.S. economy and push inflation higher—a dilemma that forces policymakers to choose between cutting interest rates to support growth or keeping them unchanged to control prices.
However, Miran—the economic adviser President Donald Trump intends to nominate to the Fed’s Board of Governors—rejects this view. He argues that tariffs will ultimately benefit the economy and will not significantly impact prices, allowing the Fed to resume the rate-cutting cycle it halted earlier this year.
The key question now is whether Miran’s arguments will be persuasive enough to sway the broader thinking of the central bank’s policy committee, or whether concerns over labor market weakness might prompt rate cuts regardless, rendering his arguments unnecessary.
According to analysis from The Wall Street Journal, beyond the policy disagreements, Miran has also challenged the institutional legitimacy of the Federal Reserve. He has accused Fed officials of having political motivations and criticized them for what he calls the “tariff disruption syndrome.” In a paper published last year, he argued that all senior Fed officials should be subject to dismissal at the White House’s discretion. If appointed, he would give Trump a loyal ally inside the Fed’s boardroom—someone capable of promoting the president’s views and challenging the institution’s consensus-driven culture and influential research staff.
Meanwhile, JPMorgan has revised its monetary policy forecast for 2025, now expecting the Fed to deliver three 25-basis-point rate cuts starting in September 2025, compared to its earlier projection of just one cut in December.
Miran, who holds a Ph.D. in economics from Harvard University, currently serves as Chairman of the White House Council of Economic Advisers. On Thursday, Trump announced his intention to nominate him for a newly vacant Fed board seat. This position became available unexpectedly after Adriana Kugler’s resignation last week and will expire in January. Trump also revealed plans to nominate another individual to fill this seat, who could potentially replace Jerome Powell as Fed Chair in the spring. Miran’s appointment would give Trump additional time to evaluate how candidates—whether Miran himself or Christopher Waller, whom he appointed during his first term—align with his policy views and vote on interest rates.
This week’s economic calendar is once again crowded, with a series of key inflation reports and consumer-related indicators in the spotlight.
Early Tuesday, the Reserve Bank of Australia will announce its interest rate decision, with markets expecting a 25-basis-point cut from 3.85% to 3.60%. Shortly after, traders’ attention will shift to the U.S. Consumer Price Index (CPI) for July, where core inflation is expected to rise from 0.2% in June to 0.3%.
Wednesday will be relatively quiet, with the main highlight being speeches from Fed officials Austan Goolsbee and Raphael Bostic. On Thursday, focus will return to major data releases, including the U.S. Producer Price Index (PPI), which is projected to see its core measure increase by 0.2% after holding steady in June. Weekly jobless claims figures will also be released that day.
The week will conclude with a broader look at U.S. consumer activity. July retail sales are forecast to slow from 0.6% to 0.5%, while core retail sales are expected to drop from 0.6% to 0.3%. Hours later, the preliminary August reading of the University of Michigan Consumer Sentiment Index will be released, providing insights into consumer expectations and confidence.
According to ISM data, pricing pressures have eased in the manufacturing sector but have jumped sharply in the services sector, which makes up a much larger share of the U.S. economy. This suggests that upcoming CPI and PPI reports carry an upside risk relative to forecasts. Inflation readings above expectations—even before fully factoring in the impact of retaliatory tariffs—could erase part of the market’s anticipated rate-cut outlook.

Different Strats, Same ChartICT, SMC, breakout traders, trendline traders… everyone swears they’ve got a unique edge, but it’s all pointing to the same POI. Same price, same reaction. Doesn’t matter what you call it — the market delivers the same setup for everyone, only difference is how you see it.

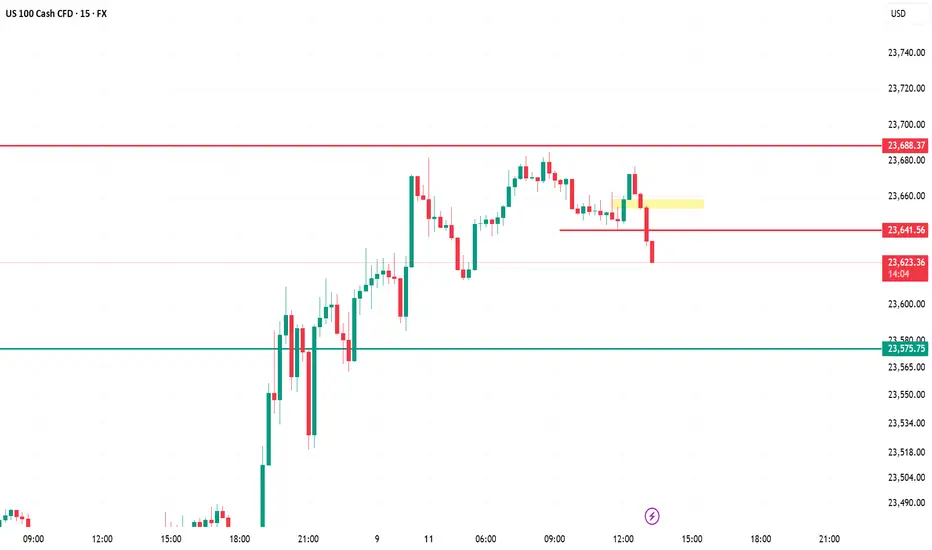
US100 (5m) – AnalysisKey Breakdown – Price has broken below the 23,641 support (red line) after failing to hold the yellow retest zone, signaling short-term bearish momentum.
Immediate Resistance – 23,641 is now flipped into resistance; any pullback toward it could attract sellers.
Downside Target – Next major support sits at 23,575; if broken, deeper liquidity may be targeted below 23,550.
Market Structure – Shifted from intraday uptrend to lower highs & lower lows; momentum favors short trades until structure flips.
Trading Approach – Look for short entries on retests of 23,641 with stop above yellow zone, target 23,575, then trail for possible extended drop.
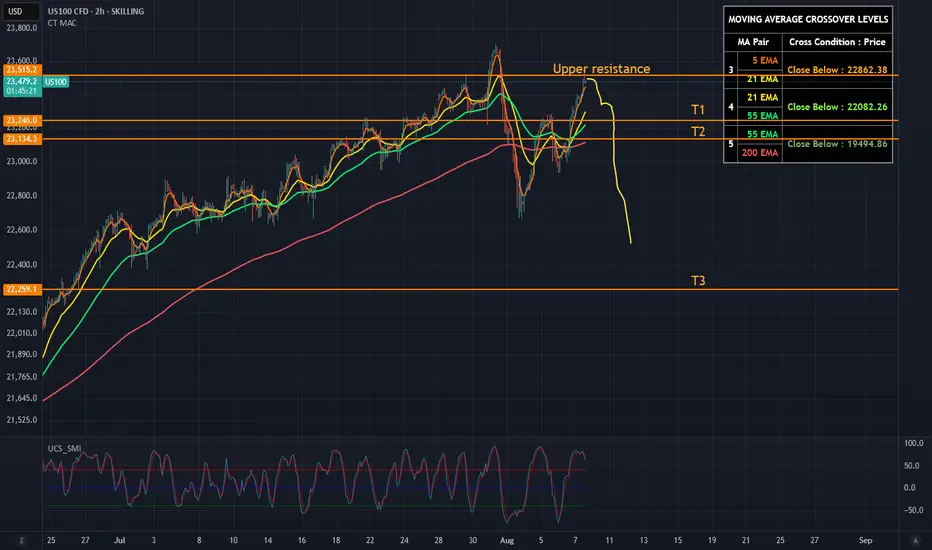
US100: Near All Time Highs, Weak FoundationThe Nasdaq 100 (US100) is hovering near all-time highs (~23,500), but signs of exhaustion are mounting. Momentum is fading, RSI is overstretched, and volume has been declining - all classic symptoms of a tired rally.
From a technical perspective, the index is pressing against upper trendline resistance after an aggressive multi-week run. Price action shows weakening follow-through on each new high, hinting at buyer fatigue. Best example was the huge sell-out last week.
Fundamentally, the rally is losing its foundation:
- Earnings surprises from Big Tech (Apple, Shopify) are already priced in.
- AI hype is cooling off, and valuation multiples remain extreme.
- Macro data (ISM Services, jobs) suggest economic softness.
- Fed rate cut hopes are baked in — any disappointment could trigger a sharp repricing.
Conclusion for me:
The Nasdaq looks ripe for a pullback.
We may possibly see a short spike above my drawn "upper resistance line" but I'm pretty convinced we won't see new ATH, - in my opinion it would be just a stop hunt.
If 23,000 then breaks, watch for acceleration toward 22,500 and beyond. The air is thin up here.
T1: 23250
T2: 23100
And if we get the break - I see T3 - 22250
One unpredictable variable, though? The world’s leaders.
Their "creative" decision-making has the power to nuke any technical setup.
Markets may follow charts and earnings - until a politician wakes up and chooses chaos.
No trading advice, just my ideas. :)
NasdaqAs said before, nasdaq going down, can take out highs then plummet, but time will tell. PS: my previous posts got removed. View auto supply and demand zones indicator. Dm me free for a month free. (It draws snd zones).

NQ ATHYou can see as clear as possible that we are in an uptrend and we're getting a NEW ATH BABYYYY!!! <3
Nasdaq Pumping High, We Might Ride The WavePrice today(Wed) is recovering from yesterday's (Tue) dumping. Our bullish direction is still intact.
Entries should be taken once, price has entered within our Area of Opportunity.
Targets with their success rate have been outlined on the charts.

NASDAQ Potential UpsidesHey Traders, in today's trading session we are monitoring NAS100 for a buying opportunity around 23,300 zone, NASDAQ is trading in an uptrend and currently is in a correction phase in which it is approaching the trend at 23,300 support and resistance area.
Trade safe, Joe.

A Structure-Based Pattern FormationWe have 2 things happening on the NASDAQ. 1) Price ended the week retesting the zone of our previous highs & 2), in doing so it's also formed a completed bearish bat pattern.
If you have any questions or comments, please leave them below.
Akil

Nasdaq Week 33 Possible OutlookAre we ready to drop this coming week? Lookout for reversal/continuation pattern under smaller TF.

NAS100 – Eyeing 23,700.0 ResistanceNAS100 continues its bullish momentum, breaking above the 23,480.0 zone after a strong rally. Price is now approaching the 23,700.0 resistance, with short-term support building near 23,480.0. A retest of support before another push higher remains likely.
Support at: 23,480.0 🔽 | 23,280.0 | 22,960.0 | 22,720.0
Resistance at: 23,700.0 🔼 | 23,850.0
🔎 Bias:
🔼 Bullish: Holding above 23,480.0 and breaking 23,700.0 could extend gains toward 23,850.0.
🔽 Bearish: Failure to hold 23,480.0 may lead to a deeper pullback toward 23,280.0.
📛 Disclaimer: This is not financial advice. Trade at your own risk.

Strong sell us100Pair overbought on H1 and h4 tine frame
Strong selling area reached
We expecting the big drop from this level when market open

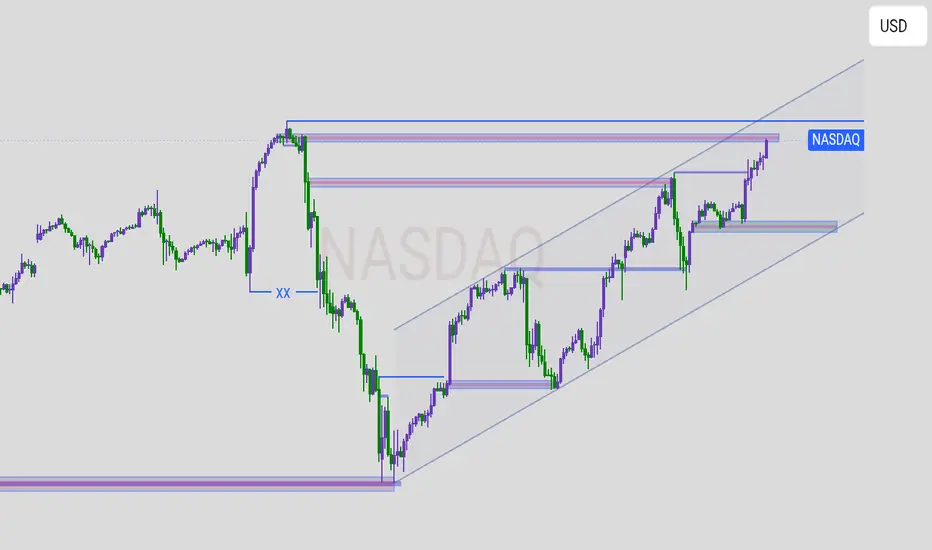
NASDAQ (US Tech 100) chart
Here’s the simple breakdown:
* Price is moving upward inside a rising channel
* This means NASDAQ is currently bullish.
* The price is **near the top resistance** of the channel.
* There’s a **horizontal blue resistance zone** where price has struggled before — it’s testing that level again.
* If price **breaks above** this zone, it could continue climbing toward the upper channel line.
* If price **fails** to break, it may drop back to the **nearest support zone** (the lower rectangle).
Resistance:
The top horizontal blue zone — price must break and hold above it for more upside.
* **Support:** Two blue rectangles below show where price might bounce if it drops.
* The middle support is also in line with the **channel’s lower trendline** — a strong bounce area.
* **Bullish bias**
while inside the channel.
* Watch for a **break above resistance** for a big push up, or a **rejection** for a short-term pullback to support.