nasdaqPair : NASDAQ ( US 100 )
Description :
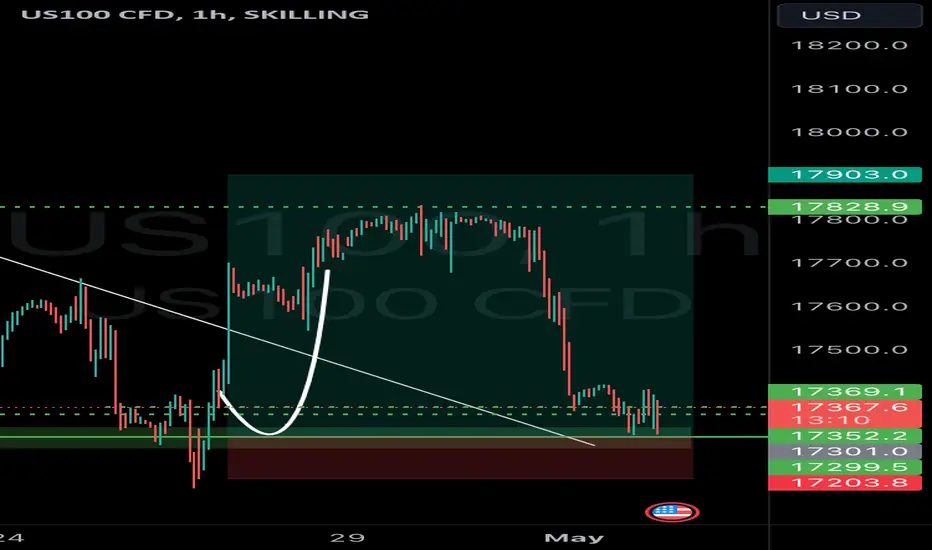
Completed " 12345 " Impulsive Waves
Break of Structure
Rising Wedge as an Corrective Pattern in Short Time Frame
RSI - Divergence
Fibonacci Level - 261.8%
NAS100 trade ideas

USNAS100 (More Bullish Pressure)USNAS100 New Forecast
The price remains under bullish pressure, aiming for further gains to record a new all-time high.
As long as it trades above 18650, the bullish trend is expected to continue towards 18790, 18950, and 19100. However, if the price reverses and stabilizes below 18600, it indicates a correction down to 18435.
pivot line: 18655
Resistance Price: 18790, 18950, 19100
Support price: 18555, 18435, 18230
Its range for Today will be between Support 18550 and Resistance 18790

NASDAQ SELL BELOW 18659.64Hi Traders we have another potential sell trade on NASDAQ update will be send shortly.
Certified Price Action King


NAS100 Hits Record Ahead of NVIDIA but RSI DivergesThe tech-heavy index runs its best month of the year, extending the advance to new record highs. After last week’s CPI moderation, markets strengthened their bets for two rate cuts by the Fed this year, beginning in June. NAS100 now eyes the psychological 19K mark.
On the other hand, the disinflation process has slowed this year and Fed officials have turned cautious around a pivot, adopting a higher-for-longer narrative, while the hawkish commentary continued this week from various policymakers. On the technical side, the RSI did not follow prices higher, in a divergence that creates risk for a pullback towards the EMA200 (black line). Daily closes below it, would pause the bullish bias, but that would need strong catalyst.
Even if a pullback ensues, the path of least resistance is higher. NAS100 has looked past the Fed’s cautious shift, largely due to the generative AI boom and investors now await Wednesday’s results by NVIDIA, its enabler and main beneficiary. After February’s last report, the stock had jumped more than 12% and had lifted NAS100 with it, so there is potential for volatility.
NVIDIA expects new record revenues due to AI demand and growth to the tune of 235% y/y. This would mark a small slowdown in pace and markets will want to see if it can continue to post eyewatering numbers, or if cracks will begin to appear.
Stratos Markets Limited (www.fxcm.com):
CFDs are complex instruments and come with a high risk of losing money rapidly due to leverage. 68% of retail investor accounts lose money when trading CFDs with this provider. You should consider whether you understand how CFDs work and whether you can afford to take the high risk of losing your money.
Stratos Europe Ltd (trading as “FXCM” or “FXCM EU”), previously FXCM EU Ltd (www.fxcm.com):
CFDs are complex instruments and come with a high risk of losing money rapidly due to leverage. 73% of retail investor accounts lose money when trading CFDs with this provider. You should consider whether you understand how CFDs work and whether you can afford to take the high risk of losing your money.
Stratos Trading Pty. Limited (www.fxcm.com):
Trading FX/CFDs carries significant risks. FXCM AU (AFSL 309763). Please read the Financial Services Guide, Product Disclosure Statement, Target Market Determination and Terms of Business at www.fxcm.com
Stratos Global LLC (www.fxcm.com):
Losses can exceed deposits.
Any opinions, news, research, analyses, prices, other information, or links to third-party sites contained on this video are provided on an "as-is" basis, as general market commentary and do not constitute investment advice. The market commentary has not been prepared in accordance with legal requirements designed to promote the independence of investment research, and it is therefore not subject to any prohibition on dealing ahead of dissemination. Although this commentary is not produced by an independent source, FXCM takes all sufficient steps to eliminate or prevent any conflicts of interests arising out of the production and dissemination of this communication. The employees of FXCM commit to acting in the clients' best interests and represent their views without misleading, deceiving, or otherwise impairing the clients' ability to make informed investment decisions. For more information about the FXCM's internal organizational and administrative arrangements for the prevention of conflicts, please refer to the Firms' Managing Conflicts Policy. Please ensure that you read and understand our Full Disclaimer and Liability provision concerning the foregoing Information, which can be accessed via FXCM`s website:
Stratos Markets Limited clients please see: www.fxcm.com
Stratos Europe Ltd clients please see: www.fxcm.com
Stratos Trading Pty. Limited clients please see: www.fxcm.com
Stratos Global LLC clients please see: www.fxcm.com
Past Performance is not an indicator of future results.

Buy All the way to 19000We might reach 19000 sooner than expected, hence we holding these buy position.

NAS100USD Projection: Technical Only.Thoughts on potential future price movement.
- 2 "Potential" options.
- An opportunity becomes realized only if 1 of the 2 "potential" price paths.
- Only Technical Analysis considered.
- "NO" Fundamental Analysis considered.
- "NO" Correlation considered.

nas100 drops after a bullish momentumthere is volume behind the first fair value gap take short partials at 18640,5 for safe entries,possibly at 18707.3 for sniper entry reminder always risk 10% of your money...sl:18722.2

CHART BREAKDOWN NASDAQ: Key Levels, Targets and Thoughts!🎯Brief Description🖊️:
The chart provides insights into critical market levels, emphasizing an essential demand zone (low-risk buy zone) spanning from 18330 to 18315, respectively, are highlighted.
Things I Have Seen👀:
Important Demand Zone🟢: Identified between 18330 and 18315, serving as a low-risk buy.
Bullish Targets📈:
18400: Possible retracement area.
18500: Possible retracement area.
18580: Possible retracement area.
18670: Area with a lot of liquidity.
What's Important Now❗
Currently, the crucial approach is to wait and observe the price action at this level. We need to assess how the market reacts before considering any decisive moves. Stay observant and responsive to real-time developments in the market.

Nasdaq- higher until $18858 / $19115 / $19319Using multiple fibs from multiple time frames,
we should see a pull back at $18858 while heading toward the 5th wave at $19319 with a pause/correction around $19115
Blue line from wave 3 to anticipated wave 5 is the same length as wave 2 to wave 4. Therefore arriving at $19319 - final 5th wave.
Starting at the bottom of wave 4 using Fib extension, we plot levels at 89; our closest level for a correction area to our current price.
yellow Fib level .236 at $18858 is a fib retracement level from the weekly chart between level $16587 and $26211; another point of interest.
If a strong reaction at $19319, we should see a 18% correction on the weekly toward $16k

NasdaQ Climax ! Long OutlookHi friends and Trading community, So here i am sharing mine trading Idea on Nasdaq 100, So as we can see on provided chart price breakout from a symmetrical triangle pattern and a horizontal resistance too at the same time so after the both resistance breakout now price trading on very strong resistance area from where it got rejected in the year of 2021 after the breakout of same horizontal resistance after consolidation and now again reached near to that rejection zone.
So from here it must remain to be seen whether the price will break that resistance and able to close above or not? if this happens we can see price can touch to marked targets on provided chart.
Target ideantification-:
Target one 6% - I meausured from the distance between horizontal resistance to main rejection area which we can see after breakout.
Target two 12% - Pattern based which i measured from triangle height (horizontal resistance) to swing low rising support of triangle.
Rest i will update this accordingly on the basis of price action whether on daily or weekly chart.
This publication is meant for only learning purpose, it is not any kind of trading advice.
Best Regards- Amit
“Hope is a bogus emotion that only costs you money.” -Jim Cramer

A correction to 420-450, then up to 647I´m expecting NAS to fall to 430-460 level and after a rejection will reach 647 (not sure if today). If you decide to enter, wait for rejection, do not FOMO. I will try to update this idea when-if entry conditions are met. Not quaranted here. WIsh you a good luck.

NASDAQ BUY TP HITHi Traders Our analysis for Nasdaq went into our favor as planned. stay tune for more profitable trades.

flat to bearishwe are still into selling bullish moves. Outlook is flat to bearish. I will try to update any change, but so far this trend is bearish.

NASDAQ BUY NOWHi Traders we have potential buy trade on NASDAQ. You can place your buys now. trade setup will be update later.

USNAS100 (Rally with some Correction)USNAS100 New Forecast
The price maintains bullish pressure due to NVIDIA's strong profits.
Technically, a correction is anticipated down to 18435. Stability below this level would indicate a continuation of the bearish trend towards 18235. Conversely, stability above 18661 would support a bullish trend, with the first target being 18790.
pivot line: 18600
Resistance Price: 18660, 18880, 19100
Support price: 18435, 18250, 17990
Its range for Today will be between Support 18235 and Resistance 18790
On the economic data front, weekly initial jobless claims, S&P global flash PMI readings and durable goods data are due through the week.
Global market participants were also closely watching out for developments around the death of Iranian President Ebrahim Raisi, a hardliner seen as a potential successor to Supreme Leader Ayatollah Ali Khamenei, in a helicopter crash.

Nas100 views I think Nas100 will be bearish this week since we swept pMH and created a new high ,I might be wrong .On the chart , I marked out PDH & PDL , The I spotted a IFVG on 1HR which price hasn't mitigated ,so once price sweeps the PDH and mitigate the IFVG , We are going short.
what do you think ??

US100- CONTINUATION PARTERNNOTE:
Broke previous 4 year high and made a 2 Month Pin. The Pin have been broken and re-tested.
See a 1-2 RTM pattern on Daily as one of the Confirmations.
2HR/4HR: Divergence of the 3 pushes:
Buys in order, and breakout of 1 week Wick fill should be addition to the position a

NAS100 Outlook👁️ OUTLOOK
5hr chart:
30m chart:
Context 5hr: Price is breaking bullish and currently reaccumulating. Price is still above the 10,50,200emas which is a good sign. We can see a deeper re-accumulation/pullback towards the 50ema at the beginning of the week.
Validation 30m: Price is currently re-accumulating and is starting to trade below the 10 and 50ema for a deeper pullback for the beginning of the week. I am still expecting bullishness throughout the week and want to see price get to 18675.2 (week high)
Analysis summary: I am bullish on NAS100 and want to see price show a bit of strength and trade above the 10/50 emas before looking for longs. Once this happens then I would happily look for longs on NAS100. Good luck this week and make sure to follow your trading plan/rules!


CHART BREAKDOWN NASDAQ: Key Levels, Targets and Thoughts!🎯Brief Description🖊️:
The chart provides insights into critical market levels, emphasizing an essential demand zone (low-risk buy zone) spanning from 18330 to 18315. Additionally, medium-risk sell zone between 18630-18660, respectively, are highlighted.
Things I Have Seen👀:
Important Demand Zone🟢: Identified between 18330 and 18315, serving as a low-risk buy.
Medium-Risk Sell Zone🟠: Noted between 18630 and 18660, suggesting another area with moderate risk for potential selling positions.
Bearish Targets📉:
18610: Possible retracement area.
18500: Possible retracement area.
18460: Area with laying low liquidity.
Ultimate Target: 18330- Essential Demand Zone
Bullish Targets📈:
18400: Possible retracement area.
18500: Possible retracement area.
18580: Possible retracement area.
18670: Area with a lot of liquidity.
What's Important Now❗
Currently, the crucial approach is to wait and observe the price action at this level. We need to assess how the market reacts before considering any decisive moves. Stay observant and responsive to real-time developments in the market.

