flat to bearishwe are still into selling bullish moves. Outlook is flat to bearish. I will try to update any change, but so far this trend is bearish.
NAS100 trade ideas

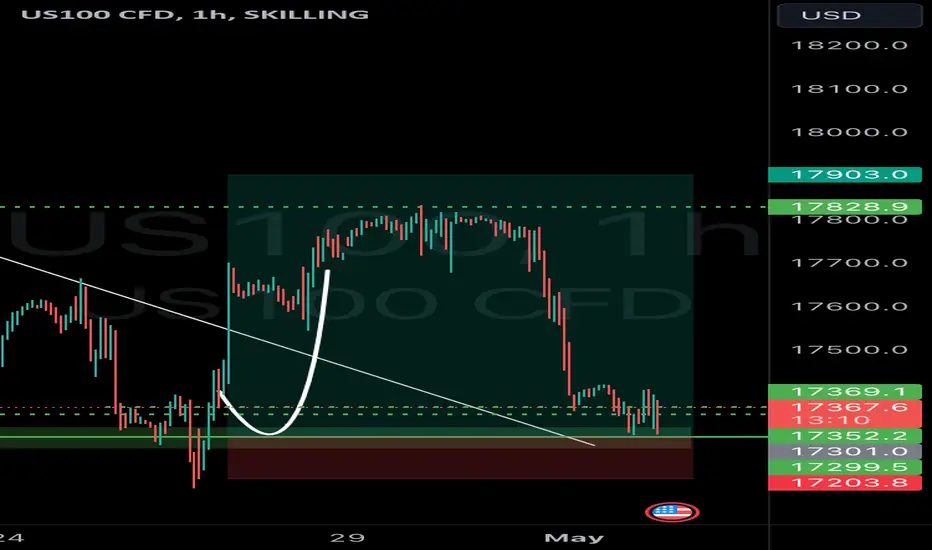
NASDAQ BUY NOWHi Traders we have potential buy trade on NASDAQ. You can place your buys now. trade setup will be update later.

USNAS100 (Rally with some Correction)USNAS100 New Forecast
The price maintains bullish pressure due to NVIDIA's strong profits.
Technically, a correction is anticipated down to 18435. Stability below this level would indicate a continuation of the bearish trend towards 18235. Conversely, stability above 18661 would support a bullish trend, with the first target being 18790.
pivot line: 18600
Resistance Price: 18660, 18880, 19100
Support price: 18435, 18250, 17990
Its range for Today will be between Support 18235 and Resistance 18790
On the economic data front, weekly initial jobless claims, S&P global flash PMI readings and durable goods data are due through the week.
Global market participants were also closely watching out for developments around the death of Iranian President Ebrahim Raisi, a hardliner seen as a potential successor to Supreme Leader Ayatollah Ali Khamenei, in a helicopter crash.

Nas100 views I think Nas100 will be bearish this week since we swept pMH and created a new high ,I might be wrong .On the chart , I marked out PDH & PDL , The I spotted a IFVG on 1HR which price hasn't mitigated ,so once price sweeps the PDH and mitigate the IFVG , We are going short.
what do you think ??

US100- CONTINUATION PARTERNNOTE:
Broke previous 4 year high and made a 2 Month Pin. The Pin have been broken and re-tested.
See a 1-2 RTM pattern on Daily as one of the Confirmations.
2HR/4HR: Divergence of the 3 pushes:
Buys in order, and breakout of 1 week Wick fill should be addition to the position a

NAS100 Outlook👁️ OUTLOOK
5hr chart:
30m chart:
Context 5hr: Price is breaking bullish and currently reaccumulating. Price is still above the 10,50,200emas which is a good sign. We can see a deeper re-accumulation/pullback towards the 50ema at the beginning of the week.
Validation 30m: Price is currently re-accumulating and is starting to trade below the 10 and 50ema for a deeper pullback for the beginning of the week. I am still expecting bullishness throughout the week and want to see price get to 18675.2 (week high)
Analysis summary: I am bullish on NAS100 and want to see price show a bit of strength and trade above the 10/50 emas before looking for longs. Once this happens then I would happily look for longs on NAS100. Good luck this week and make sure to follow your trading plan/rules!


CHART BREAKDOWN NASDAQ: Key Levels, Targets and Thoughts!🎯Brief Description🖊️:
The chart provides insights into critical market levels, emphasizing an essential demand zone (low-risk buy zone) spanning from 18330 to 18315. Additionally, medium-risk sell zone between 18630-18660, respectively, are highlighted.
Things I Have Seen👀:
Important Demand Zone🟢: Identified between 18330 and 18315, serving as a low-risk buy.
Medium-Risk Sell Zone🟠: Noted between 18630 and 18660, suggesting another area with moderate risk for potential selling positions.
Bearish Targets📉:
18610: Possible retracement area.
18500: Possible retracement area.
18460: Area with laying low liquidity.
Ultimate Target: 18330- Essential Demand Zone
Bullish Targets📈:
18400: Possible retracement area.
18500: Possible retracement area.
18580: Possible retracement area.
18670: Area with a lot of liquidity.
What's Important Now❗
Currently, the crucial approach is to wait and observe the price action at this level. We need to assess how the market reacts before considering any decisive moves. Stay observant and responsive to real-time developments in the market.


Nasdaq Analysis Week of May 19th Weekly= Bullish
Daily= Bullish
4H= Bullish
1H= Falling Flag Pattern = Continuation Pattern
30 min & 5 min inverse head & shoulders. Expecting price to respect both patterns and continue up. First TP level around 18664.

NQ new HHstarting from may 2023 1600 points,
we are now very close to target wich is confirmed from fibonacci extension of cpi move and measured move from the may low. If what whathever reason Nvidia and Fmoc min disagree in some way we could have a nive pull back to the 0.618 of mayand probably a retest oj june contract area

What's next for NAS?Significant and powerful drive higher over the last 2 weeks for NAS100 cfds. Taking all time highs. We are in a strong bullish market and with an election year I believe we will see price drive higher.

NAS100 Analysis: Bullish Momentum HoldsHello Everyone,
The NAS100 has adhered closely to our recent analysis. Currently, it's testing the daily support level, which is showing robust resilience. Presently, all indicators suggest further bullish momentum unless the daily pivot point consistently functions as resistance, potentially leading to a retest of the weekly pivot point.
TradeWithTheTrend3344

#nazdaq #NasUS100 #US #StockIn continuation of our previous analysis on the NASDAQ index, it's important to note a strong resistance zone between $18,000 and $18,100. This range has historically acted as a significant barrier to further upside movement. Furthermore, the chart pattern currently resembles a wolf wave, which is typically considered a bearish pattern. Traders should exercise caution around this resistance zone and be prepared for potential downside movement in the near term.

NASDAQ:MICROThe Nasdaq is expected to be set for a drop in impulse wave counting.
Now wave 5 has been completed and there is a possibility that the decline will continue soon.

NAS100 Down or Up?NAS has been going up and down for a while now. I'm looking for it to indicate whether we are going to break pattern and move upward.
If not, we will see the lower highs and lower lows start to creep downward today.
If making an entry, I would need to give enough room for retracement either way

5min Demand zone for re entry from the 15m OBLooking for a tap into lower TF demand zone to continue upward move toward previous highs. Once a 5 minute candle taps, will wait for candle close to enter long.


SCALP SOUTH!!Price has met some resistance and has started to ascend forming a mini bullish flag on the 1H. For high risking traders

NDX | IT SECTOR MAY FLY ???Another indicator on if things go well with the breakout, we may see good momentum in Indian IT Sector. Although until that happens, the price can always reverse. So a little patience might pay well.

NAS100 Outlook👁️ OUTLOOK
5hr chart:https://www.tradingview.com/x/o9c9T2FP/
30m chart:
Context 5hr: Price has been bullish since the beginning of May. Trending nicely above the EMAs 10,50,200. Price is re-accumulating and we might get a slight pull back the beginning of the week then a push higher towards the end of the week but we will see.
Validation 30m: Price is trending very nicely above the EMA's. Currently coming back to meet the 50ema.
Bias: Bullish and I will be putting this on my watchlist for the week to look for longs.

USNAS100 (Short Movement ) retracement NASDAQ New Forecast
(Structure: Short)
The price is still retracing towards 18,435 after dropping and stabilizing below the pivot zone, which lies between 18,660 and 18,600.
As long as trading remains below 18,600, the price is expected to drop to 18,435. A subsequent break below 18,420 would signal a continuation of the bearish trend towards 18,250. However, stabilization above 18,435 would indicate a potential bullish trend for the Nasdaq, potentially leading to new record highs.
If the price pushes up from the current level and breaches the pivot line at 18,660, it would support a bullish trend, targeting 18,830 and 19,100.
pivot line: 18600
Resistance Price: 18660, 18880, 19100
Support price: 18435, 18250, 17990
Its range for Today will be between Support 18250 and Resistance 18880
