US100-bias shortBearish indications:
Bearish flag break out .
LLLH
Shooting star candle in 4 hr time frame.
Currently at lower high
Bearish divergence in day time frame.
Trade plan bias short @ 17920
SL:17995
TP1:17842
TP2:17788
NAS100 trade ideas

Bullish Momentum: NAS100 Outlook Remains PositiveHello Everyone,
The long-term outlook for NAS100 remains optimistic, with a sustained and stable position above the 1D Pivot Point being the current focus. Despite some short-term bearish sentiment among investors anticipating a reversal, the bullish projection remains intact across all levels. The prevailing expectation is for a bullish continuation to persist.
TradeWithTheTrend3344

NAS100 A Channel Up pattern shows a clearly defined uptrend and describes the behaviour of the price contained between upward sloping parallel lines. Higher highs and higher lows characterize this price pattern.

NAS100 SELLPlease take trade on your own risk!
Verse of the day Romans 10:17
Take Profit:18040
Stop Loss: 18448

Technical and digital analysisWe notice that we are in an upward correction and there is an increase in momentum. We are waiting for sellers to weaken in order to buy, and there is a divergence

NASDAQ SELLThe only holy grail strategy you need is learning to read raw price action. Raw price action I mean a clean chart with 0 indicators. I barely use indicators on my chart.

US100 (NQ) Long OpportunitiesHi!
After US Indices heading to a new high, we finally see some weakness in the market. It`s now one and a half hours till US Market opening.
I am looking for further downwarts movement. If price reaches some interesting zones AND shows bullish strenght in the lower time frame, I will go long.

NAS100- **Bearish Butterfly Pattern**:
- A technical analysis pattern seen in financial markets.
- Signals a potential reversal from an uptrend to a downtrend.
- **Structure**:
- Consists of four price swings: XA, AB, BC, and CD.
- Resembles the shape of a butterfly.
- **Key Characteristics**:
- AB leg retraces a portion of XA.
- BC leg extends beyond XA.
- CD leg retraces a portion of BC.
- **Trading Strategy**:
- Consider short positions after the completion of the pattern.
- Set stop loss above the pattern's high.
- Set profit targets at key support levels or Fibonacci extensions.
- **Caution**:
- Analyze other indicators and market context.
- Implement risk management strategies.

NAS100/NASDAQ HIGHER CONTEXT BUYHello fellow traders, this idea is BUY only. if you can wait for this zone.
The BTFP already dried up since March 11, Im expecting a bearish scenario on most indices like this $nas100. This idea is for higher context traders who like swing.
This is not a financial advice either, Im not giving a higher explanations on my idea.
Trade it or wait for it. You either a short or Longs.
This is only for traders who understands higher timeframes.

NASDAQ gave a multiyear breakout Nasdaq which is a USmarket Indice has given a breakout on monthly charts with a cup and handle pattern, even price action is seeming good. Also we will be witnessing US election in this year. This upmove can directly affect our indian IT sector.

Outlook on NASPrice reached ATH at $18500 and is currently retesting the previous support level at $18420 - 18400 on the Daily timeframe. On the 4H we can see a large bearish engulfing candle which could indicate a possible trend reversal. A candle closure below the Daily support of $18350-18320 will be confirmation of a bearish market. The next available support can be found at $18270 - $18250.

GoldGold is under testing now targeting 2250 as a first stop then will fly all the way till 2500 before the end of june

NASDAQ Aiming Higher: New Upward Rally Continues!NASDAQ maintains its upward trajectory, continuing its ascent in a new rally. With bullish momentum intact, the index remains focused on reaching higher levels. Investors are optimistic about the sustained growth potential, driving confidence in the NASDAQ's performance. As the rally persists, attention is keenly directed towards emerging opportunities and potential market developments. Amidst evolving market dynamics, the NASDAQ's resilience and upward momentum underscore its significance as a key benchmark for technology and growth-oriented stocks.

Whats next for Nas100??So I have a couple of reasons as to why I can see prices pushing higher. If looking on the 4H we broke out of what looks to be a bullish wedge and also a double bottom. we got a solid pump from yesterdays news. Now we wicked above last Friday's high but no candle closeon the 4H, at least not yet. Momentarily Nas is going short but not for long, we do need it to fill in these gaps and you can also see even better on the 2H. My second reason is if you see on the 2H it looks like we finished leg 3 of the elliot wave pattern hopefully dropping to that golden zone or even 18000-17950 which My extreme POI, then look for a 15min entry. After entry I'm holding to 18875. Good luck everyone!
www.tradingview.com

NASDAQ H4 IdeaPotential for a bearish pullback on the NASDAQ H4 which could lead to a price movement towards the support level at 17600.


NAS100Ultimately bullish on the Nasdaq. Just waiting for any sort of pullback to get involved in the trade

US100 LONGI took this long while i was out of my house (look at previous idea on my page to see evidence and timestamp for the long entry) Unfortunately my idea wouldnt publish on my phone.
Long was taken as a reverse postion to my prior short trades that i closed at break even and a small loss.
Long is also explained within those ideas, But heres a quick breakdown.
After multiple fast rallies to the top side, re testing todays and yesterdays highs i was wanting to see price hold and drop from these levels as a last ditch effort from longs. However if price broke above and held above them levels it would signal to me that longs are in a more valuable spot than short traders as they hold more value holding their postions rather than closing them.
Alot of the time, other traders see this and close their shorts agreeing with potential value to short at higher prices. If prices were to of dropped low again, There would be a higher value change in a long than a short.
Shortly after the long postions were taken, we saw a large push to the top side as i predicted would happen if price held above (which it did)
Im now expecting this long postion to hold for a few days and i will trail and update as price continues to rise.

US100 LONGExtremely low risk on this trade - refer to bottom to see how i risk.
Price has just taken out most of the weeks highs via a very strong, consistent rally.
Im expecting price to fake this level to gain the luqidity it needs to push higher.
If price does not move higher and manages to break and stay below the newest low then i will close for a small loss and reverse the postion.
- I risk a % of my capital per 1% market change.
Example, 1% risk per 1% market change. Hover over the long tool in the idea to see the total % risk/gain for this trade.
I will also be trailing this trade as i have done my last, The TP is not infact my TP.

Uptrend analysis on Nas100This does not constitute as financial advice it is purely analysis intended for educational purposes

NASDAQ, expect a top to be built at 18kHello everyone,
I've been watching NASDAQ closely as I expect to end an elliot wave count around the 18k area.
If the level will be reached soon the chance for a correctional move is high, where we could anticipate in.
To make it short, the psychological level of 18.000 will be very interesting, but there is also the channel trendline above, that should form strong resistance. I usually work with several positions, the cyan tringle area will be used for shorting.
I will keep you updated about further actions.

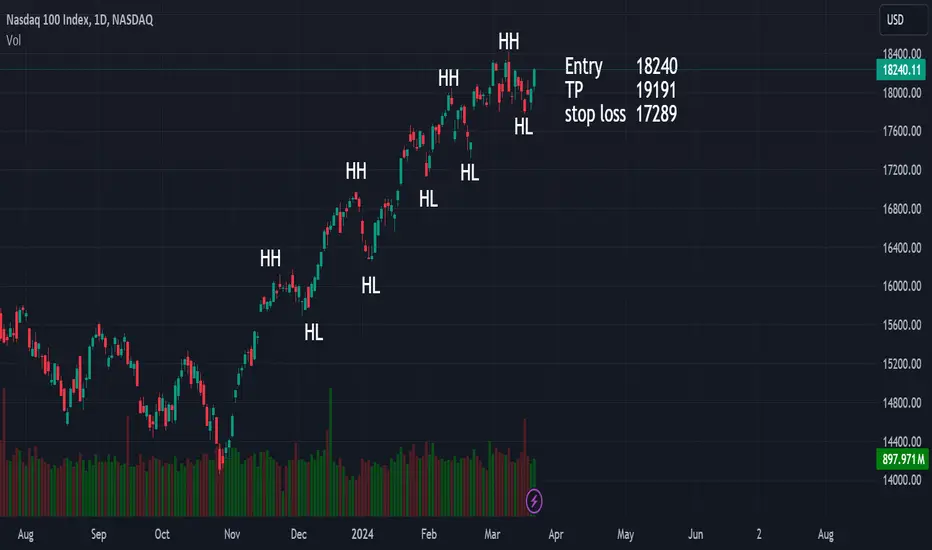
NDX Still BullishNDX still creating Higher highs and Higher lows. The trend is still advancing. However, it is important to do your own research before making any investment decisions.
US 100 resultUS 100 trade result, the target was reached. Most of the volume was yesterday, the FOMC
