US100 | NASDAQ – 15 Min Price & Time Analysis NASDAQ (US100) is trading inside a critical Price & Time zone based on Gann 144.
Primary scenario (Sell):
Sell is activated only after a clear break below 25150.
SL: 25320
Targets: 24980 – 24880 – 24750
Alternative scenario (Buy correction):
Buy only if price breaks and holds above 25350.
SL: 25150
Targets: 25500 – 25620
Current movement is corrective within a broader bearish structure.
Risk management is required.
US100, NASDAQ, GANN, PRICEACTION, INTRADAY
Market insights

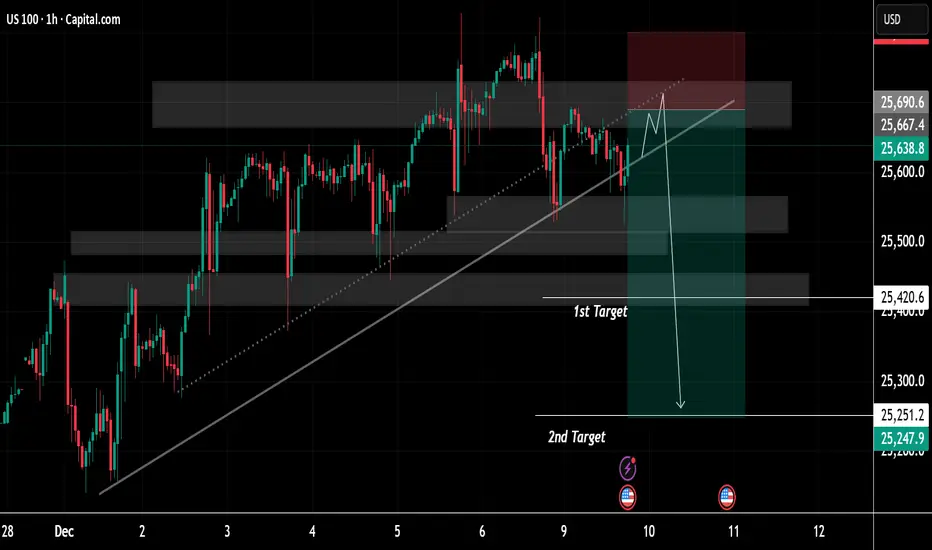
US100 Price Update – Clean & Clear ExplanationUS100 is moving within a broad ascending channel, defined by a long-term diagonal support line that has guided the market’s bullish momentum since late November. Multiple interaction points along this trendline show it has historically acted as a reliable dynamic support zone.
Several shaded horizontal regions highlight key supply and demand zones. These zones reflect areas of repeated institutional activity where price has previously paused, consolidated, or reversed. The upper shaded region represents a resistance cluster where bullish momentum has struggled to sustain continuation, resulting in repeated rejections and wicks to the upside.
The most recent price movement shows the index pushing upward into this resistance band once again, followed by signs of exhaustion. A projected schematic drawn on the chart suggests a potential final liquidity grab—where price may sweep the highs near resistance before reversing. The marked red zone indicates the anticipated rejection area, implying traders may be monitoring this region for a potential bearish shift.
Below, two targets are outlined:
1st Target: Positioned near a mid-range demand zone, aligning with a previous consolidation block. This zone represents the first probable area where price may stabilize or react after a breakdown from the trendline.
2nd Target: A deeper level aligned with a broader structural demand zone. This region marks a significant liquidity pool and a potential magnet for price if bearish momentum continues.
The downward arrow illustrates the conceptual path of a scenario where the ascending trendline is broken decisively, potentially triggering a momentum-driven decline toward these target levels. This depiction emphasizes the importance of trendline integrity and the reaction at the overhead supply zone.
Overall, the chart presents a clean confluence-based structure combining trendline dynamics, supply-demand mapping, and liquidity behaviour—offering a well-organized visualization of a possible medium-term market reversal scenario within a prevailing upward trend.
If You find it helpful please like and comments for this post and share thanks.
Why Traders Lose More Money on Monday MorningsWhy Traders Lose More Money on Monday Mornings
A trader opens a position at 9:35 AM on Monday. An hour later, closes with a stop loss. Same trader, same strategy, but Wednesday afternoon. Opposite result.
Coincidence? No.
The market changes not just in price. It changes in mood, speed, and aggression of participants. And this depends on time.
Monday Morning: When Emotions Rule
The weekend is over. Traders have accumulated news, opinions, fears. The first hour of trading resembles a crowd at a sale. Everyone wants to enter first.
The problem is decisions are made on emotions, not analysis. Volatility spikes. Spreads widen. False breakouts happen more often.
Research shows: Monday brings traders the highest proportion of losing trades for the week. Psychology works against you from the start.
Asian Session vs American
At 3 AM Moscow time, Tokyo opens. Movements are smooth, predictable. Ranges are narrow.
Then London joins. Speed increases. Volumes triple.
New York adds chaos. From 4:30 PM to 6:00 PM MSK, the market becomes a battlefield. US news overlaps with European position closures.
Different sessions require different psychology. Asia loves patience. Europe demands speed. America tests nerves.
Friday Afternoon: Trap for the Greedy
By Friday, traders are tired. More decisions made than the entire week. Willpower reserves are depleted.
After lunch, many just want to close the week. Mass position closing begins. Trends break. Patterns stop working.
But the most dangerous thing: the desire to "recover for the week." A trader sees the last chance to fix results. Enters risky trades. Increases lot size.
Broker statistics confirm: Friday after 3 PM MSK collects more stop losses than any other time.
Ghost Hours
There are periods when the market technically works, but better not to trade.
From 10 PM to 2 AM MSK, America closed, Asia still sleeping. Liquidity drops. One large order can move price 20 pips.
European lunch time (1 PM-2 PM MSK) is also treacherous. Volumes freeze. Price marks time. Then suddenly shoots in any direction without reason.
Trading these hours resembles fishing in an empty pond. You can sit long and catch nothing.
How Time Affects Your Thinking
Fatigue accumulates. In the morning you analyze each trade. By evening you just click on the chart.
Biorhythms dictate concentration. Peak performance for most people falls at 10 AM-12 PM. After lunch comes a decline. By 5 PM, risk assessment ability drops 30%.
Add caffeine, sleep deprivation, personal problems. Your state changes perception of the same situation on the chart.
Wednesday: The Golden Middle
Statistics say: Wednesday gives the most stable results.
Monday emotions passed. Friday fatigue hasn't arrived yet. Market works in normal mode without surprises.
Most professional traders concentrate activity right in the middle of the week. Less noise, more patterns.
Find Your Time
No universal recipe exists. Some trade Asian session excellently. Others catch New York volatility.
Keep a journal not just on trades, but on time. Mark when you make the best decisions. When you make impulsive mistakes.
After a month you'll see a pattern. Perhaps your brain works clearer in the evening. Or Mondays really bring only losses.
Adapt your schedule to biology, not to the desire to trade 24/7.
Time as a Filter
Experienced traders use time as an additional entry filter.
Good setup on Monday morning? Skip it. Same setup on Wednesday? Take it.
Buy signal at 11 PM? Wait for Tokyo opening. No point risking with low liquidity.
Time doesn't cancel strategy. But it adds probability in your favor.
What the Numbers Say
Data from thousands of accounts show clear patterns:
Monday: minus 2-3% to average profitability
Tuesday-Thursday: stable results
Friday: minus 1-2% after 3 PM
Night sessions: unprofitable for 78% of traders
London-New York overlap: maximum profit for scalpers
Numbers don't lie. Psychology is real.
Final Word
You can have the best strategy in the world. But if you trade at the wrong time, results will be average.
The market doesn't change. People trading in it change. Their fatigue, fear, greed, inattention.
Time of day and day of week determine who is in the market now and in what state. And this determines how price will move.
Choose trading time as carefully as you choose entry point. Many traders add time filters to their strategies or use indicators that help track session activity.

Nasdaq-100: Entry Setup & Pullback in 2026?US100 / Nasdaq-100 long 📈 – today looks like a solid entry opportunity. The volume pool at the ATH from October 30, 2025 is already waiting for me 😏
If I take a bit of a risk, I’d say a short-term dip below 24,500 is possible. For me, though, it’s more likely after checking out the ATH zone, so I see it as a possible scenario for next year. Really excited to see how it plays out!
Happy holidays, everyone! 🎄✨

NAS100 short trade setupNAS is currently trending downward creating LH's and LL's since it has broken below the range.
-Since NY session is closing soon I don't expect the move to happen today, we don't have volume. It will most likely move sideways until tomorrow NY session.

US100 Free Signal! Sell!
Hello,Traders!
US100 taps into a well-defined horizontal supply zone after a strong bearish displacement, confirming smart money distribution. Price failed to reclaim the supply cluster and is now respecting bearish order flow, with downside liquidity resting below recent lows.
--------------------
Stop Loss: 25,283
Take Profit: 24,891
Entry: 25,123
Time Frame: 4H
--------------------
Sell!
Comment and subscribe to help us grow!
Check out other forecasts below too!
Disclosure: I am part of Trade Nation's Influencer program and receive a monthly fee for using their TradingView charts in my analysis.

US NAS 100DO YOU KNOW WHATS BEHIND THIS OR OTHER IDEAS?? in bio..
Preferably suitable for scalping and accurate as long as you watch carefully the price action with the drawn areas.
With your likes and comments, you give me enough energy to provide the best analysis on an ongoing basis.
And if you needed any analysis that was not on the page, you can ask me with a comment or a personal message.
Enjoy Trading ;)

NASDAQ Awaits Breakout After Support ReboundUSNAS100 – Technical Overview
The price recently reached the 24820 support zone and rebounded exactly as expected.
At the moment, the market is trading in a short-term bullish correction phase, with upside potential toward 25420.
To shift into a full bullish structure, the price must break and close above 25420, which would open the path toward:
→ 25570 → 25830
However, if the price fails to hold above 25100, the bearish scenario will reactivate, targeting:
→ 24820 → 24570
Volatility may remain elevated following the recent macroeconomic releases.
Pivot Line: 25210
Resistance: 25420 · 25570 · 25830
Support: 25100 · 24820 · 24570

Potential bearish drop?US100 has broken through the resistance level, which is an overlap resistance and could drop from this level to our take profit.
Entry: 25,247.45
Why we like it:
There is an overlap resistance level.
Stop loss: 25,543.25
Why we like it:
There is a pullback resistance level.
Take profit: 24,485.92
Why we like it:
There is a pullback support level that aligns with the 78.6% Fibonacci projection.
Enjoying your TradingView experience? Review us!
Please be advised that the information presented on TradingView is provided to Vantage (‘Vantage Global Limited’, ‘we’) by a third-party provider (‘Everest Fortune Group’). Please be reminded that you are solely responsible for the trading decisions on your account. There is a very high degree of risk involved in trading. Any information and/or content is intended entirely for research, educational and informational purposes only and does not constitute investment or consultation advice or investment strategy. The information is not tailored to the investment needs of any specific person and therefore does not involve a consideration of any of the investment objectives, financial situation or needs of any viewer that may receive it. Kindly also note that past performance is not a reliable indicator of future results. Actual results may differ materially from those anticipated in forward-looking or past performance statements. We assume no liability as to the accuracy or completeness of any of the information and/or content provided herein and the Company cannot be held responsible for any omission, mistake nor for any loss or damage including without limitation to any loss of profit which may arise from reliance on any information supplied by Everest Fortune Group.

NASS100 - Bias BearishThe bias for NAS100 today is bearish.
Yesterday’s daily candle met the bearish bias condition, signaling weakness and potential continuation to the downside. Price action shows that buy-side liquidity has been engaged, followed by a bearish daily close, which aligns with sell-side delivery.
As long as price remains below yesterday’s high and continues to respect lower structure, the market favors downside expansion.
Bias Summary:
Daily bias: Bearish
Expectation: Lower prices
Focus: Sell-side liquidity targets
Best entries: Retracements into premium zones
Stay patient and trade in alignment with the daily narrative. 🧠🔥

NASDAQ100 Technical Roadmap for Swing Traders📈 NASDAQ100 Bullish Swing Setup — Pullback to Power Move?
Asset:
NAS100 / US100 — NASDAQ 100 Index 💻📊
Market Type: Index
Trade Style: Swing Trade
📌 Market Plan (Bias):
🟢 Bullish structure confirmed
Price is respecting the Triangular Moving Average (TMA) pullback, signaling continuation strength within the broader uptrend.
🎯 Entry Strategy:
✅ Any Price Level Entry (Layered Approach Allowed)
Layering / Scaling-In Method:
This plan uses a multiple limit order (layering) strategy to optimize average entry during pullbacks.
Buy Limit Layers:
24900
25000
25100
📌 (You may increase or adjust layers based on your own risk and capital allocation)
🛑 Stop Loss (Risk Control):
🔴 Thief SL: 24700
📢 Adjust your stop loss according to your personal risk management and strategy.
This level invalidates the bullish pullback structure if broken.
🎯 Target / Exit Plan:
🟠 Primary Target: 25800
📌 Rationale:
Strong resistance zone
Overbought conditions may appear
Trap potential near highs
Possible corrective move from resistance
💡 Action: Secure profits near resistance — don’t overstay.
⚠️ Risk Disclaimer:
📢 Stop loss and target levels are for educational purposes only.
📢 Always manage risk independently and trade responsibly.
🔗 Related Markets to Watch (Correlation & Confirmation):
📊 US Indices (Direct Correlation):
US30 (Dow Jones) 🏭
→ Strength confirms broad US equity participation
SPX500 (S&P 500) 📈
→ Institutional flow confirmation for NASDAQ strength
💵 USD Index & Rates (Inverse / Indirect Impact):
DXY (US Dollar Index) 💲
→ Strong USD can slow tech upside; weakness supports NAS100
US10Y Treasury Yield 📉
→ Falling yields = bullish for growth & tech stocks
🧠 Risk Sentiment Assets:
BTC/USD ₿
→ Risk-on flows often align with NASDAQ momentum
VIX (Volatility Index) ⚡
→ Rising VIX = caution; falling VIX = trend continuation
💬 Final Note:
📈 Follow structure, respect risk, scale wisely.
🧠 Let price confirm — don’t chase.
👍 If this plan helps your analysis, boost with a like and share your view.

NASDAQ100 MARKET OUTLOOK!Price is bearish from the H4 perspective. The key level is broken to the downside confirming a possible bearish trend. All I’m waiting to see is an engulfing pattern and I’ll opt in for a sell. A sell opportunity is envisaged.

Nasdaq retraced from resistance and taken support at demand zoneNasdaq retraced from resistance and taken support at demand zone.

US100 = NASDAQ there is a buy opportunity very soonas my previous analysis on nasdaq i expect a big short but does it started yet ? not certain maybe not yet so as it hits downside of the channel i am considering a buy trade here if it downbrake stop loss. waiting ona shorter time frames reversal or upbrake of the last down movement.

USTEC What I am waiting for on US Tech…This is the zone I’m waiting for on Nasdaq. I already have limit orders placed — now we wait and monitor price action
ICMARKETS:USTEC IG:NASDAQ CAPITALCOM:US100 PEPPERSTONE:NAS100 NASDAQ:NDX

US100 - Short SetupI would love to see this continue it's bearish theme, obviously the stock market open volume is what really drives this instrument. If we can stay in this position and follow a theme as indicated with the path arrows on the chart, this may well be one of the best entries this year!
We have banked a bit of profit now and running this risk free. We may be able to get multiple entries from this original signal, or in the case this resistance zone breaks and we get the remaining position tapped at entry, we have 25,250 sell zone to fall back on.

US100 - Short Position US100 H1
We have a top forming on a previous area of supply, a higher risk trade, but with high risk comes high reward. We have a 10R measured here on this position.
Failing this, we may take a loss and trade towards 25,250 price, major resistance, from here, we will look to recoup any potential loss from this trade and then some, risk management is key as always.

NAS100 H4 | Potential Bearish DropMomentum: Bullish
The price has reacted off the sell entry, which is a pullback resistance
Sell entry: 25,569.52
Pullback resistance
Stop loss: 25,787.46
Multi swing high resistance
Take profit: 25,216.31
Overlap support
High Risk Investment Warning
Stratos Markets Limited (tradu.com ), Stratos Europe Ltd (tradu.com ):
CFDs are complex instruments and come with a high risk of losing money rapidly due to leverage. 70% of retail investor accounts lose money when trading CFDs with this provider. You should consider whether you understand how CFDs work and whether you can afford to take the high risk of losing your money.
Stratos Global LLC (tradu.com ): Losses can exceed deposits.
Please be advised that the information presented on TradingView is provided to Tradu (‘Company’, ‘we’) by a third-party provider (‘TFA Global Pte Ltd’). Please be reminded that you are solely responsible for the trading decisions on your account. Any information and/or content is intended entirely for research, educational and informational purposes only and does not constitute investment or consultation advice or investment strategy. The information is not tailored to the investment needs of any specific person and therefore does not involve a consideration of any of the investment objectives, financial situation or needs of any viewer that may receive it. Past performance is not a reliable indicator of future results. Actual results may differ materially from those anticipated in forward-looking or past performance statements. We assume no liability as to the accuracy or completeness of any of the information and/or content provided herein and the Company cannot be held responsible for any omission, mistake nor for any loss or damage including without limitation to any loss of profit which may arise from reliance on any information supplied by TFA Global Pte Ltd.

Nasdaq - The final blow-off top!⚰️Nasdaq ( TVC:NDQ ) can rally a final +25%:
🔎Analysis summary:
Just this month, we witnessed quite some volatility on the Nasdaq with a correction of about -10%. However, bulls immediately stepped in and clearly pushed price higher. Since there is still bullish pressure, a final blow-off top rally in the near future is quite likely.
📝Levels to watch:
$25,000 and $30,000
SwingTraderPhil
SwingTrading.Simplified. | Investing.Simplified. | #LONGTERMVISION

USNAS100 | Breakout Watch Between 25250–25100USNAS100 | Technical Overview
The price is currently consolidating between 25250 and 25100, waiting for a breakout to determine the next direction.
- A 1H candle close below 25100 will signal a bearish continuation toward 24770, with further downside potential toward 24570 and 24360.
- A 1H candle close above 25250 will support a bullish move toward 25430, and if momentum continues, the next target is 25670.
Today’s economic data will likely increase volatility. With inflation cooling and fundamentals improving, the indices market may experience bullish volatility in the short term.
Key Levels
Pivot Zone: 25250 – 25100
Support: 24770, 24570, 24360
Resistance: 25430, 25670, 25830
Bias: Breakout-dependent; fundamentals lean bullish.

$NQ NASDAQ/US100 Bearish W Pattern Target Hit, Next Quick UpdateHi
The W pattern completed as expected and after that it fell. It reached the first bearish target. I personally am not looking for any more bearishness. I an bullish from the current levels. However I trade what I see and will plan after seeing the latest price action.
There was a big gap let. All these gaps may or may not get filled but they are important levels. So if the markets becomes bullish again, it may try to go higher from the current levels o fill that gap to the upside.
These is a previous gap level which can also provide support if the market falls from the current levels.
Trade what you see, wait for the confirmations and manage the risk as always.
Follow for more. Please support this analysis by liking, commenting, and sharing with friends, colleagues, traders, and trading communities. Thanks👍🙂

SET BUY STOP ON 25000 (NAS100) NOW!Broke? You need a trade to set you free? Now this is it, place your buy stop, do not ask me why. Just place your buy stop, hold the trade until January 2026. The rest is history. Thank me later.

Nasdaq 100 extends dropTech trouble causing indices to turn lower on the session as bond yields continue to remain supported. Nvidia and Alphabet led tech lower, causing the Nasdaq 100 to shed over 1%. Keep an eye on Micron Technology earnings after the close. There is growing skepticism about the artificial-intelligence trade, which is why the Nasdaq 100 has under performed in recent days. Keep an eye on it as the selling could gather pace if more support levels break.
By Fawad Razaqzada, market analyst with FOREX.com
