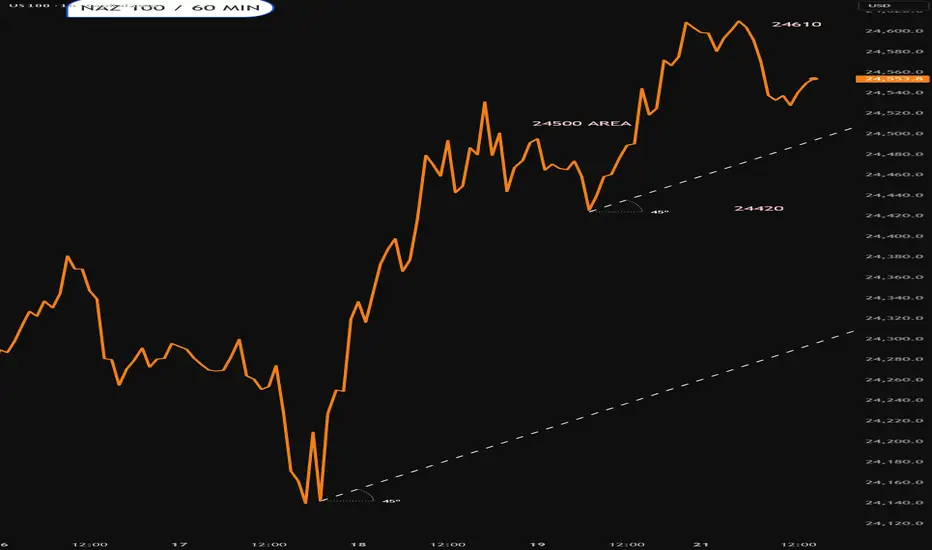
NAS100Scenario 1: If, after taking that liquidity, the price returns to 24,722.00, we could find a support area there from which the market may continue its upward move.
Scenario 2: If that previously mentioned zone doesn’t hold, the price could retrace back to the origin of the impulse, and then continue structurally without significantly compromising the underlying level (Flip Zone Box).
👉 In both cases, the targets remain those boxes above.
Trade ideas

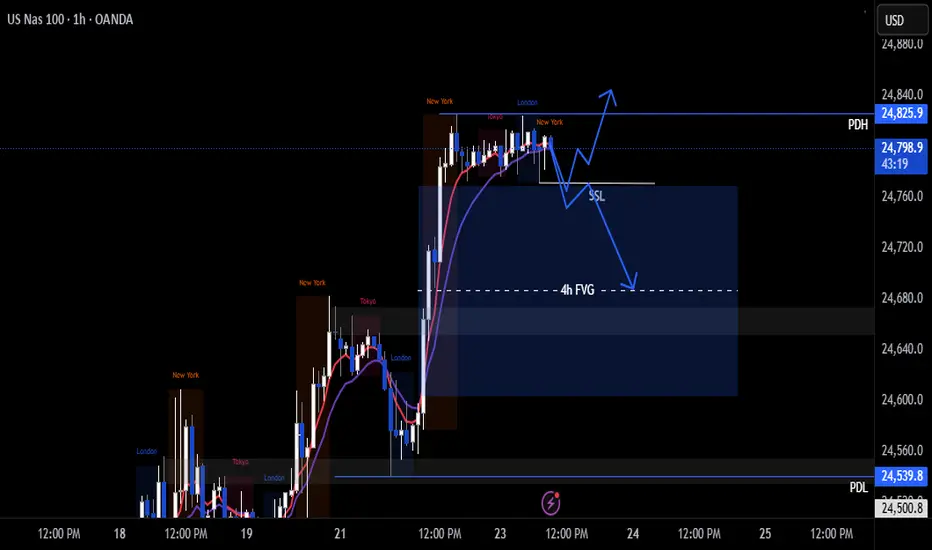
Nas100 Trade Set Up Sep 23 2025Price has created a big 4h FVG so if price closes under SSL at London lows i will target 50% of the 4h FVG but if price sweeps SSL and closes above i will look for an 1m IFVG to take buys higher
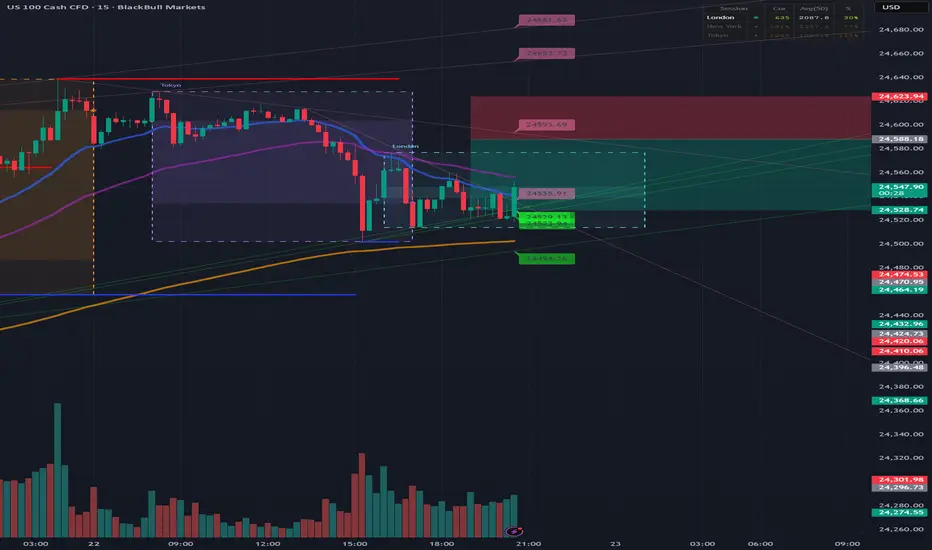
US NAS100Preferably suitable for scalping and accurate as long as you watch carefully the price action with the drawn areas.
With your likes and comments, you give me enough energy to provide the best analysis on an ongoing basis.
And if you needed any analysis that was not on the page, you can ask me with a comment or a personal message.
Enjoy Trading ;)

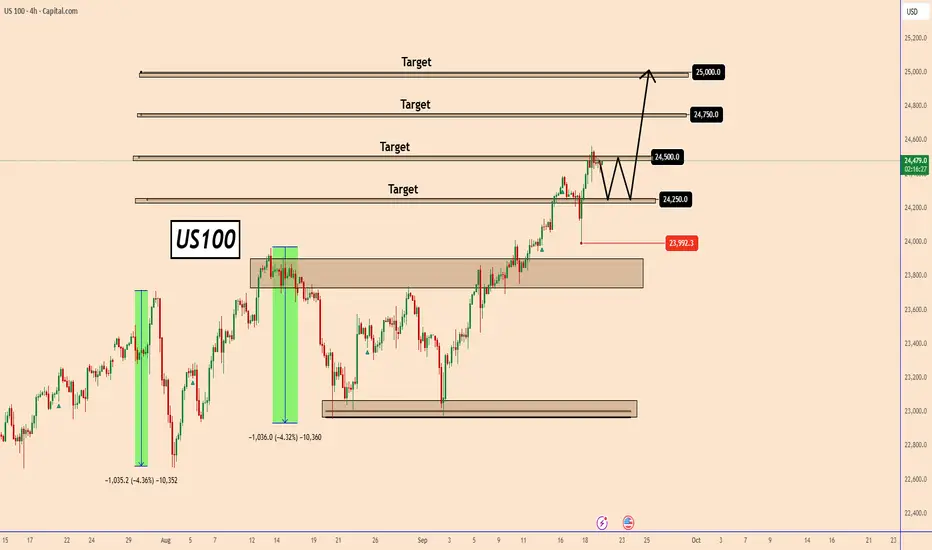
US100 remains in a well-defined uptrendUS100 remains in a well-defined uptrend
After the FOMC cut rates by 25 basis points and also sent a message that two more rate cuts could happen this year, all indices broke out in an uptrend.
US100 felt a surge at 23992 during the FOMC meeting as the market was unclear about what was going on and later rallied again.
Price tested the major support area near 23900 where buyers appeared stronger than before pushing the price higher from where US100 easily reached the first and second targets.
After any small pause, I think US100 can rise further to 24750 and 25000.
You may find more details in the chart!
Thank you and Good Luck!
❤️PS: Please support with a like or comment if you find this analysis useful for your trading day❤️
NAS100 ShortElite Analysis
Price accumulation
Asian liquidity was taken out
Price action in lower time frames read as bearish
Targeting lower liquidity pools

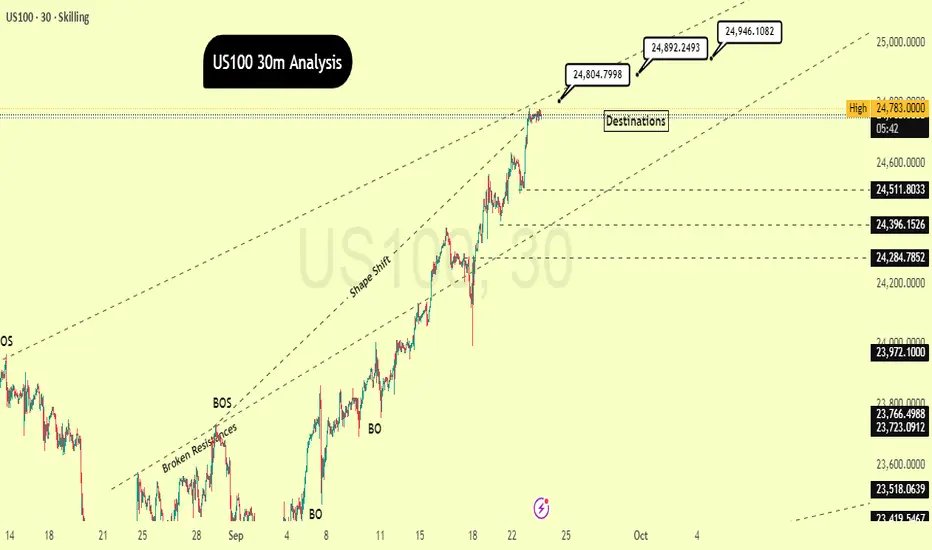
"Reaching Our First Target: What's the Next Step?"By scrutinizing the US100 chart on the30-minutes timeframe, it's evident that the price has initiated a powerful uptrend after surmounting several resistance zones. This is substantiated by the explicit "BOS" (Break of Structure) points, signaling that the market is consistently forging new, higher peaks. The "Shape Shift" noted on the chart indicates a transformation in market character, transitioning from a period of consolidation or a downtrend into a fresh, vigorous bullish impulse.
The price is currently nearing a pivotal resistance point around 24,783.0000. Should the price manage to breach and maintain a position above this threshold, we can anticipate a continuation of the upward trajectory. The prospective targets, labeled as "Destinations," are, 24804.7998, 24,892.2493 and , with an additional high-level objective at 24,946.1082.
I'd appreciate it if you could show your support through likes and comments to encourage me to share more analysis with you, and please share your perspective on the potential direction of this chart with me!
With Respect:
SimarEdgeTrading
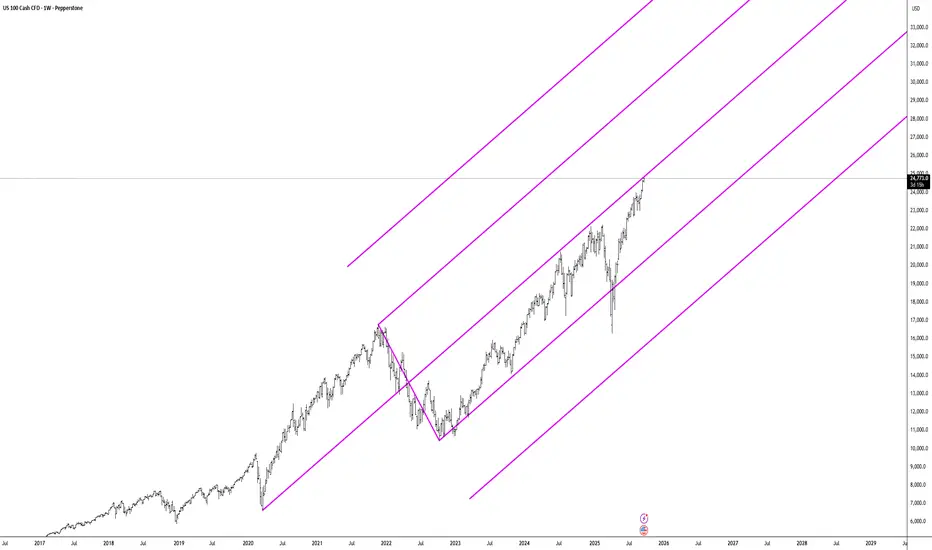
NASDAQ NAS100 Analysis: Three-Drive Pattern, VWAP & Trade Plan📊 The NASDAQ 100 has been riding a strong bullish trend, pushing higher with relentless momentum. On the daily timeframe, price now looks heavily overextended 📈.
🔎 Zooming into the 4-hour chart, the overextension is even more apparent. In trending markets, we often observe a three-drive pattern (sometimes a fourth) before an aggressive correction occurs.
⚡ I’m keeping an eye out for a sharp pullback. If price finds support and confirms with a bullish break of market structure, this could present a high-probability long entry setup 🚀.
📹 In the video, I also dive into how I use the VWAP and Fibonacci retracement tools. Both are powerful indicators that provide valuable insight and a trading edge 🔧.
⚠️ Disclaimer: This analysis is for educational purposes only and not financial advice. Always trade responsibly and manage your risk.

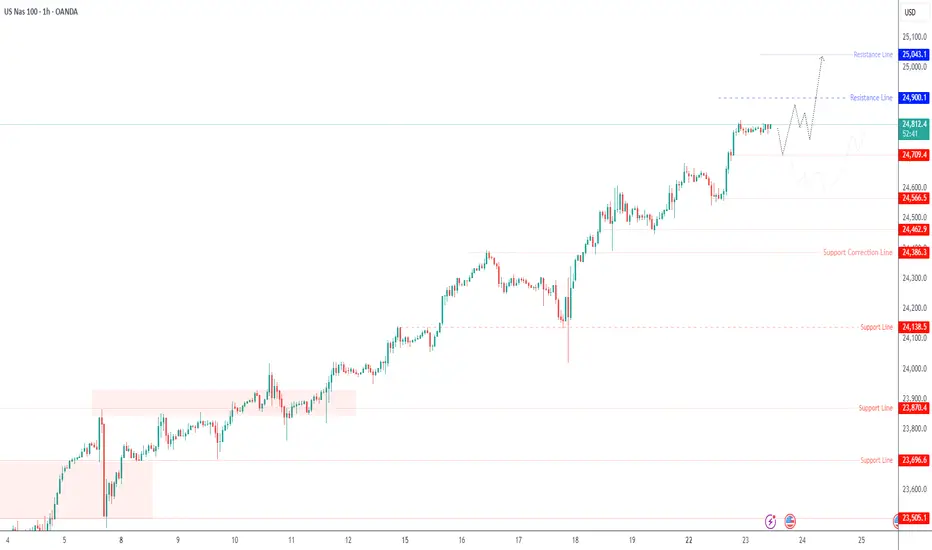
USNAS100 – New All-Time High as Tech Headlines Fuel MomentumUSNAS100 – Overview
The Nasdaq 100 recorded a new all-time high (ATH) near 24,820, extending its bullish run as markets continue to digest upbeat tech headlines.
Investor sentiment remains supported by Nvidia’s plan to invest up to $100 billion in OpenAI, with the first data-center gear expected in 2026, and by anticipation of September flash PMIs, which will test U.S. economic resilience amid tariffs and ongoing Fed commentary.
Bullish Scenario
The index maintains strong bullish momentum while trading above the 24,780 – 24,710 pivot zone.
Targets: A sustained move above current highs could drive price toward 24,900 → 25,045.
An hourly close above 24,900 would reinforce upside momentum, potentially opening the way to fresh highs beyond 25,045 if tech sentiment strengthens.
Bearish Scenario
A confirmed 1H close below 24,710 would signal the start of a corrective move.
Targets: 24,570 → 24,460, with deeper losses possible if profit-taking accelerates after recent ATHs.
Key Levels
Pivot Zone: 24,780 – 24,710
Resistance: 24,900 – 25,045
Support: 24,570 – 24,470

Tech Done?A Lot of rampant speculation is taking place in markets and people seem to think they can't lose - hype is flooding many sectors and valuations are becoming quite unjustified - Looks like we're going to see a decent downturn in the near future.
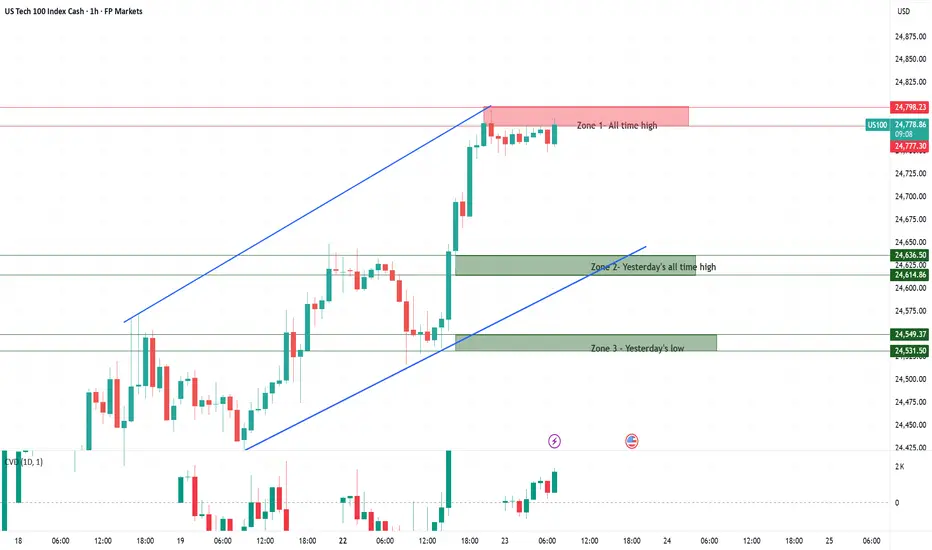
Trading Nas100 at Record Highs The Nasdaq-100 is currently trading at fresh all-time highs, which naturally makes it more difficult to identify strong, well-tested support and resistance levels. With limited historical price action to lean on, these zones should be viewed as guidelines rather than exact buy or sell levels. Traders should remain cautious and flexible in their execution.
Zone 1 – All-time high & yesterday’s high:
This area represents the current record high and the most immediate point of resistance. Price action here is uncharted territory, so reactions can be volatile. A breakout above this zone would confirm continued strength, while rejection could trigger short-term pullbacks.
Zone 2 – Yesterday’s all-time high:
This former high now acts as a potential reference support. If tested, it may attract buyers looking to defend the trend, but given the lack of historical confirmation, reliability remains limited.
Zone 3 – Yesterday’s low:
This marks the lower boundary of recent price action and serves as the next potential support area. If broken decisively, it could indicate fading momentum and open the door for a deeper retracement.
Nas100 is trading near record highs with strong momentum driven by the tech sector, especially AI leaders like Nvidia. The overall sentiment remains bullish, but traders should watch for potential consolidation as the index approaches resistance and technical indicators signal overbought conditions. Regulatory headlines and Fed rate-cut expectations could act as key catalysts for volatility.
USTEC - Trading Edge TodayDear Friends in Trading,
🎯Trading Edge:
Tech leading breakout momentum with institutional accumulation above POC
Key Level: 24,800 (volume gap fill)
Pivot: 24,650 – 24,700
Bias: Bullish above pivot
Bull target: 24,800 → 25,000
Bear target: 24,600 → 24,400
Correlation: +88% with US30, +52% with Gold (Fed trade)
Risk Assets Alignment:
GOLD🔄USTEC🔄US30
✅Gold + USTEC + US30 all bullish above pivots = Fed dovish trade confirmed
✅Unusual Gold/equity positive correlation suggests monetary policy driving both higher
Assets Overbought:
🔴USTEC - 4HR Overbought Divergence Detected
I sincerely hope my point of view offers a valued insight.
Thank you for taking the time study my analysis.

NasdaqNasdaq consolidated another support level at 24740 in today's session. If the price remains above this support, buyers remain in control, and we could reach 25000, an important level that could signal the end of the bullish rally. An H1 candlestick closing above 24800 could confirm continuation.


same stratlooking for first 1m resistance in this order block.
short it back to thsi main support zone