Nas100 market analysis #NAS100 technical analysis. Price has dropped down to our trend line in support levels. Price should continue to go up here back to resistance levels.
NAS100 trade ideas

NAS100 Overextended: Support or Further Downside Ahead?The NAS100 is currently overextended following Friday’s strong rally. From a technical perspective, I’m anticipating a potential retracement toward equilibrium, aligning with the 50% Fibonacci level of the prior price swing. This zone will be key in determining whether price establishes support and resumes its bullish continuation, or if a breakdown occurs that could signal further downside risk. (Not financial advice.)

US100 – Elliott Wave Long-Term Outlook (Monthly)Key Points – US100 (Monthly, Elliott Wave)
🌐 Wave (1): Dot-com bubble peak (2000).
📉 Wave (2): Crash to 2002 lows.
🚀 Wave (3): Massive bull run (2009–2025), +4400%.
⚠️ Wave (4) – Expected Correction:
Possible 70–80% retracement.
Targets: 11,500 → 6,500 → 4,770–4,081.
📈 Wave (5) – Future Projection:
Potential long-term expansion toward 250,000+.
🔑 Levels to Watch:
Current support: 23,400.
Major resistance: 35,300.
Long-term target: 261,800

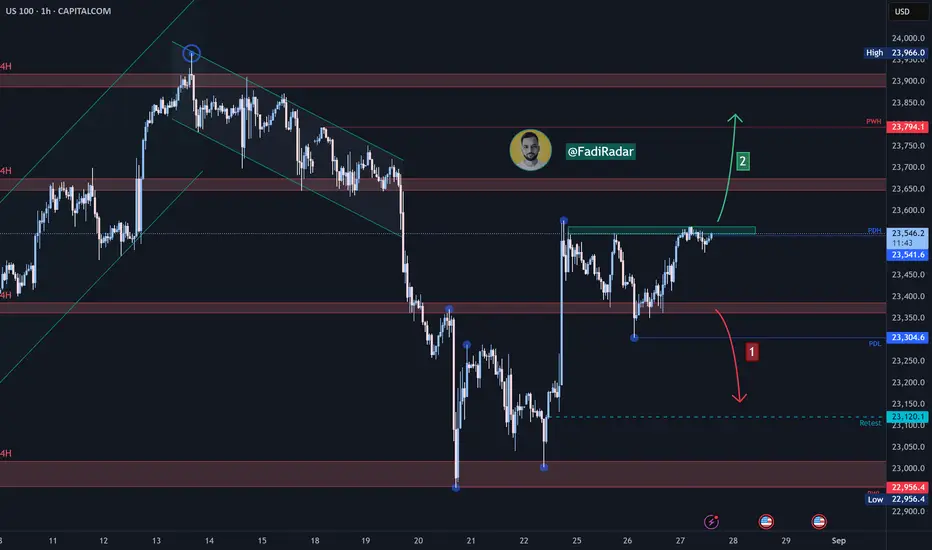
Nas100 Trade Set Up Aug 27 2025FX:NAS100
www.tradingview.com
Price is making HH/HL in the 1h and is currently at a 1H FVG so if price closes above 50% of the FVG i will look for a 1m-2m IFVG to target higher BSL levels but if price closes under 50% of the 1h FVG i will look for sells towards SSL or PDL

Nasdaq to 23,050RECENT TRENDLINE, as you can see, is broken. Next stop is 23,050 to the recent major support, because economy cracks under Trump administration...good luck

Nasdaq 100 Rebounds From Pivot Ahead of Nvidia EarningsUSNAS100 – Overview
Bullish Momentum Ahead of Nvidia Earnings
The Nasdaq 100 reversed from its pivot line and is showing renewed bullish momentum ahead of Nvidia’s earnings — a potential key catalyst for the index.
🔹 Technical Outlook
As long as price trades above 23,525, the bullish trend remains intact, with upside potential toward 23,690 → 23,870.
✅ A confirmed 1H close above 23,690 would strengthen bullish momentum and open the way to higher levels.
⚠️ A 1H close below 23,525 would weaken sentiment, with downside targets at 23,430 → 23,295.
🔹 Key Levels
Pivot: 23,525
Resistance: 23,690 – 23,870
Support: 23,430 – 23,295
✅ Summary:
USNAS100 is holding bullish momentum above the pivot, with Nvidia earnings acting as a major driver. Watch 23,525 as the decision level — staying above supports the bullish case, while a break below shifts focus back to 23,430 and 23,295.

NASDAQ Index Analysis (US100 / NASDAQ)The index is currently trading near the resistance level of 23,550.
🔺 Bullish Scenario:
• A breakout and consolidation above 23,550 may support further upside toward 23,650 as the initial target, with a possible extension to 23,800 if momentum continues.
🔻 Bearish Scenario:
• If the price fails to break and hold above 23,550, it is likely to head towards 23,375, which is considered a potential rebound zone.
NAS100NAS100 is showing strong bullish momentum and is expected to rise, potentially retesting its previous high. Traders should watch for confirmation to align with the upward trend.
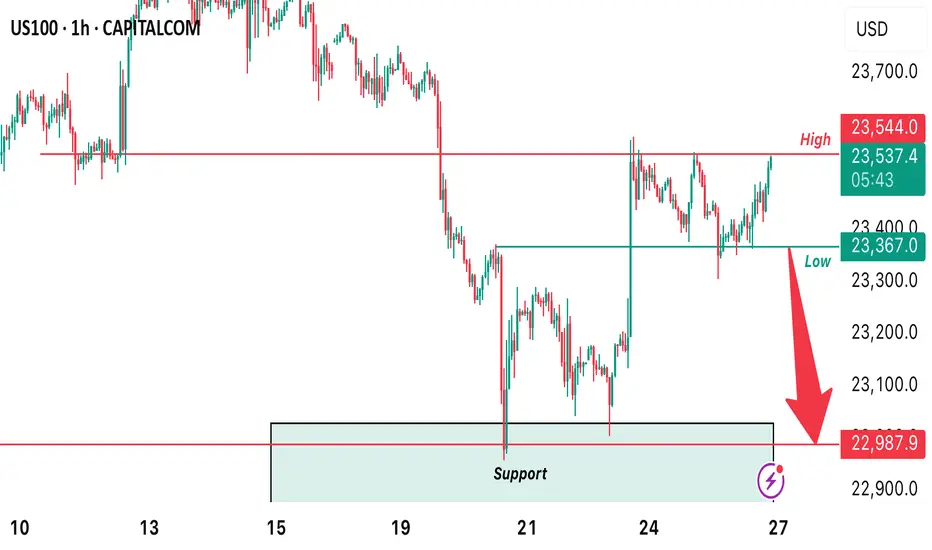
US100 MARKET STRUCTURE - H1 TIMEFRAME We’re still looking forward to seeing price decline further in US100 therefore we’ve market out our major levels of support and resistance in the higher timeframe. From the H1 timeframe , we’re looking for a sell upon price breaking below 23367.0
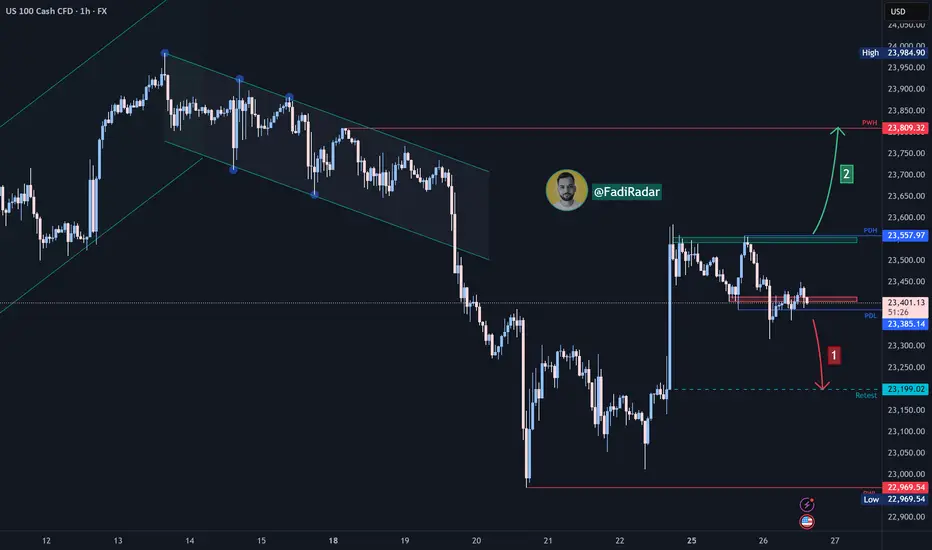
US100 / NASDAQ Technical AnalysisThe Nasdaq index is currently trading near 23,400, heading for a price correction after its recent rally.
🔻 Bearish Scenario:
If the price remains consistently below the 23,400 area, it will likely test the 23,200 level, which is a potential bounce zone.
🔺 Bullish Scenario:
Should a rebound signal appear and the price successfully breaks and holds above 23,560, this could support a continued rally toward 23,800.
A case for a correction of the US100While the long-term trend remains bullish, several short-term factors suggest the index is poised for a significant pullback.
Why the US100 Could Be Bearish
Several key factors point to a potential downturn for the US100 in the coming days:
Elevated Valuations and Overbought Conditions: The US100 has experienced a rapid and significant rally in recent months, fueled largely by the enthusiasm for AI and the "Magnificent 7" tech stocks. This has pushed the index to all-time highs, but it has also led to stretched valuations. Many technical indicators, such as the Relative Strength Index (RSI), show that the index is overbought, indicating that momentum may be running out and a correction is due. 📉
Doubt on a Fed Rate Cut: While recent inflation data showed a slight cooling, some analysts are pushing back against the idea of a certain September rate cut. The core inflation number remains above the Fed's 2% target, and some Fed officials may express a more cautious or "hawkish" stance at this week's Jackson Hole Symposium. A hawkish surprise from the Fed would likely lead to a sharp sell-off in growth stocks, which are sensitive to interest rates.
Geopolitical and Trade Uncertainty: The ongoing trade tensions, particularly with China, continue to create a cloud of uncertainty. While a temporary truce has been announced, any renewed rhetoric or action could trigger a flight to safety, with investors pulling money out of riskier assets like technology stocks.
Slowing Economic Growth: The U.S. economy's underlying health remains a concern. GDP growth in the first half of the year was modest, and the labor market has shown signs of weakening. This economic softness, combined with the potential for tariffs to increase inflation in the second half of the year, could lead to a less optimistic outlook for corporate earnings, especially for multinational tech companies.
Key Technical Levels to Watch
A breakdown of key support and resistance levels can help define the potential bearish path.
Primary Resistance Zone: The immediate overhead resistance is the all-time high zone, which sits between 23,875 and 24,000. A failure to break above this area would confirm a bearish bias.
Immediate Support: The first critical support level is around 23,690. A sustained break below this would likely trigger further selling.
Correction Targets: A deeper correction could see the index fall toward the 23,500 zone, which represents a key technical support level. If that level breaks, the next target for bears would be the 22,800 mark.
In summary, while the long-term trend remains positive, the confluence of high valuations, potential hawkish Fed commentary, and a weakening economic outlook creates a significant risk for a bearish correction in the US100 over the next two weeks.
NAS100 Rejection – Short Setup in PlayAnalysis:
NAS100 rejected from trendline resistance and broke below the rising channel, confirming bearish momentum. The rejection zone aligns with previous supply, and price is now pushing lower.
Resistance held at 23,450 – 23,500
Break below structure adds confluence to bearish bias
Next support area sits around 23,200 – 23,150
Outlook:
As long as price stays under the trendline, sellers have the upper hand. A clean close below 23,200 could open the way for deeper downside.
💬 Do you think NAS100 heads lower or finds support here?

NAS100 Buy Side Trade IdeaI have entered a buy position on NAS100 after a confirmed breakout above the descending trendline resistance. The price is holding above the Alligator moving averages, showing early bullish momentum. RSI is trading above the 60 level, indicating strengthening buying pressure. My entry is aligned with the breakout structure, with stop-loss placed below the recent support level and target positioned at the next resistance zone. This setup offers a favorable risk-to-reward ratio, anticipating a continuation of upward momentum.

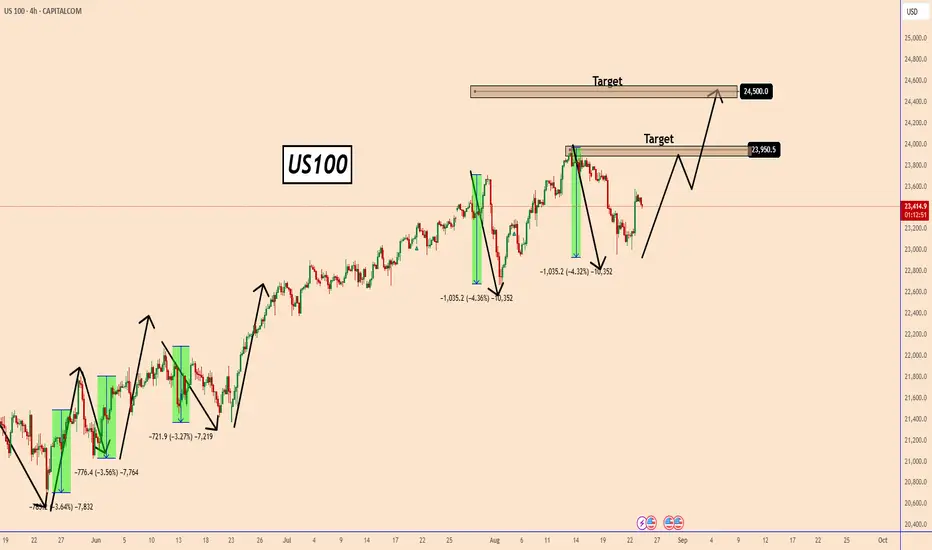
US100: Price Action Analysis Based On Historical MovementsUS100 Price Action Analysis Based On Historical Movements
In recent analysis, we’ve seen the US100 drop multiple times last month by around 3.5% to 4%, but each time it quickly bounced back, showing that these moves were simply buying opportunities during deep pullbacks.
The previous month, the index fell by about 4.3% due to fears over new tariffs on August 1st, but already recovered, which suggests that the bullish trend remains intact.
Last week the price fell again by almost -4.3% and rebounded due to Powell's comment about a possible interest rate cut at the September meeting.
As we can see, this is a recurring price behavior.
If the momentum continues, the US100 could retest the highs near 23,950, and could also rise to 24,500.
You may find more details in the chart!
Thank you and Good Luck!
PS: Please support with a like or comment if you find this analysis useful for your trading day
NASDAQ Can this 1D MA50 rebound be sustainable?Nasdaq (NDX) has been trading within a Channel Up since May 12 and last week made a double rebound very close to its 1D MA50 (blue trend-line). That is technically the latest Higher Low of the pattern and as long as it holds, we should see the new Bullish Leg.
The last two major ones rose by roughly +10% each. Given that the 1D RSI also made a Double Bottom on its Support, we remain bullish on Nasdaq, targeting 24800.
-------------------------------------------------------------------------------
** Please LIKE 👍, FOLLOW ✅, SHARE 🙌 and COMMENT ✍ if you enjoy this idea! Also share your ideas and charts in the comments section below! This is best way to keep it relevant, support us, keep the content here free and allow the idea to reach as many people as possible. **
-------------------------------------------------------------------------------
Disclosure: I am part of Trade Nation's Influencer program and receive a monthly fee for using their TradingView charts in my analysis.
💸💸💸💸💸💸
👇 👇 👇 👇 👇 👇

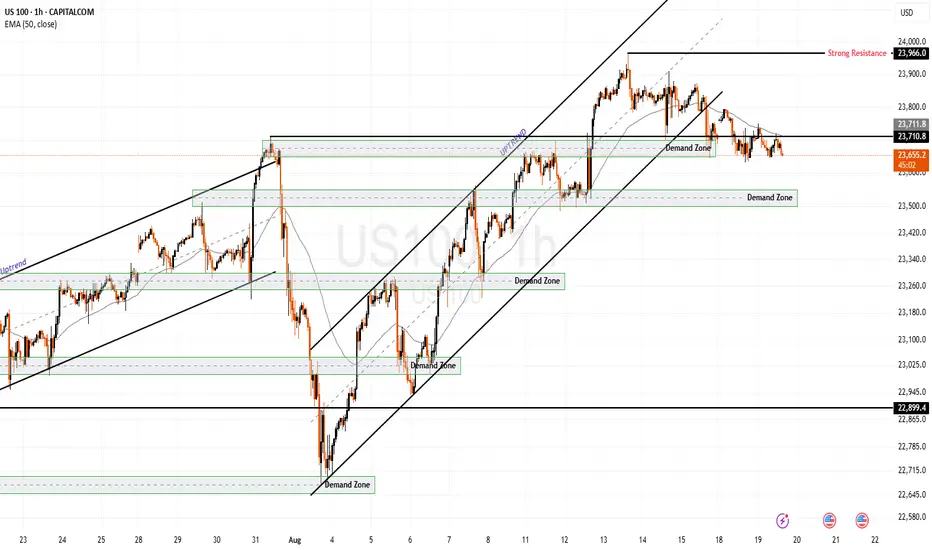
NAS100 - Where will the stock market ?!The index is above the EMA200 and EMA50 on the four-hour timeframe and has re-entered its ascending channel. If this channel is maintained, its upward path to the specified price target will be possible, but before that, the downward trend line must be broken in a valid way. If the channel is lost, the index's downward path will continue to around 23,000 points.
Federal Reserve Chair Jerome Powell’s latest remarks, delivered in a dovish tone, boosted bullish sentiment in financial markets and sparked a new wave of optimism among Wall Street investors and market participants. Following Powell’s speech, U.S. stock benchmarks surged sharply, with capital flows notably directed into the Russell 2000 index of small-cap companies, which jumped 3.86%—its strongest gain since April 9.
During his keynote at the Federal Reserve’s annual symposium, Powell implicitly suggested that an interest rate cut could come as soon as next month. At the same time, he warned of rising inflation risks and signs of slower economic growth, stressing that although risks are relatively balanced, the current environment may require an adjustment in monetary policy. He stated: “Given that monetary policy remains in a restrictive stance, the baseline outlook and the shifting balance of risks may warrant a reassessment of our policy stance.”
Naeem Aslam, chief investment strategist at Zaye Capital Markets, described Powell’s comments as a turning point for markets, saying: “Powell’s dovish tone came as a real surprise to many market participants who did not expect such an approach from the Fed Chair. His remarks were clearly interpreted as a dovish signal.”
Following Powell’s comments, traders raised their expectations for a September rate cut. Barclays revised its forecast and now expects the Federal Reserve to deliver two 25-basis-point cuts this year—in September and December.
Meanwhile, Fitch Ratings affirmed the U.S. sovereign credit rating at AA+ with a stable outlook, a decision made despite significant political uncertainty. According to Fitch, rising trade tariffs, government spending cuts, stricter border controls, and increased deportations have heightened policy uncertainty, weighing on household consumption and business investment.
Fitch projects that the U.S. economy will remain in recession in 2026, growing only 1.5%, as elevated inflation and policy uncertainty continue to dampen consumer spending. However, the agency expects that faster rate cuts that year could boost domestic demand, helping growth rebound to 2.1% in 2027.
This week, two key reports are in focus: the second estimate of Q2 GDP and July’s Personal Consumption Expenditures (PCE) Price Index. The initial GDP estimate showed a 3% expansion, and consensus forecasts anticipate confirmation of this figure. In contrast, the Atlanta Fed’s GDPNow model projects a 2.3% growth rate, which, while lower, still points to economic resilience and suggests no urgent need for accelerated rate cuts—even as political pressure from the White House on Powell continues. Notably, GDPNow will be revised on Tuesday ahead of the official release.
Inflation data, however, carry greater weight. The core PCE index, the Fed’s preferred inflation gauge, has closely tracked core CPI for the past decade. With July’s core CPI climbing from 2.9% to 3.1%, there is a risk that PCE will follow the same path. Such a scenario would signal persistent inflationary pressures and significantly reduce the likelihood of a second rate cut this year.
If these data confirm stronger inflation, the U.S. dollar will likely strengthen further, while equities could come under additional pressure. A slower pace of monetary easing diminishes the present value of future cash flows for growth-oriented companies, explaining why Wall Street’s corrective phase may persist.
On the corporate front, Nvidia’s CEO said that the ability to ship its H20 chip to China is highly valuable and poses no national security concerns. He added that the decision to supply a next-generation AI data center chip to China, which will succeed the H20, is not within Nvidia’s direct control. The company is set to report earnings on Wednesday and remains in discussions with the U.S. government, though no resolution has yet been reached. The CEO also mentioned that his brief visit to Taiwan would mainly involve a dinner with TSMC executives. He revealed TSMC’s new “Rubin” architecture, comprising six new chips, and announced that Nvidia will hold its GTC conference in Washington, D.C. for the first time.
Separately, Meta has halted AI hiring after onboarding more than 50 specialists with lucrative compensation packages. The freeze affects both new hires and internal transfers, unless personally approved by Alexander Wang, head of AI. In recent months, Meta has reorganized its AI division into four separate teams to advance its “superintelligence” projects. Analysts have warned about rising costs and equity grants, framing the hiring pause as part of broader budget control and organizational restructuring efforts.

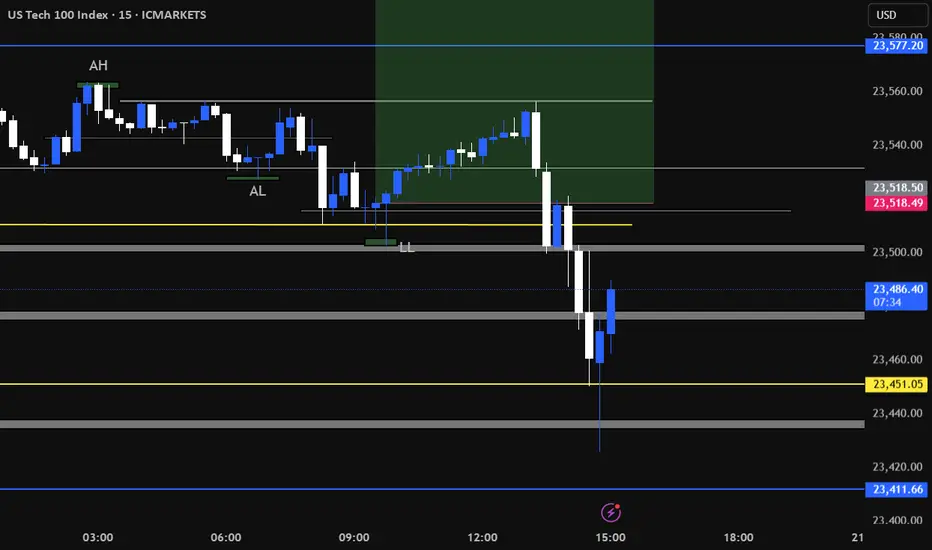
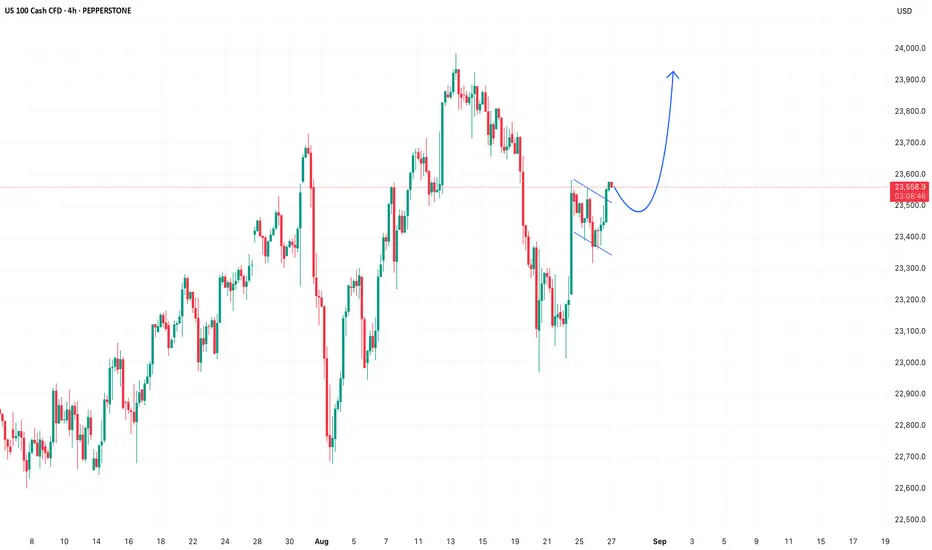
NASDAQ Outlook – New York SessionFriday's news pushed the market strongly upward, shifting momentum from the bears to the bulls. This week, price action is setting up for continuation.
On the chart, we can see a classic bull flag pattern forming. I expect price to dip into the fair value gap, retracing no more than 50%, before resuming its upward movement during the New York session.
Bias: Bullish
Plan: Look for long opportunities after a clean retrace and confirmation during NY Open.

SELL NAS100Nasdaq-100 (NAS100) is showing signs of weakness, targeting a move down to 23,175.7. The market favors sellers below recent resistance, so maintain a short bias. Place stops above the latest swing high to manage risk.


` BEARSH NASDAQ 1Hbearish until it takes out the liquidity below cuz it took the high liquidity out so now we target the low

QQQ Concentration RiskSince mid-2023, the gap has steadily widened - it doesn’t mean an immediate reversal, but it does mean QQQ is very top-heavy (the NDX/NDXE ratio tends to oscillate in bands; rather than, trend infinitely higher)
Strong NDX vs weak NDXE suggests a fragile rally
If mega-caps stumble, the whole index could pull back hard
However, if breadth improves (NDXE starts outperforming), that would strengthen the rally base
Current leadership concentration favors short-term bullish momentum (45%), but the rally is fragile, if mega-caps falter, the downside could open quickly (30%)
1. FAANG + NVDA/TSLA Leadership Persists
Ratio keeps rising (NDX > NDXE)
Leaders continue to attract flows (AI, cloud, semis).
QQQ pushes to new highs with narrower breadth
Rally vulnerable if just one or two leaders stumble (NVDA, AAPL, etc.)
+5–10% upside near term if momentum holds
2. Pause & Rotation (25%)
Ratio stalls near highs
Equal-weight (NDXE) starts to catch up
Breadth improves modestly, but QQQ as a whole chops sideways
QQQ consolidates in a 5%–7% band
3. Breadth Divergence Resolves Lower (30%)
Concentration risk unwinds
Leaders mean-revert (profit-taking, earnings disappointments)
NDX underperforms NDXE, ratio falls from highs
QQQ could correct −10% or more
The ratio at 2.88 is stretched relative to historical balance
A “reasonable” medium-term range would be closer to 2.3–2.5 (15% to 25% on percentage scale)
Implies QQQ pause/correction while NDXE holds steady or outperforms, or broadening participation (small/mid Nasdaq catching up)

