US Dollar Index (DXY) – Institutional Structural OutlookMacro Context
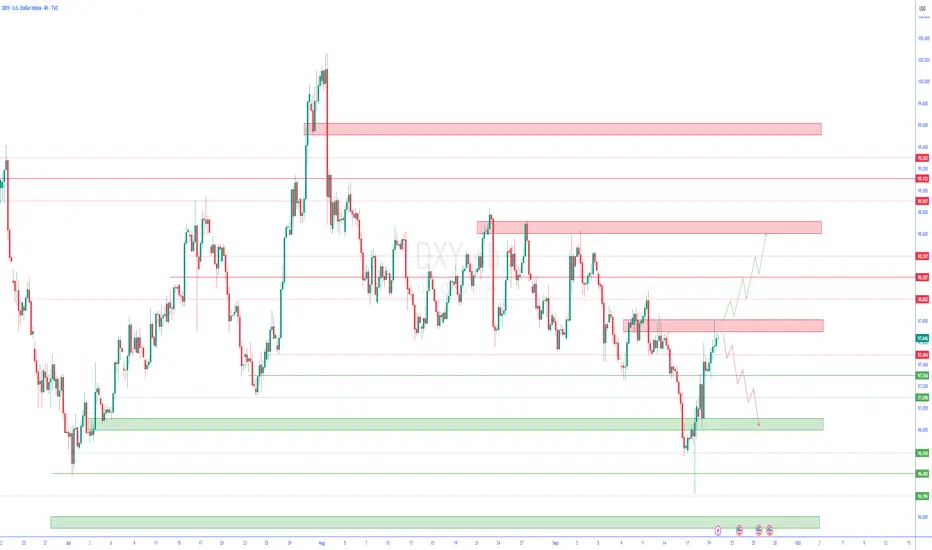
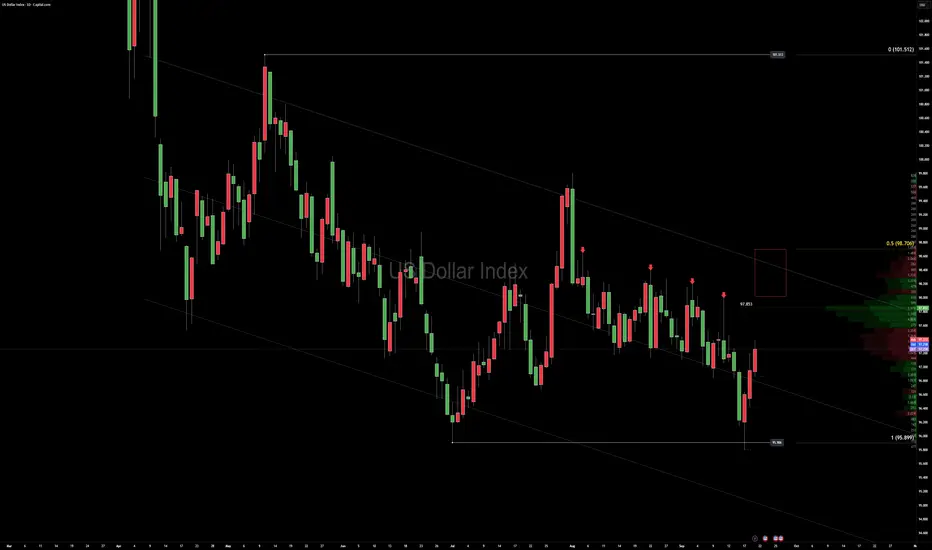
The Dollar Index is currently holding within a weekly demand zone after a prolonged distributive phase. The market is evaluating whether this region will act as a structural accumulation base or if deeper liquidity levels will be tested. Confirmation from COT reports will be crucial to validate institutional positioning.
Technical Structure
Breakout & Acceptance: The last major breakout is still respected, with price now consolidating above demand.
Demand Layers: Three clear demand zones are mapped:
Current Demand – where the market is attempting to accumulate.
Deep Discount Demand – a deeper structural level where liquidity could be absorbed if the first zone fails.
Extreme Deep Discount Demand – ultimate defensive layer, aligned with long-term rebalancing.
Accumulation: Price is building a smaller accumulation range, signaling potential preparation for an institutional move.
Projected Scenarios
Primary Bias (Accumulation/Long): If confirmed by COT, current accumulation may trigger a structural recovery of the Dollar, strengthening against weaker counterparts (AUD, NZD).
Invalidation: A clean break below the current demand would open the path towards deeper demand zones, reframing the context as continuation of distribution.
Confirmation & Monitoring
COT Reports: Weekly positioning will confirm whether institutional players are indeed accumulating or still unwinding Dollar exposure.
Volatility Index (VIX + EVZ): As timing filters for breakout confirmation.
Macro Drivers: Next Fed communications and global liquidity flows remain critical catalysts.
⚖️ Institutional Note: The DXY is at a decision point – smaller accumulation is visible, but validation from institutional flows (COT) is essential before considering a structural recovery.
USDX trade ideas

DXYU.S Dollar Index
- Falling Wedge as an corrective pattern in Short Time Frame
- RSI - Divergence
- Completed " 1234 " Impulsive Waves
- Fibonacci Level - 38.20% - 50.00%
- S / R Level

MY VIEW ON THE DXY - 22 / 26 SEPTEMBER 2025Last week we saw the Index testing a new low, continuing its downward trend, cause by the Feds cutting interest rates.
On the major frames the Index is in fact bearish unless we have a clear move above 101.400.
This week I expect a pullback to the 98.300 - 98.750 critical area of resistance by Tuesday, Powell speech could push the index up to 101.050 - 101.350 or down to new lows in the 96.000 - 95.220 area of support.


DXYDXY Bullish Bias
Buyers have stepped in, absorbing all selling pressure, pushing price higher. Watch for continuation as momentum favors bulls.
Key Notes:
Price cleared previous resistance levels.
Bullish momentum confirmed by strong candle closes.
Look for pullbacks to support for potential entries.

dxy 4hTrading Perspectives for the Upcoming Week
In this series of analyses, we have reviewed short-term trading perspectives and outlooks.
As can be seen, in each analysis there is a significant support/resistance zone near the current asset price. The market’s reaction to or break of this level will determine the future price trend up to the next specified levels.
Important Note: The purpose of these trading perspectives is to examine key price levels and the market’s potential reactions to them. The analyses provided are by no means trading signals!
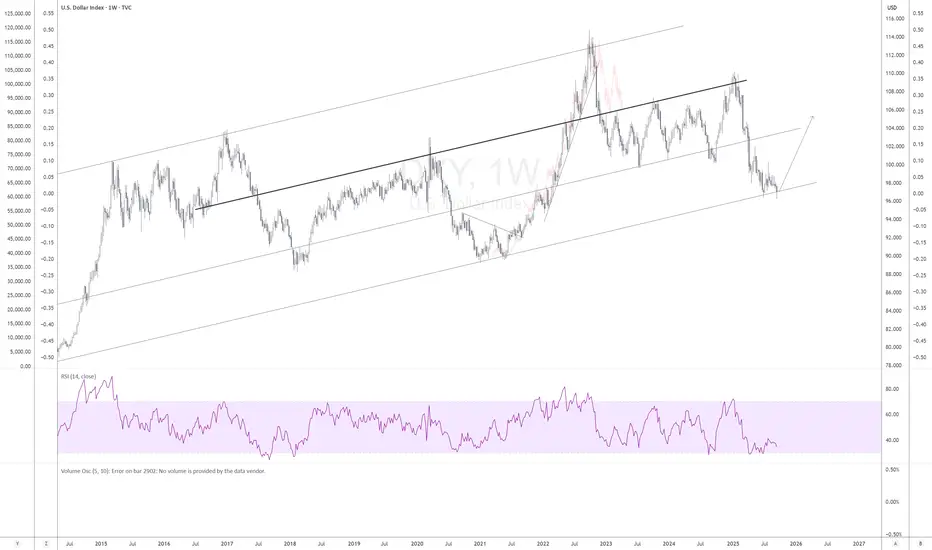
DXY Geometric upsideWith the use of Andrew's pitchfork and Gann fan, the pico bottom was preddicted. Both of these tools are overlooked by modern TA.
The bottom is in on the dollar basket for now. 109 is the upside projection which should be delivered at speed.

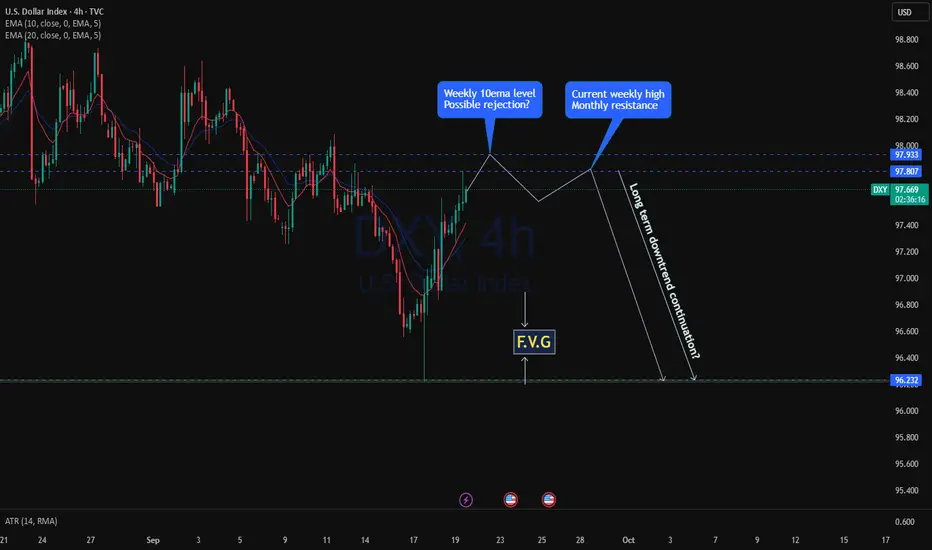
DXY is setting for another dropPre FOMC move on DXY bearish as with 0.25% to 0.5% rate cut decision as significantly impacted dollar index which on press conference, price finally rejected from the lower level 96.20
As with the weekly close coming in few hours, price approaching another key level of resistance, weekly and monthly giving a high probablity to reject back again to the support level as the resistance consist of 3 higher timeframe confulences, monty and weekly resistance alogn with weekly 10ema combining with break of series of lower highs and break of the combinations could lead the price to drop to the support. at 96.20
What Was Important for the US Dollar Index (DXY) This WeekWhat Was Important for the US Dollar Index (DXY) This Week
The long-awaited event — the Fed’s first rate cut of 2025 — has taken place. What is particularly important to note is the price action on the US Dollar Index (DXY) chart.
The value of the USD against a basket of other currencies made a two-step move, forming a pin-bar candle with a long lower shadow:
→ Arrow 1: When the Fed actually announced the easing, the dollar weakened as expected on this “dovish news.”
→ Arrow 2: But at the subsequent press conference, Fed Chair Jerome Powell delivered a series of “hawkish” remarks that shifted the market mood and drove the dollar higher. He stressed that this cut does not mark the beginning of “a series of continuous rate reductions,” and that further decisions will be taken “based on incoming economic data.”
Powell also stated plainly that the option of a more aggressive 50-basis-point cut had not gained sufficient support among FOMC members. Therefore, the “down-then-up” move highlights a sharp change in trader sentiment within a short timeframe, as expectations failed to materialise.
Technical Analysis of the DXY Chart
In our 9 September analysis, we confirmed the relevance of:
→ the descending channel (shown in red) defined by a sequence of lower highs and lower lows;
→ the intermediate QL and QH lines, which divide the channel into quarters.
Notably, at Wednesday’s low the price:
→ touched the QL line, underscoring its strength;
→ formed a clear Liquidity Grab pattern (in the terminology of the Smart Money Concept methodology).
From the perspective of Richard Wyckoff’s method, Wednesday’s low may be viewed as a Spring pattern, which preceded a Mark-Up phase of rising prices.
How Might Events Unfold Next?
Given the above, we could assume that the hawkish tone could serve as a longer-term factor for the DXY index. The 97.55 level appears to act as resistance, but it is possible that we may see an attempt to break through it, with the next target being the QH line.
This article represents the opinion of the Companies operating under the FXOpen brand only. It is not to be construed as an offer, solicitation, or recommendation with respect to products and services provided by the Companies operating under the FXOpen brand, nor is it to be considered financial advice.
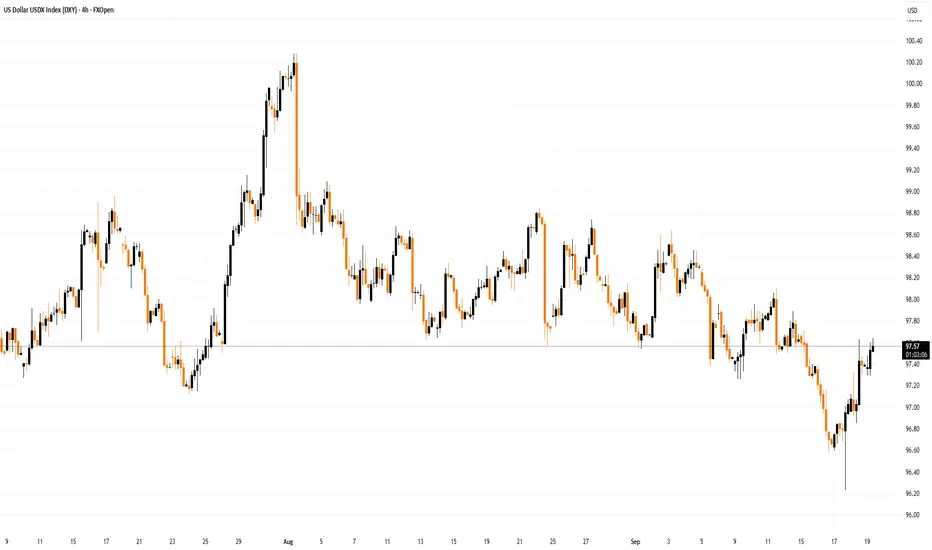
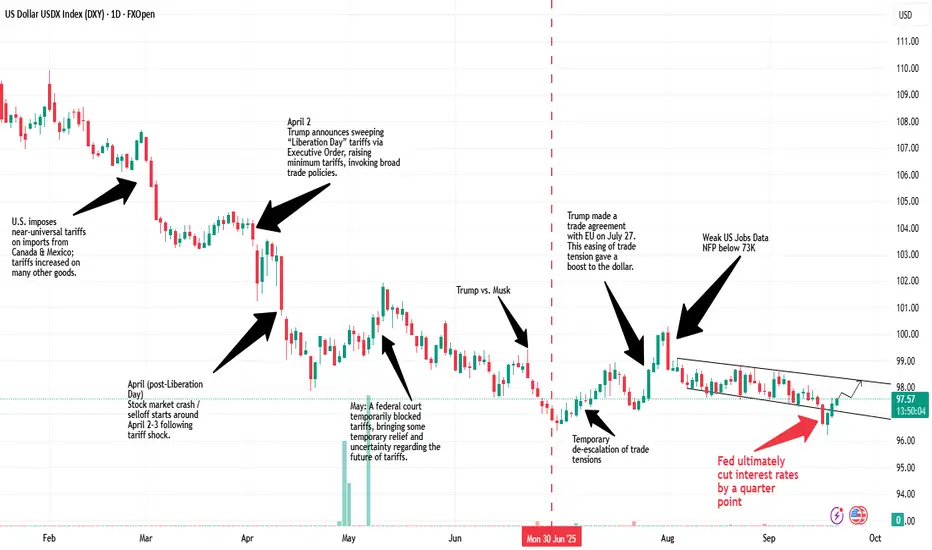
US Dollar Timeline: How Dollar is getting Destroyed Gradually The US Dollar Timeline: 2025
- The Dollar Index (DXY) has consistently weakened this year
- It fell more than 12.5% from the tops of 110 (Jan 2025) to the bottoms of 96.20, tested recently after Fed rate cuts.
Dollar Weekly WrapThe dollar ripped to fresh lows early in the week on the FOMC spark and is now set to close with a heavy bearish rejection candle.
Next week’s macro stack:
Tue – U.S. PMI flash
Thu – Q2 GDP final and Durable Goods
Fri – Personal Income/Spending and PCE
Price sits just below a five-week liquidity shelf around the 98.00 area.
Technically the market is oversold near the lower range, so high probability to target next week 98ich highs and lower on cross pairs. lets see how it will play out!

US DOLLAR War Map stays simple right nowThe dollar’s been sliding for months, but we finally saw the range lows taken out after the FOMC spike, and that sets up the next move.
Here’s how I’m reading it:
Rotation lower is still the logical path unless politics or surprise news change the game.
On the DXY chart, I’m watching for a heavy-volume node to act as a target for a short-term pullback higher.
For cross-pairs, that means I’ll look for short setups while using the recent bullish dollar lows as day-to-day reference points.
Key level to watch: around 98.7, where heavy bearish order-flow has been building.
If the market keeps moving, it’s a straightforward trade plan: stay positive, take intraday signals, and let the bigger down-cycle play out.

DXY bottom in sightThe short DXY trade is so crowed right now a bottom should be forming soon. 99% of people expect the $$ to keep plunging in the coming quarters. It won't. Good times to hedge your bets if you're on the consensus train
The Dollar Index situation in the past weekThere’s no doubt that the Dollar Index is still in a downtrend. During this decline — while moving inside a channel — it managed, thanks to the news, to break the channel’s ceiling with relatively weak momentum. The probability of a pullback to the channel’s ceiling or even a return inside the channel is high because the momentum is weak. In any case, we’ll have to see how the dollar starts the coming week. ✅

DXY (LONG)
After Fomc seeing Dollar bulls across all pairs and dollar is sitting on Pivots support Level
correlating with GOLD AND GBPUSD Sitting on Pivot resstance Levels.

DXY (US Dollar Index) AnalysisPrice is currently trading near 97.60 – 97.90, which is a strong resistance zone.
I’ll be waiting for bearish confirmation here before expecting downside momentum.
🔻 If sellers hold this level, we could see DXY drop further, aligning with bearish pressure on USD across correlated pairs (EURUSD bullish, GBPUSD bullish, Gold bullish).
Key Levels:
🔴 Resistance: 97.60 / 97.90
🟢 Target Zone: 95.00
📌 Trading Plan:
Wait for rejection at 97.60 – 97.90 before entering.
Look for sell setups targeting 95.00.
Correlation: Bearish DXY supports bullish momentum in major USD pairs.
⚠️ Risk management is key. Always wait for confirmation before taking positions.

DOLLAR DOLLAR holding daily retest demand floor waiting FOMC outcome. The market will be surprised that fed might keep rate the same dont expect rate cut.
how ever i dont care about the FOMC policy outcome


DOLLARDOLLAR AT 96267 rebound ,uncertainty in the market rate hike or cut.
united state dollar remains a key market driver and we have seen eurusd ,audusd gbpusd and gold reverse on dollar day support floor buy opportunity.
#dollar #dxy

Dollar Bloodbath = Risk On Assets Rally?Dollar Fundamentals:
The dollar posted modest gains on Friday due to higher T-note yields, which have strengthened the dollar’s interest rate differentials.
The University of Michigan US Sep consumer sentiment index fell more than expected to a 4-month low causing the weakening of the dollar.
Limiting the upside in the dollar are the increased expectations for Fed easing through year-end. The dollar is also being undercut by concerns over Fed independence, which could prompt foreign investors to dump dollar assets as President Trump attempts to fire Fed Governor Cook, and by Stephen Miran’s intention to be a Fed Governor.
What Can We Expect Going Forward?
- Due To High Resistance Over Multiple Weeks, There Will Be Massive Levels Volatility, Aiming To Trap The Retail Traders
- Next Week Wednesday Will Determine How Volatile Dollar Will Be. Anything More Than A .25 Basis Point Decline Will Cause Turmoil For Dollar.
- This Will Lead Risk-On Assets (e.g. GBPUSD, EURUSD, AUDUSD) Rallying Up Into Premium Arrays
Prices To Keep An Eye On:
- 99.078 (Last Line Of Defence)
- 96.377 Major Sellside Liquidity
- Medium-Term Draw To 95.716 - 94.313 HTF Array
GBPUSD
Fundamentals :
UK gross domestic product remained unchanged in July after growing 0.4% in June, the Office for National Statistics said, as manufacturing output, which makes up 9% of the economy, dropped by 1.3% on the month.
The BoE is widely expected to keep its benchmark Bank Rate unchanged on September 18, after a split decision to lower the rate to 4% in August.
What To Expect Going Into Next Week?
- Increased Volatility
- Trigger HTF Stop Losses
- Unusually High Levels Of Manipulation
Price Points To Keep A Eye On:
- 1.35950 Buyside Liquidity
- 1.36760 - 1.37036 Longer Term Premium Array
- 1.34458 Mean Threshold (Last Line Of Defence)

USD Index Technical Outlook – Key Buy & Sell LevelsThe U.S. Dollar Index (DXY) is currently trading inside a clear downward channel, showing a bearish market structure. Price is hovering near 98.23, just below the key resistance zone between 98.5 – 99.2, where Fibonacci retracement levels (0.382, 0.5, and 0.618) also align, making it a strong supply area. As long as price remains below this zone, the bias stays bearish, with potential downside targets at 97.5 and then 96.5, in line with the channel support and Fibonacci extensions. However, if buyers manage to push above 99.2, it would signal a possible trend reversal and shift the outlook towards bullish continuation. Overall, the structure suggests that the U.S. Dollar Index is more likely to face rejection near resistance and continue lower in the short term.
🔴 Sell Zone (Short Setup)
- 98.50 – 99.20 is a strong resistance area where price aligns with the Fibonacci retracement (0.382 – 0.618) and the upper channel trendline.
- Sell Trigger: If price shows rejection (bearish candles, wicks, or reversal patterns) within this zone.
🟢 Buy Zone (Long Setup)
- 97.50 – 96.50 area is the channel support and also near Fibonacci extension levels.
- Buy Trigger: Look for bullish confirmation (bounce, bullish engulfing, or rejection wicks).
Note
Please risk management in trading is a Key so use your money accordingly. If you like the idea then please like and boost. Thank you and Good Luck!

