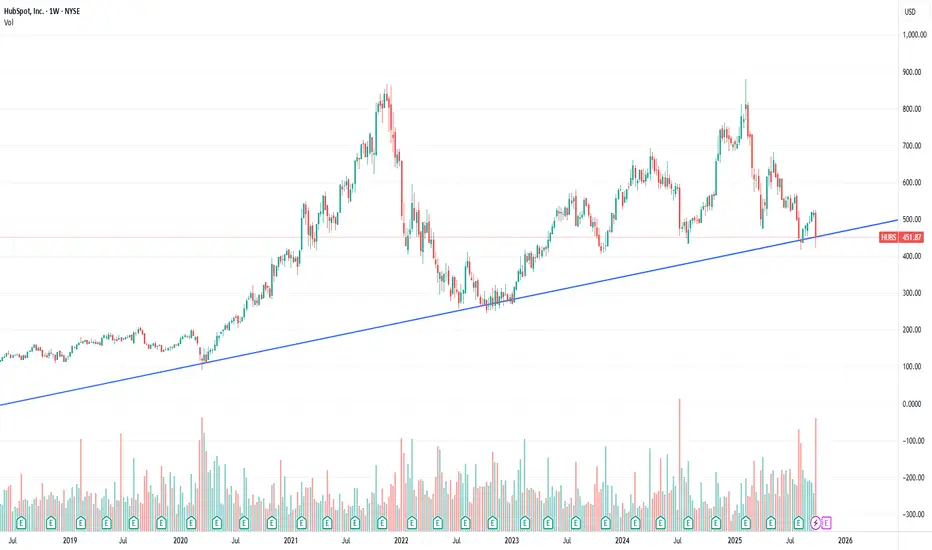
HUBS bounced up from the multi-year uptrend supportHUBS under pressure from recent OpenAI SaaS rollout. Giving a nice opening for entry.
Next report date
—
Report period
—
EPS estimate
—
Revenue estimate
—
−0.2 EUR
4.47 M EUR
2.54 B EUR
50.70 M
About HubSpot, Inc.
Sector
Industry
CEO
Yamini Rangan
Website
Headquarters
Cambridge
Founded
2005
ISIN
US4435731009
FIGI
BBG0078X8HX1
HubSpot, Inc. engages in cloud-based customer relationship management. Its platform includes marketing, sales, service, operations and content management system, as well as other tools, integrations and native payment solutions. It operates through the following geographical segments: Americas, Europe and Asia Pacific. The company was founded by Brian Patrick Halligan and Dharmesh Shah on April 4, 2005, and is headquartered in Cambridge, MA.
Related stocks
$HUBS Basing / Ready for Next Move Higher?I traded this stock last year and made good $$$. I think it may be time for it to make another run. I had set an alert to see if it would get up and over the 21 EMA. That triggered today. Based on that, I have opened a ¼ size position, not much, but enough to make me keep my eyes on it. I also have

HubSpot ($HUBS) – Bearish Liquidity Sweep or Reversal Base?After a steep correction, NYSE:HUBS has tapped into a high-volume demand zone near $527–$540. Price is hovering just above the 0.786 Fib retracement, following a failed bullish CHoCH and return to lower structure. The current move suggests either a temporary relief rally or a setup for deeper disc

HUBS to $760My trading plan is very simple.
I buy or sell when price tags the top or bottom of parallel channels.
I confirm when price hits Fibonacci levels.
So...
Here's why I'm picking this symbol to do the thing.
Price at top of channels (period 100 52 & 26)
Stochastic Momentum Index (SMI) at overboug
HUBS: Monthly Candle w/ volumeTechnicals:
Diagonal trendline support
Dragonfly doji at 78.2% fib support and horizontal support with d3 volume
Weekly cup-with-handle pattern
Good buy before elections

HUBS: Double Cup & Handle Breakout Targets 58% and 64%HubSpot ( NYSE:HUBS ) is making waves with two powerful Cup & Handle patterns on the daily chart:
1️⃣ First target: 58% upside to $1,143.48.
2️⃣ Second target: 64% upside to $942.09.
🔹 Critical support at $693.85 (a must-hold level for bulls).
🔹 Recent breakout confirms bullish momentum.
🔹 The gap

SMCI, HUBS and META Bottom Buying Opportunities Q4'2024SMCI, HUBS and META are bottom buying Opportunities in Q4'2024 before the US elections.
This video covers three stocks such as SMCI from a technical perspective with a hint of fundamental and thematic thought process. SMCI (or Super Mico Computer) is a US company that makes super powerful computer

HUBS bear flagging here After a big drop from the peak and trend line break, a beautiful bear flag here.
If this breaks 425 , we can see 350 quick.
Target 350
Stop loss - 500

HubSpot (NYSE: HUBS) Stock Price & AnalysisWithin A 100K Account Balance The Split On Trade & Risk Management = 1/10% - 1/20% Margin As An Execution Range, To Set Up An Order Entry And Select A Per Trade-On-Average, To Avoid Any Drawdown Hit Regarding To Stop Loss & To Execute Risk On Management Specifics. Trail Stop Efforts Are A Focus Of A

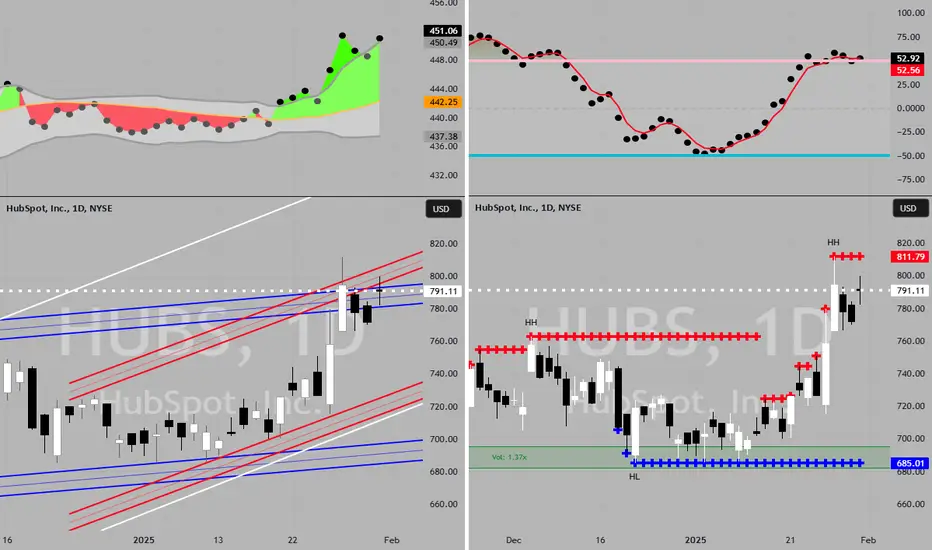
HUBS undecidedHUBS has broken its long term bullish channel and now it has earnings on 31 July
This can either push HUBS back to the bullish channel or can further push down the stock to the next strong support of 400 .
The stock movement is currently in a bear trend so until there is a bullish reversal confi

See all ideas
Summarizing what the indicators are suggesting.
Neutral
SellBuy
Strong sellStrong buy
Strong sellSellNeutralBuyStrong buy
Neutral
SellBuy
Strong sellStrong buy
Strong sellSellNeutralBuyStrong buy
Neutral
SellBuy
Strong sellStrong buy
Strong sellSellNeutralBuyStrong buy
An aggregate view of professional's ratings.
Neutral
SellBuy
Strong sellStrong buy
Strong sellSellNeutralBuyStrong buy
Neutral
SellBuy
Strong sellStrong buy
Strong sellSellNeutralBuyStrong buy
Neutral
SellBuy
Strong sellStrong buy
Strong sellSellNeutralBuyStrong buy
Displays a symbol's price movements over previous years to identify recurring trends.
Curated watchlists where 096 is featured.

Software stocks: US companies at our finger tips
49 No. of Symbols
See all sparks
Frequently Asked Questions
The current price of 096 is 403.7 EUR — it has decreased by −0.27% in the past 24 hours. Watch HubSpot, Inc. stock price performance more closely on the chart.
Depending on the exchange, the stock ticker may vary. For instance, on FWB exchange HubSpot, Inc. stocks are traded under the ticker 096.
096 stock has risen by 4.64% compared to the previous week, the month change is a −6.49% fall, over the last year HubSpot, Inc. has showed a −22.78% decrease.
We've gathered analysts' opinions on HubSpot, Inc. future price: according to them, 096 price has a max estimate of 774.76 EUR and a min estimate of 473.46 EUR. Watch 096 chart and read a more detailed HubSpot, Inc. stock forecast: see what analysts think of HubSpot, Inc. and suggest that you do with its stocks.
096 stock is 0.27% volatile and has beta coefficient of 1.64. Track HubSpot, Inc. stock price on the chart and check out the list of the most volatile stocks — is HubSpot, Inc. there?
Today HubSpot, Inc. has the market capitalization of 21.36 B, it has increased by 7.68% over the last week.
Yes, you can track HubSpot, Inc. financials in yearly and quarterly reports right on TradingView.
HubSpot, Inc. is going to release the next earnings report on Nov 5, 2025. Keep track of upcoming events with our Earnings Calendar.
096 earnings for the last quarter are 1.86 EUR per share, whereas the estimation was 1.80 EUR resulting in a 3.13% surprise. The estimated earnings for the next quarter are 2.20 EUR per share. See more details about HubSpot, Inc. earnings.
HubSpot, Inc. revenue for the last quarter amounts to 645.90 M EUR, despite the estimated figure of 628.07 M EUR. In the next quarter, revenue is expected to reach 670.64 M EUR.
096 net income for the last quarter is −2.77 M EUR, while the quarter before that showed −20.14 M EUR of net income which accounts for 86.27% change. Track more HubSpot, Inc. financial stats to get the full picture.
No, 096 doesn't pay any dividends to its shareholders. But don't worry, we've prepared a list of high-dividend stocks for you.
As of Oct 28, 2025, the company has 8.25 K employees. See our rating of the largest employees — is HubSpot, Inc. on this list?
EBITDA measures a company's operating performance, its growth signifies an improvement in the efficiency of a company. HubSpot, Inc. EBITDA is 54.47 M EUR, and current EBITDA margin is 1.90%. See more stats in HubSpot, Inc. financial statements.
Like other stocks, 096 shares are traded on stock exchanges, e.g. Nasdaq, Nyse, Euronext, and the easiest way to buy them is through an online stock broker. To do this, you need to open an account and follow a broker's procedures, then start trading. You can trade HubSpot, Inc. stock right from TradingView charts — choose your broker and connect to your account.
Investing in stocks requires a comprehensive research: you should carefully study all the available data, e.g. company's financials, related news, and its technical analysis. So HubSpot, Inc. technincal analysis shows the neutral today, and its 1 week rating is sell. Since market conditions are prone to changes, it's worth looking a bit further into the future — according to the 1 month rating HubSpot, Inc. stock shows the neutral signal. See more of HubSpot, Inc. technicals for a more comprehensive analysis.
If you're still not sure, try looking for inspiration in our curated watchlists.
If you're still not sure, try looking for inspiration in our curated watchlists.