HUBS undecidedHUBS has broken its long term bullish channel and now it has earnings on 31 July
This can either push HUBS back to the bullish channel or can further push down the stock to the next strong support of 400 .
The stock movement is currently in a bear trend so until there is a bullish reversal confi
Key facts today
Next report date
—
Report period
—
EPS estimate
—
Revenue estimate
—
−2.66USD
−176.29 MUSD
2.17 BUSD
48.87 M
About HubSpot, Inc.
Sector
Industry
CEO
Yamini Rangan
Website
Headquarters
Cambridge
Employees (FY)
7.66 K
Founded
2005
FIGI
BBG000N7MZ06
HubSpot, Inc. engages in cloud-based customer relationship management. Its platform includes marketing, sales, service, operations and content management system, as well as other tools, integrations and native payment solutions. It operates through the following geographical segments: Americas, Europe and Asia Pacific. The company was founded by Brian Patrick Halligan and Dharmesh Shah on April 4, 2005, and is headquartered in Cambridge, MA.

7/12/24 - $hubs - Ideally we buy lower $400s7/12/24 :: VROCKSTAR :: NYSE:HUBS
Ideally we buy lower $400s
- this thing has been rumored to be bot over so many times, i lose track
- but it's a better salesforce. the chart doesn't lie either, let's use our $HUBS/ NYSE:CRM in trading view (use weekly bars to illustrate the pt nicely)
- 10x

Alphabet's Potential Bid for HubSpot Sends Stock Soaring by 9%Alphabet's reported contemplation of acquiring HubSpot ( NYSE:HUBS ), a prominent player in the marketing software arena. The news, initially broken by Reuters, sent ripples across the market, with HubSpot's shares surging by a notable 9%. This potential acquisition holds significant implications no

HUBS 2024-03-23 is probably ready to go higherNYSE:HUBS
- good revenue growth
- consolidate tightly between key moving average lines
- tested SMA50 multiple times (3 times) to shake out week hands
- looks like ready to shoot higher
- lowrisk position can be entered here with stoploss < 5%

$NYSE:HUBS 2024-03-12 low risk entry - bullishNYSE:HUBS low risk entry can be place here for a partial position while waiting for a break out

HUBS - running since the big earnings beat in NovemberHUBS on the 3 0 minute chart has been trending up since the last earnings. It is above the high
volume area of the volume profile. Basically it is so trong it is not attracting any short sellers.
Waves of new buyers buy from the float or from those who are collecting their profits and
making roo

HUBS, SELL, -5.17% LOSSShorted NYSE:HUBS on 11/8/2023 at market close and closed the position on 11/9/2023 at market open. Net -5.17% loss.

DESCENDING TRIANGLEPrice has broken the support line but is fighting to get back above it.
No clear downtrend followed the break.
I turned the support line blue due to the break.
Triangles are often measured by the width of the wide end to guesstimate targets.
Earning early November.
No recommendation.
PE Ratio - 87

HUBS - 1st SpringEntry: $491.00
Stop: $466.11
Exit Goal: $528.24 w/ Trailing Stop on the way up
Risk per share: $24.89

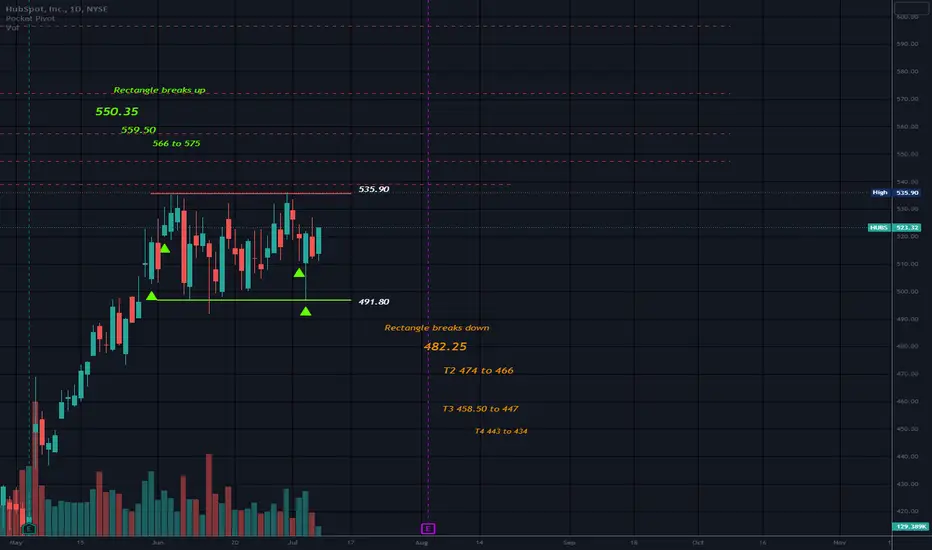
RectangleCup and handle noted and price appears to be in a horizontal trading range after a hefty move to the upside. Targets 1 and 2 were met for the C&H pattern.
This rectangle is neutral until broken.
Some would swing trade inside the structure with caution as eventually this will break one way or the o
See all ideas
An aggregate view of professional's ratings.
Trade directly on the supercharts through our supported, fully-verified and user-reviewed brokers.


Curated watchlists where HUBS is featured.

Frequently Asked Questions
The current price of HUBS is 492.72 USD — it has decreased by 0.61% in the past 24 hours. Watch HubSpot, Inc. stock price performance more closely on the chart.
Depending on the exchange, the stock ticker may vary. For instance, on NYSE exchange HubSpot, Inc. stocks are traded under the ticker HUBS.
HUBS stock has risen by 2.72% compared to the previous week, the month change is a 15.67% fall, over the last year HubSpot, Inc. has showed a 11.70% decrease.
We've gathered analysts' opinions on HubSpot, Inc. future price: according to them, HUBS price has a max estimate of 767.00 USD and a min estimate of 460.00 USD. Watch HUBS chart and read a more detailed HubSpot, Inc. stock forecast: see what analysts think of HubSpot, Inc. and suggest that you do with its stocks.
HUBS reached its all-time high on Nov 17, 2021 with the price of 866.00 USD, and its all-time low was 25.79 USD and was reached on Oct 13, 2014. View more price dynamics on HUBS chart.
See other stocks reaching their highest and lowest prices.
See other stocks reaching their highest and lowest prices.
HUBS stock is 1.93% volatile and has beta coefficient of 1.37. Track HubSpot, Inc. stock price on the chart and check out the list of the most volatile stocks — is HubSpot, Inc. there?
Today HubSpot, Inc. has the market capitalization of 25.27 B, it has increased by 1.69% over the last week.
Yes, you can track HubSpot, Inc. financials in yearly and quarterly reports right on TradingView.
HubSpot, Inc. is going to release the next earnings report on Aug 7, 2024. Keep track of upcoming events with our Earnings Calendar.
HUBS earnings for the last quarter are 1.68 USD per share, whereas the estimation was 1.50 USD resulting in a 12.21% surprise. The estimated earnings for the next quarter are 1.64 USD per share. See more details about HubSpot, Inc. earnings.
HubSpot, Inc. revenue for the last quarter amounts to 617.40 M USD, despite the estimated figure of 597.98 M USD. In the next quarter, revenue is expected to reach 619.21 M USD.
HUBS net income for the last quarter is 5.93 M USD, while the quarter before that showed −13.61 M USD of net income which accounts for 143.61% change. Track more HubSpot, Inc. financial stats to get the full picture.
No, HUBS doesn't pay any dividends to its shareholders. But don't worry, we've prepared a list of high-dividend stocks for you.
As of Jul 27, 2024, the company has 7.66 K employees. See our rating of the largest employees — is HubSpot, Inc. on this list?
EBITDA measures a company's operating performance, its growth signifies an improvement in the efficiency of a company. HubSpot, Inc. EBITDA is −34.66 M USD, and current EBITDA margin is −1.43%. See more stats in HubSpot, Inc. financial statements.
Like other stocks, HUBS shares are traded on stock exchanges, e.g. Nasdaq, Nyse, Euronext, and the easiest way to buy them is through an online stock broker. To do this, you need to open an account and follow a broker's procedures, then start trading. You can trade HubSpot, Inc. stock right from TradingView charts — choose your broker and connect to your account.
Investing in stocks requires a comprehensive research: you should carefully study all the available data, e.g. company's financials, related news, and its technical analysis. So HubSpot, Inc. technincal analysis shows the sell today, and its 1 week rating is sell. Since market conditions are prone to changes, it's worth looking a bit further into the future — according to the 1 month rating HubSpot, Inc. stock shows the neutral signal. See more of HubSpot, Inc. technicals for a more comprehensive analysis.
If you're still not sure, try looking for inspiration in our curated watchlists.
If you're still not sure, try looking for inspiration in our curated watchlists.