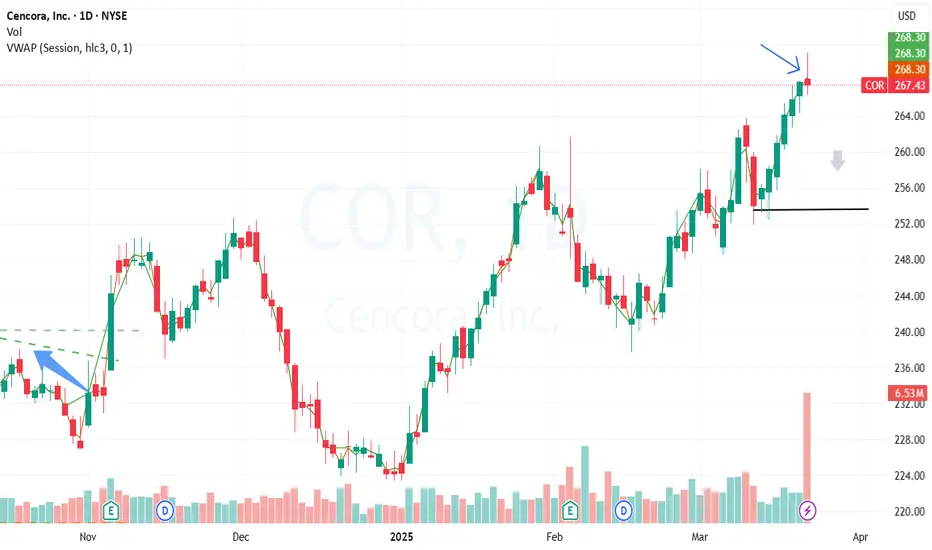
Strong Bounce from Support watching for breakout toward $300
COR have respected key support around $282.50 - $285 zone with strong buying pressure pushing price back above the weekly trendline. Volume spike confirm renewed interest from buyers. Im watching for a potential breakout above $296 - 300.50 which could open the door for retest of the $308-$310 re
Next report date
—
Report period
—
EPS estimate
—
Revenue estimate
—
8.30 EUR
1.36 B EUR
264.02 B EUR
185.76 M
About Cencora, Inc.
Sector
Industry
CEO
Robert P. Mauch
Website
Headquarters
Conshohocken
Founded
1947
ISIN
US03073E1055
FIGI
BBG000GMF943
Cencora, Inc. is a pharmaceutical sourcing and distribution services company. It operates through the United States (U.S.) Healthcare Solutions and International Healthcare Solutions segments. The U.S. Healthcare Solutions segment is involved in the offering of brand-name, specialty brand-name and generic pharmaceuticals, over-the-counter healthcare products, home healthcare supplies and equipment, and related services to a wide variety of healthcare providers. The International Healthcare Solutions segment includes businesses that focus on international pharmaceutical wholesale and related service operations, and global commercialization services. The company was founded by Emil P. Martini in 1947 and is headquartered in Conshohocken, PA.
Related stocks

Bounce area looks enticing here on the technicalThe high 160s is very nicely set up; however, the last candle was bullish in terms of sentiment, especially after two consecutive red days. It has positioned itself nicely for a retrace from this level. Set up the resistance area for further confirmation.

Clear retrace in to buying area, for continuation on trendLooks like it could make the green shadow its sanctuary and move back into positive territory, and the higher high acts as the resistance.

overbought in this area of margin 50s target shortWith candle indicators, as well as overbought oscillators, this seems to be headed back into buy territory in the 50s
240 could be short lived as the averages are crossingIt has an excellent sideways movement, and the resistance has been known to stop this in its tracks, but that being said, still, room to run if they want to give it some locked-in gains as I see room to run by 5 points, I wouldn't be sure if it goes beyond it.

COR Has Entered Short Zone With Good Risk/Reward (3.57)Risk/Reward here is extremely favorable to the short side. As with all shorts, it's best to use caution and position size accordingly, and that stop loss is essential.

$COR: A CORE Position For A Deflationary Environment?Real Estate has seen some specific winners starting to emerge, however, as the Fed soon begins the tightening process, is it possible we still see more in the tank for IYR (REIT ETF) as the Dollar continues it's rally? Keep in mind, a rate hike currently isn't priced in until July of 2022 and the in

COR longGives a good Dividend. but I don' think it will rise that quickly. Should wait at least a few months

Overdue breakout breakout at pivot 128.47consolidated base ... tested upper band low volume.. institutional buying... breakout above pivot of 128.47

Breakout ATHA breaking of ATH is a good opportunity to enter in the stock. Also the classical indicator like RSI are bullish.
----------------------------
Good Luck

See all ideas
Summarizing what the indicators are suggesting.
Neutral
SellBuy
Strong sellStrong buy
Strong sellSellNeutralBuyStrong buy
Neutral
SellBuy
Strong sellStrong buy
Strong sellSellNeutralBuyStrong buy
Neutral
SellBuy
Strong sellStrong buy
Strong sellSellNeutralBuyStrong buy
An aggregate view of professional's ratings.
Neutral
SellBuy
Strong sellStrong buy
Strong sellSellNeutralBuyStrong buy
Neutral
SellBuy
Strong sellStrong buy
Strong sellSellNeutralBuyStrong buy
Neutral
SellBuy
Strong sellStrong buy
Strong sellSellNeutralBuyStrong buy
Displays a symbol's price movements over previous years to identify recurring trends.
ABC4571978
Cencora, Inc. 4.3% 15-DEC-2047Yield to maturity
5.47%
Maturity date
Dec 15, 2047
ABC4213751
Cencora, Inc. 4.25% 01-MAR-2045Yield to maturity
5.43%
Maturity date
Mar 1, 2045
ABC5953320
Cencora, Inc. 5.15% 15-FEB-2035Yield to maturity
4.68%
Maturity date
Feb 15, 2035
ABC5748091
Cencora, Inc. 5.125% 15-FEB-2034Yield to maturity
4.59%
Maturity date
Feb 15, 2034
ABC5156681
Cencora, Inc. 2.7% 15-MAR-2031Yield to maturity
4.27%
Maturity date
Mar 15, 2031
ABC4987224
Cencora, Inc. 2.8% 15-MAY-2030Yield to maturity
4.14%
Maturity date
May 15, 2030
ABC5953319
Cencora, Inc. 4.85% 15-DEC-2029Yield to maturity
4.12%
Maturity date
Dec 15, 2029
ABC4571977
Cencora, Inc. 3.45% 15-DEC-2027Yield to maturity
3.93%
Maturity date
Dec 15, 2027
ABC5953643
Cencora, Inc. 4.625% 15-DEC-2027Yield to maturity
3.85%
Maturity date
Dec 15, 2027
XS307124637
Cencora, Inc. 3.625% 22-MAY-2032Yield to maturity
3.36%
Maturity date
May 22, 2032
XS307124629
Cencora, Inc. 2.875% 22-MAY-2028Yield to maturity
2.70%
Maturity date
May 22, 2028
See all ABG bonds
Frequently Asked Questions
The current price of ABG is 278.80 EUR — it has increased by 1.20% in the past 24 hours. Watch Cencora, Inc. stock price performance more closely on the chart.
Depending on the exchange, the stock ticker may vary. For instance, on FWB exchange Cencora, Inc. stocks are traded under the ticker ABG.
ABG stock has risen by 3.01% compared to the previous week, the month change is a 13.20% rise, over the last year Cencora, Inc. has showed a 28.87% increase.
We've gathered analysts' opinions on Cencora, Inc. future price: according to them, ABG price has a max estimate of 311.12 EUR and a min estimate of 267.17 EUR. Watch ABG chart and read a more detailed Cencora, Inc. stock forecast: see what analysts think of Cencora, Inc. and suggest that you do with its stocks.
ABG stock is 1.18% volatile and has beta coefficient of 0.12. Track Cencora, Inc. stock price on the chart and check out the list of the most volatile stocks — is Cencora, Inc. there?
Today Cencora, Inc. has the market capitalization of 54.70 B, it has increased by 1.42% over the last week.
Yes, you can track Cencora, Inc. financials in yearly and quarterly reports right on TradingView.
Cencora, Inc. is going to release the next earnings report on Nov 5, 2025. Keep track of upcoming events with our Earnings Calendar.
ABG earnings for the last quarter are 3.40 EUR per share, whereas the estimation was 3.27 EUR resulting in a 3.96% surprise. The estimated earnings for the next quarter are 3.23 EUR per share. See more details about Cencora, Inc. earnings.
Cencora, Inc. revenue for the last quarter amounts to 68.48 B EUR, despite the estimated figure of 67.99 B EUR. In the next quarter, revenue is expected to reach 71.12 B EUR.
ABG net income for the last quarter is 583.54 M EUR, while the quarter before that showed 663.56 M EUR of net income which accounts for −12.06% change. Track more Cencora, Inc. financial stats to get the full picture.
Yes, ABG dividends are paid quarterly. The last dividend per share was 0.47 EUR. As of today, Dividend Yield (TTM)% is 0.67%. Tracking Cencora, Inc. dividends might help you take more informed decisions.
Cencora, Inc. dividend yield was 0.91% in 2024, and payout ratio reached 27.07%. The year before the numbers were 1.08% and 22.74% correspondingly. See high-dividend stocks and find more opportunities for your portfolio.
As of Oct 22, 2025, the company has 46 K employees. See our rating of the largest employees — is Cencora, Inc. on this list?
EBITDA measures a company's operating performance, its growth signifies an improvement in the efficiency of a company. Cencora, Inc. EBITDA is 3.86 B EUR, and current EBITDA margin is 1.41%. See more stats in Cencora, Inc. financial statements.
Like other stocks, ABG shares are traded on stock exchanges, e.g. Nasdaq, Nyse, Euronext, and the easiest way to buy them is through an online stock broker. To do this, you need to open an account and follow a broker's procedures, then start trading. You can trade Cencora, Inc. stock right from TradingView charts — choose your broker and connect to your account.
Investing in stocks requires a comprehensive research: you should carefully study all the available data, e.g. company's financials, related news, and its technical analysis. So Cencora, Inc. technincal analysis shows the strong buy rating today, and its 1 week rating is strong buy. Since market conditions are prone to changes, it's worth looking a bit further into the future — according to the 1 month rating Cencora, Inc. stock shows the strong buy signal. See more of Cencora, Inc. technicals for a more comprehensive analysis.
If you're still not sure, try looking for inspiration in our curated watchlists.
If you're still not sure, try looking for inspiration in our curated watchlists.