$AMZNWith more ICE raids and major Amazon hubs in Portland under pressure, we may see a temporary slowdown in operations.
But disruption often sparks adaptation. This could accelerate Amazon’s push into automation, AI, and robotics to reduce exposure to labor risks and government intervention.
If Amazon adjusts quickly to technology, it stays ahead. If not, the pressure could weigh heavy on growth.
NASDAQ:AMZN will be a key ticker to watch.
AMZ trade ideas

Global Shadow Banking System in the World MarketIntroduction
The global financial system is not confined to traditional banks and regulated institutions. A vast parallel network of financial intermediaries—commonly referred to as the shadow banking system—plays an increasingly important role in the allocation of credit, liquidity, and investment flows across the world. Unlike conventional banks, shadow banking entities operate outside the traditional regulatory framework, which makes them both a source of innovation and a potential systemic risk.
The global shadow banking system has expanded significantly since the 1980s, especially after the 2008 Global Financial Crisis (GFC), when regulatory reforms tightened the space for traditional banks. This expansion has reshaped global capital markets, influencing liquidity, credit creation, and financial stability in both developed and emerging economies.
In this article, we explore the definition, evolution, key players, economic significance, risks, and regulatory perspectives of shadow banking worldwide.
What is Shadow Banking?
The term “shadow banking” was popularized by Paul McCulley in 2007 to describe credit intermediation carried out by entities and activities outside the regular banking system.
Characteristics of Shadow Banking:
Outside traditional regulation – Unlike commercial banks, they are not subject to strict regulatory oversight.
Maturity transformation – Borrow short-term (like money market funds) and lend long-term (like securitization).
Credit intermediation – Facilitate loans, investments, and securities issuance without being a formal bank.
Market-based funding – Depend heavily on capital markets rather than deposits.
Examples include hedge funds, private equity firms, securitization vehicles, money market funds, structured investment vehicles (SIVs), and peer-to-peer lending platforms.
Evolution of Shadow Banking Globally
1. Early Foundations (1980s–1990s)
Liberalization of financial markets in the US and Europe created space for non-bank financial intermediaries.
Development of securitization and derivative markets enabled institutions to bypass banking regulations.
2. Shadow Banking Before 2008 Crisis
Rapid growth in securitization and off-balance-sheet vehicles by investment banks.
Heavy reliance on short-term wholesale funding.
Played a crucial role in housing bubbles and subprime lending.
3. Shadow Banking Post-2008
Traditional banks faced stricter rules under Basel III, which limited leverage.
Non-bank intermediaries stepped in to provide credit and liquidity.
Growth of fintech, peer-to-peer lending, and private debt markets.
4. Current Landscape (2020s)
Shadow banking assets estimated at over $65 trillion globally (FSB estimates).
Largest contributors: US, China, EU, and Japan.
Increasing role in corporate bond markets, private credit funds, and asset management.
Key Components of the Global Shadow Banking System
1. Money Market Funds (MMFs)
Provide liquidity to corporations and investors.
Offer an alternative to bank deposits.
Vulnerable to “runs” during market stress (e.g., 2008 Reserve Primary Fund collapse).
2. Securitization Vehicles
Pool loans (mortgages, auto loans, credit card receivables) and sell them as securities.
Increase market liquidity but spread systemic risk (subprime mortgage crisis example).
3. Hedge Funds & Private Equity
Engage in leveraged trading, arbitrage, and alternative financing.
Play a role in distressed debt markets and private credit.
4. Structured Investment Vehicles (SIVs)
Borrow short-term via commercial paper and invest in long-term securities.
Collapsed massively during 2008 due to maturity mismatch.
5. Fintech & Peer-to-Peer (P2P) Lending
New entrants disrupting credit markets.
Provide credit access in regions underserved by banks (especially Asia & Africa).
6. Repo Markets (Repurchase Agreements)
Allow institutions to borrow against securities.
Critical for liquidity but highly vulnerable to shocks.
Role of Shadow Banking in the World Market
1. Enhancing Credit Availability
Shadow banks channel funds to sectors and borrowers often ignored by traditional banks, such as startups, SMEs, and high-risk borrowers.
2. Supporting Market Liquidity
By engaging in repo transactions, securitizations, and asset trading, shadow banks provide crucial liquidity to global capital markets.
3. Diversification of Financial Intermediation
Non-bank intermediaries add resilience by diversifying sources of credit, reducing dependency on commercial banks.
4. Innovation in Financial Products
Structured finance, fintech lending, and alternative investments often originate in the shadow banking world.
5. Supporting Economic Growth in Emerging Markets
In economies like China and India, shadow banking has filled gaps left by traditional banks, fueling entrepreneurship and private sector expansion.
Global Distribution of Shadow Banking
United States
Largest shadow banking system, estimated at over $20 trillion.
Dominated by money market funds, securitization vehicles, and hedge funds.
Plays a crucial role in corporate debt and mortgage markets.
European Union
Asset managers, insurance firms, and pension funds are key players.
Growth of investment funds post-crisis due to stricter banking rules.
Concerns about systemic risks in bond markets.
China
Rapid expansion since 2010, driven by trust companies, wealth management products, and online lending platforms.
Estimated shadow banking assets exceed $10 trillion.
Important for private enterprises but also a source of hidden credit risks.
Japan
Smaller but stable shadow banking sector.
Strong presence of insurance firms and pension funds in capital markets.
Emerging Markets
Latin America, Africa, and Southeast Asia seeing rapid rise in P2P lending and fintech-based shadow banking.
Helps bridge financial inclusion gaps.
Risks Associated with Shadow Banking
1. Systemic Risk & Contagion
Interconnectedness with traditional banks can spread financial shocks.
Example: 2008 crisis, where collapse of mortgage-backed securities destabilized global banking.
2. Liquidity Risks
Heavy reliance on short-term funding can trigger “runs” during stress.
3. Leverage & Opacity
Use of complex derivatives and leverage amplifies risk.
Lack of transparency makes it difficult to assess exposures.
4. Regulatory Arbitrage
Entities exploit gaps in regulations to bypass banking restrictions.
5. Credit Risk
Shadow banks often lend to riskier borrowers. Defaults can create chain reactions.
6. Cross-Border Risks
Global nature of shadow banking spreads financial risks internationally.
Regulatory Responses to Shadow Banking
1. Financial Stability Board (FSB)
Established frameworks for monitoring shadow banking globally.
Tracks size, activities, and systemic risks.
2. Basel III & IV Regulations
Tightened rules for banks to reduce dependence on shadow structures.
3. US Regulations
Dodd-Frank Act imposed stricter oversight on securitization and hedge funds.
SEC regulates money market funds.
4. China’s Crackdown
Government tightened controls on wealth management products and online lending.
Efforts to shift shadow credit back into regulated banks.
5. EU Initiatives
European Securities and Markets Authority (ESMA) oversees investment funds.
Implementation of reforms in repo and securitization markets.
Opportunities & Benefits of Shadow Banking
Financial Innovation – Expands new financing models like crowdfunding and digital lending.
Economic Growth – Provides credit for small businesses and consumers.
Investment Opportunities – Offers investors access to higher-yield products.
Resilience to Banking Crises – Provides alternative funding channels when banks restrict lending.
Future of Shadow Banking in the Global Market
1. Growth in Emerging Economies
Shadow banking is expected to expand in Asia, Africa, and Latin America due to financial inclusion needs and fintech innovation.
2. Digital Transformation
Fintech platforms, blockchain-based lending, and decentralized finance (DeFi) could become part of shadow banking 2.0.
3. Stricter Oversight
Governments and regulators will likely tighten monitoring to reduce systemic risks.
4. Integration with Traditional Banks
Many shadow banking activities are becoming more closely linked to commercial banks through partnerships and acquisitions.
5. Sustainable Finance & ESG Integration
Shadow banks may play a role in financing green bonds, renewable energy, and sustainable projects.
Conclusion
The global shadow banking system has become a central pillar of modern financial markets. By providing credit, liquidity, and innovative financial solutions, shadow banks complement the traditional banking system. However, the very features that make them attractive—regulatory flexibility, market-based funding, and risk-taking—also create vulnerabilities.
The world market depends on shadow banking for economic dynamism, but unchecked growth could destabilize financial systems, as witnessed in 2008. The challenge lies in balancing innovation with oversight, ensuring that shadow banking continues to support global economic growth without creating hidden systemic risks.
As financial markets evolve with technology, shadow banking will continue to expand, especially in emerging economies. Policymakers, investors, and global institutions must remain vigilant to manage both its opportunities and threats in shaping the future of the world economy.
Role of Derivatives Trading in Emerging Market Economies1. Understanding Emerging Market Economies
Emerging market economies are nations that are in the process of rapid industrialization, modernization, and integration into the global economy. They often share certain characteristics:
High but volatile growth rates
Developing financial markets
Growing participation of foreign investors
Vulnerability to external shocks and capital flows
Examples include India, China, Brazil, Russia, South Africa, Turkey, and Mexico. While these markets are attractive due to their growth potential, they are also riskier than developed economies because of factors such as political instability, regulatory weaknesses, and lower market maturity.
Derivatives trading in such economies serves as a risk-management and capital-attraction tool that helps balance opportunities with vulnerabilities.
2. Evolution of Derivatives in Emerging Markets
Historically, derivatives markets developed first in developed countries, particularly with agricultural and commodity futures trading in the 19th century (Chicago Board of Trade, 1848). In emerging markets, however, derivatives trading began much later—often after financial liberalization policies in the 1980s and 1990s.
For example:
India: Introduced exchange-traded derivatives in 2000 (NSE launched index futures). Today, India is among the largest derivatives markets by volume.
Brazil: The BM&FBovespa (now B3) became a hub for derivatives on interest rates and commodities.
China: Initially cautious, but now home to one of the world’s busiest futures exchanges, particularly for commodities like steel and oil.
South Africa: Developed sophisticated derivatives markets tied to mining and energy.
This evolution reflects both domestic demand (hedging currency, commodity, and interest rate risks) and international demand (foreign investors requiring instruments to manage risks in volatile markets).
3. Functions of Derivatives in Emerging Economies
Derivatives trading plays a range of roles in EMEs, which can be grouped into several core functions:
3.1 Risk Management and Hedging
Emerging markets are characterized by volatility in currency values, commodity prices, and interest rates. Derivatives allow businesses and investors to protect themselves:
Exporters can hedge against currency fluctuations.
Farmers and commodity producers hedge against price swings in agricultural or mineral products.
Corporations hedge against interest rate risks in volatile debt markets.
Example: An Indian IT company earning revenue in USD can use currency futures to lock in an exchange rate, ensuring predictable rupee earnings.
3.2 Price Discovery
Derivatives markets often provide more accurate and forward-looking price information than spot markets. Futures and options reveal investor expectations of future prices, which helps businesses and policymakers in decision-making.
3.3 Enhancing Liquidity
Derivatives attract both hedgers and speculators, which increases market activity. This liquidity makes it easier for participants to buy or sell assets, reducing transaction costs and market inefficiencies.
3.4 Access to International Capital
A robust derivatives market signals maturity, attracting foreign institutional investors (FIIs) who seek to manage risk while investing in volatile markets. This helps channel global capital into EMEs.
3.5 Promoting Financial Innovation
Derivatives markets often stimulate the creation of new products, risk models, and investment strategies, fostering overall financial sector development.
4. Benefits of Derivatives Trading for Emerging Markets
4.1 Stabilizing Volatile Economies
EMEs are prone to sudden swings due to external shocks—commodity price changes, global interest rate hikes, or geopolitical risks. Derivatives allow participants to absorb shocks by distributing risks across the market.
4.2 Supporting Agricultural and Commodity Sectors
In commodity-dependent economies (e.g., Brazil, Indonesia, Nigeria), derivatives protect farmers and producers from price crashes, ensuring sustainable incomes and investment.
4.3 Enhancing Investor Confidence
Transparent and well-regulated derivatives markets boost confidence among domestic and foreign investors, as risks can be effectively managed.
4.4 Deepening Financial Markets
Derivatives encourage greater participation from institutional investors, retail traders, and international funds, thus broadening and deepening local financial markets.
4.5 Driving Economic Growth
By stabilizing markets, encouraging investments, and improving efficiency, derivatives contribute indirectly to economic growth and development.
5. Challenges and Risks of Derivatives in Emerging Economies
While derivatives offer multiple benefits, they also carry risks that are particularly pronounced in EMEs:
5.1 Market Misuse and Speculation
Derivatives can fuel excessive speculation, leading to bubbles and crashes, especially when regulatory oversight is weak.
5.2 Systemic Risk
In economies with underdeveloped banking systems, poorly managed derivatives exposures can trigger systemic crises. Example: The 1997 Asian Financial Crisis was amplified by the misuse of derivatives in Thailand and South Korea.
5.3 Regulatory Weaknesses
Many EMEs lack robust regulatory infrastructure to monitor complex derivatives products, making them vulnerable to fraud and manipulation.
5.4 Limited Awareness and Education
Corporate treasurers, farmers, and retail investors often lack financial literacy about derivatives, which can lead to misuse.
5.5 Currency and Capital Flow Volatility
Excessive reliance on derivatives for currency speculation can increase volatility rather than reduce it, making economies more fragile.
6. Case Studies
6.1 India
India’s derivatives market has grown exponentially since 2000. NSE and BSE offer index futures, stock options, currency futures, and commodity derivatives.
Positive impact: India’s IT exporters and oil importers actively use derivatives to hedge risks.
Challenges: Retail investors often misuse options for speculation, leading to losses.
6.2 Brazil
Brazil has one of the most liquid derivatives markets in Latin America. Interest rate futures and currency derivatives are heavily used.
Positive impact: Allowed Brazil to attract foreign investors despite inflationary history.
Negative impact: Speculative flows sometimes worsen currency volatility.
6.3 China
China’s commodity futures markets (iron ore, oil, steel) are among the world’s busiest.
Positive impact: Provided hedging tools for its massive manufacturing sector.
Negative impact: Retail speculation has sometimes distorted markets.
7. Policy and Regulatory Framework
To ensure derivatives benefit EMEs, strong policies are essential:
Robust regulation to prevent misuse and protect investors.
Transparent exchanges with strong clearinghouses to reduce counterparty risks.
Investor education to improve awareness.
International integration while safeguarding against speculative capital inflows.
Regulators like SEBI in India, CVM in Brazil, and CSRC in China play central roles in shaping market safety and growth.
8. Future Outlook
The role of derivatives in emerging markets is expected to expand further due to:
Digital platforms and fintech increasing retail participation.
Cross-border derivatives trading linking EMEs to global markets.
Green finance and carbon credit derivatives in response to climate change.
Crypto derivatives in some EMEs experimenting with digital assets.
Emerging markets will likely see derivatives becoming integral to financial stability, though only if supported by strong regulation and financial literacy campaigns.
Conclusion
Derivatives trading plays a dual role in emerging market economies: it is both a stabilizer and a potential destabilizer. On one hand, it enables risk management, attracts international capital, supports commodity producers, and deepens financial markets. On the other hand, without strong regulatory oversight, it can amplify speculation and systemic risks.
For EMEs, the challenge is to harness the benefits while mitigating the risks. This requires building robust financial institutions, improving market literacy, and ensuring transparent regulations. As globalization deepens, derivatives will remain central to the integration of emerging economies into the world financial system—acting as both a shield against volatility and a bridge to global capital flows.
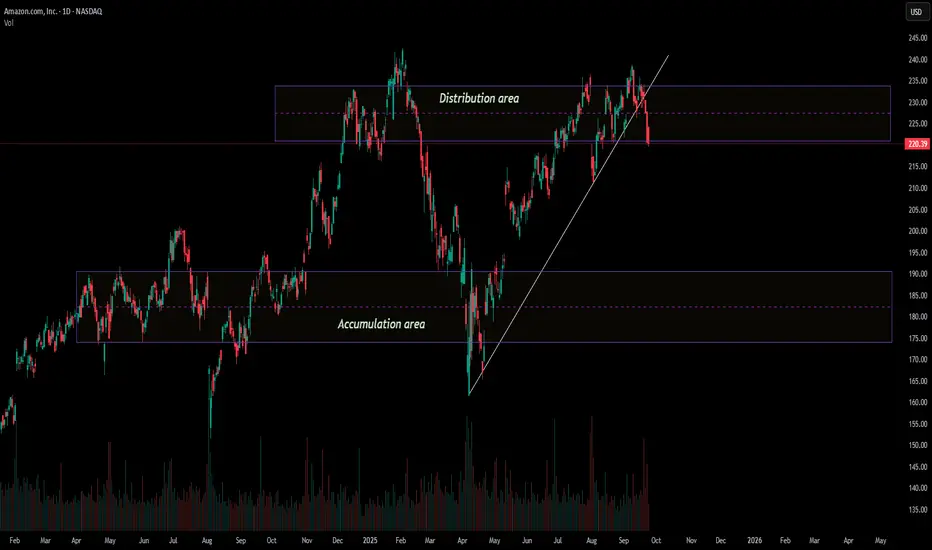
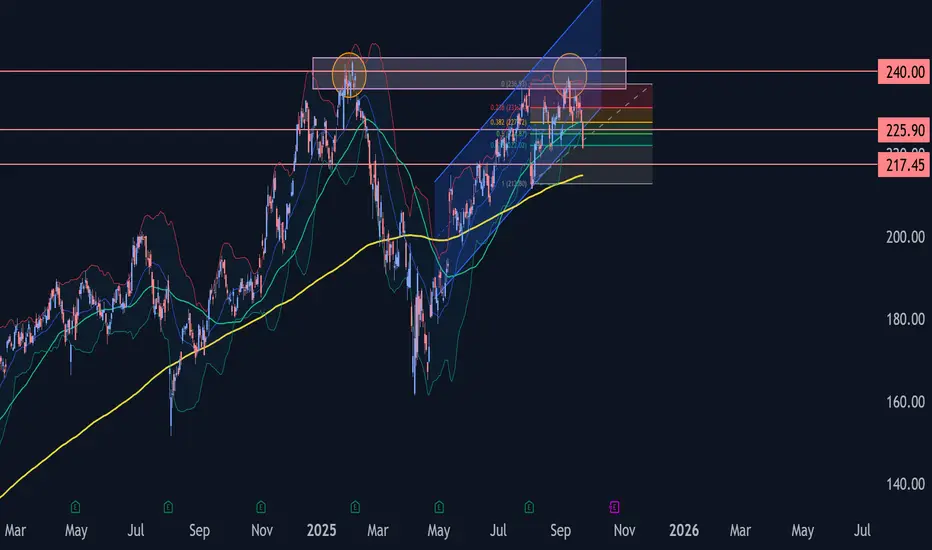
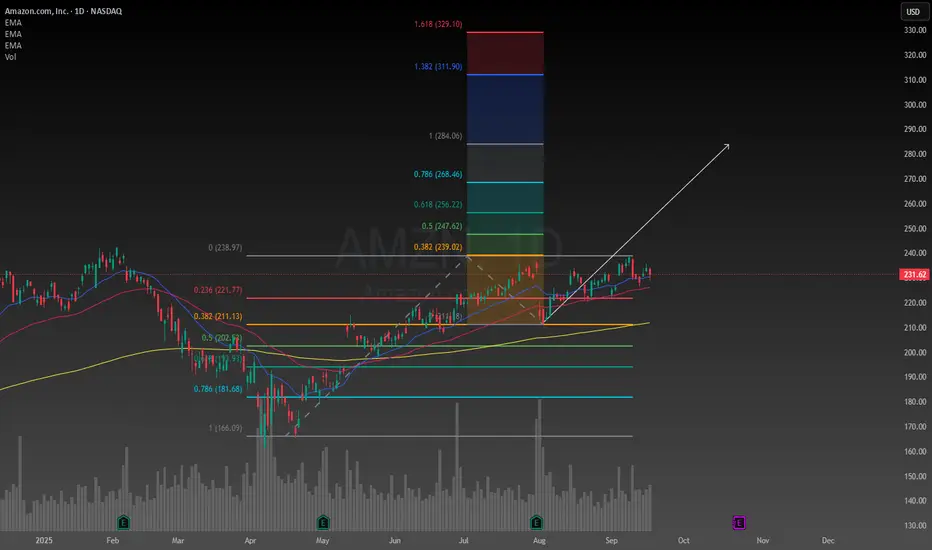
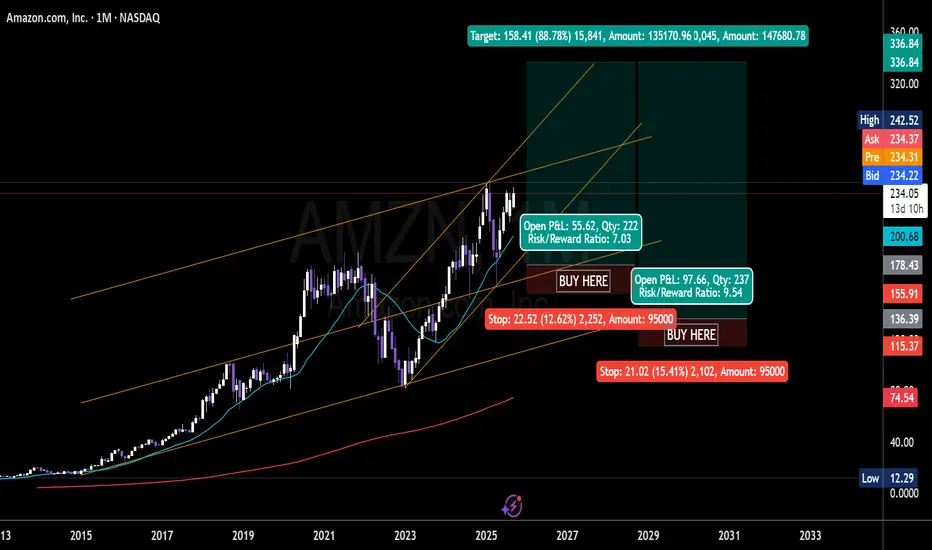
Amazon analysisRight now, I believe price is trading inside the distribution area that I’ve highlighted.
The recent break of the trendline suggests momentum may be shifting, with the risk of a reversal into a downtrend.
From an investor’s perspective, this is not the most attractive area to be buying. A more favorable entry could come if price moves back down into the accumulation area I’ve marked on the chart.
🎯 Conclusion: My view is cautious — I think AMZN may leave the distribution phase and head lower toward the accumulation area. As an investor, patience here may prove wiser than chasing current levels.
Amazon (AMZN) shares fall around 3% in a single dayAmazon (AMZN) shares fall around 3% in a single day
As the chart shows, Amazon (AMZN) shares fell by roughly 3% yesterday after reports that the US Federal Trade Commission has launched a probe into the company over alleged “dark patterns”.
According to the allegations, Amazon may have deliberately complicated the process of cancelling Prime subscriptions in order to retain customers. Should the charges be proven, this could result in significant fines and have a major impact on one of Amazon’s key revenue streams.
Amazon’s share price dipped below $220 yesterday for the first time since 12 August. Could the decline continue?
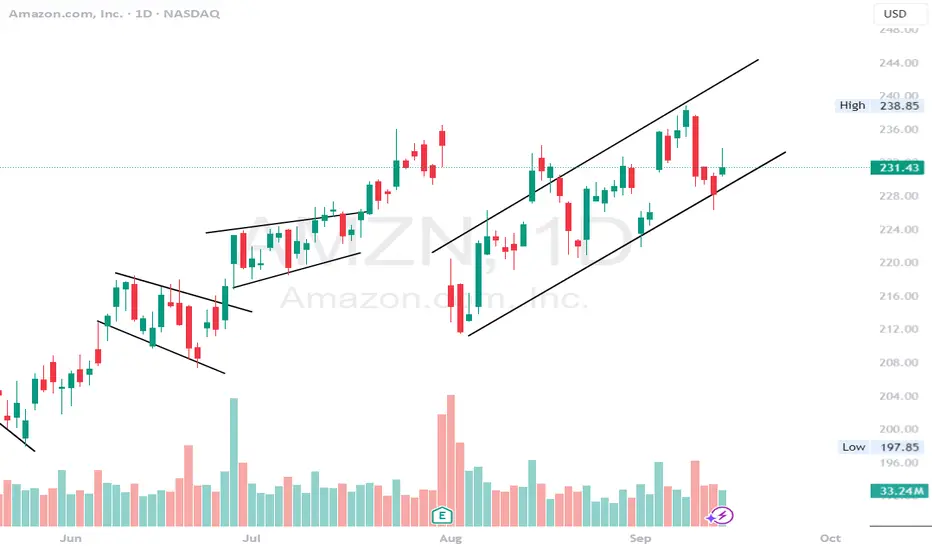
Technical analysis of Amazon (AMZN) chart
In our 5 September analysis, we:
→ used AMZN stock price swings to plot an ascending channel (shown in blue);
→ suggested the price could extend its bullish structure after breaking through resistance R (shown in red).
Indeed, in the following days there was some bullish momentum: peak B was higher than peak A. However, this appears more a sign of weakness when judged by the nature of the reversal:
→ on 10 September, the price edged only slightly above the summer peak,
→ before tumbling sharply, with bearish candles widening.
This move, showing clear signs of a Double Top pattern (A–B), may suggest that buyers at September’s high were trapped, with stop-loss closures adding to the downward pressure.
The previously plotted ascending channel remains valid, but Amazon stock price has dropped (shown by the red arrow) into its lower half. In this context, the channel’s midline and the $227.70 level could now act as resistance.
Bulls, however, still have grounds to expect support from:
→ the bullish reversal zone formed in early August, when a narrowing triangle appeared on the chart with its axis around $215;
→ the QL line, which divides the lower half of the channel into quarters.
Although the negative sentiment from FTC-related news may eventually fade, what remains concerning is AMZN’s relatively weaker performance in 2025 compared with the broader market: while the S&P 500 set a fresh all-time high this week, Amazon shares have barely moved since the start of the year.
This article represents the opinion of the Companies operating under the FXOpen brand only. It is not to be construed as an offer, solicitation, or recommendation with respect to products and services provided by the Companies operating under the FXOpen brand, nor is it to be considered financial advice.

Top Healthcare Stocks to Watch in Today’s Market🏥 Industry Overview: Healthcare in 2025
The healthcare sector has experienced a period of volatility in 2025, with the S&P 500 healthcare index rising just 4% since early 2023, compared to a 52% surge in the broader market. Factors contributing to this underperformance include policy uncertainties, regulatory challenges, and pricing pressures. Despite these headwinds, the sector remains resilient, driven by demographic trends such as an aging population, technological advancements, and increasing healthcare expenditures.
📈 Top Healthcare Stocks to Watch
1. Johnson & Johnson (NYSE: JNJ)
Johnson & Johnson continues to be a stalwart in the healthcare sector, with a diversified portfolio spanning pharmaceuticals, medical devices, and consumer health products. The company's robust pipeline and consistent dividend payouts make it a reliable choice for long-term investors.
2. Eli Lilly and Company (NYSE: LLY)
Eli Lilly has been at the forefront of innovation, particularly in the diabetes and oncology spaces. The company's recent advancements in weight-loss therapies have garnered significant attention, positioning it as a leader in metabolic health.
3. Merck & Co., Inc. (NYSE: MRK)
Merck's oncology drug, Keytruda, remains a cornerstone of its portfolio, with ongoing clinical trials expanding its therapeutic indications. The company's strategic partnerships and global reach enhance its growth prospects.
4. AbbVie Inc. (NYSE: ABBV)
AbbVie's acquisition of Allergan has bolstered its presence in the aesthetics and eye care markets. The company's strong pipeline, particularly in immunology and neuroscience, provides a solid foundation for future growth.
5. Amgen Inc. (NASDAQ: AMGN)
Amgen's leadership in biologics and biosimilars positions it well in the evolving pharmaceutical landscape. The company's focus on cardiovascular and oncology therapies aligns with current healthcare priorities.
6. AstraZeneca plc (NYSE: AZN)
AstraZeneca's commitment to oncology and respiratory treatments has driven its recent growth. Strategic acquisitions and a strong R&D pipeline support its long-term prospects.
7. Novartis AG (NYSE: NVS)
Novartis continues to innovate in gene therapies and ophthalmology. The company's focus on high-value treatments and strategic divestitures streamline its operations, enhancing shareholder value.
8. Sanofi (NYSE: SNY)
Sanofi's emphasis on immunology and rare diseases has strengthened its market position. Collaborations and acquisitions in the biotech space expand its therapeutic reach.
9. Vertex Pharmaceuticals (NASDAQ: VRTX)
Vertex's leadership in cystic fibrosis treatments has been complemented by its expansion into gene editing technologies. The company's innovative approach positions it as a key player in precision medicine.
10. Intuitive Surgical (NASDAQ: ISRG)
Intuitive Surgical remains a pioneer in robotic-assisted surgery. The company's expanding global footprint and continuous technological advancements sustain its competitive edge.
🔍 Emerging Opportunities
Obesity Treatment Market
The global obesity epidemic has spurred demand for effective treatments. Companies like Novo Nordisk and Eli Lilly are capitalizing on this trend with their weight-loss therapies. In India, Fortis Healthcare plans to expand its network of obesity clinics, reflecting the growing importance of metabolic health in emerging markets.
Biotech Innovations
Biotechnology firms are making significant strides in gene therapies and personalized medicine. Companies like Vertex Pharmaceuticals and Scholar Rock are at the forefront of these innovations, offering potential breakthroughs in treating genetic disorders.
📊 Market Trends and Considerations
Regulatory Landscape: Policy changes, such as drug pricing reforms and reimbursement adjustments, can impact profitability.
Technological Advancements: The integration of AI and robotics in healthcare delivery enhances efficiency and patient outcomes.
Global Health Initiatives: International collaborations and funding for global health challenges present growth opportunities.
💡 Investment Strategies
Diversification: Investing across various subsectors—pharmaceuticals, medical devices, biotechnology—mitigates sector-specific risks.
Long-Term Horizon: Focusing on companies with strong pipelines and robust financials ensures resilience against market fluctuations.
Thematic Investing: Targeting trends like aging populations, digital health, and personalized medicine aligns investments with macroeconomic shifts.
🧾 Conclusion
The healthcare sector in 2025 offers a plethora of investment opportunities, driven by innovation, demographic trends, and evolving market dynamics. By focusing on companies with strong fundamentals, strategic initiatives, and alignment with global health trends, investors can position themselves for long-term success in this vital industry.

AMZN ShortMini-coil breakdown after a long choppy uptrend.
Long term trend broken and previous high failed to clear as well

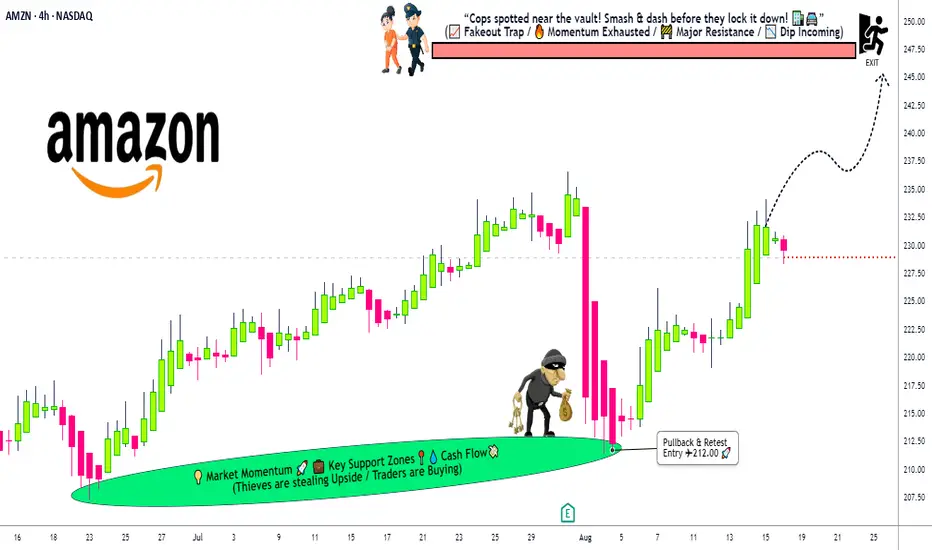
Amazon Stock Heist: Thieves Targeting 247 Escape Point🔐💰 AMAZON HEIST PLAN – STOCK MARKET ROBBERY STYLE 🚀📈
👋 Hey Thief OG’s, Money Grabbers & Market Shadows!
Today’s mission is inside the vault of Amazon.com Inc. (AMZN) – and we’re planning a Bullish Heist.
🎯 ENTRY – Layering the Break-In 💎
The vault doors are always open for the thief gang!
Place multiple Buy Limit Orders (layer entries) at 🏦:
230.00 / 227.00 / 225.00 / 222.00
You can add more layers to your heist plan based on your own risk appetite.
Thief strategy = stack the entries, wait for the pullback, strike big.
🛑 STOP LOSS – Thief Escape Route 🚔
This is the official Thief SL: @219.00.
But remember OG’s – adjust your SL based on your own strategy & bag size.
We don’t all run with the same loot.
🎯 TARGET – Police Barricade 🚨
Before the sirens ring, our escape bag is ready at @247.00.
That’s where we dump the loot and vanish into the shadows. 🏃💨💼
🕵️♂️ THIEF STYLE STRATEGY
✅ Layering entry method (multiple buy limits = thief stacking plan).
✅ Risk management = key to survival.
✅ Exit before the market police catches you.
💥 Remember OG’s: This is not financial advice – this is a robbery simulation in the stock market.
Support the gang 👉 Smash the Boost Button 💥 so our heist team gets stronger!
🤑💼💰 Every day, every chart, every loot = Thief Trader Style.
Stay sharp. Stay hidden. Stay profitable.
Amazon Wave Analysis – 23 September 2025
- Amazon broke support zone
- Likely to fall to support level 217.45
Amazon recently broke the support zone between the support level 225.90 (low of the earlier impulse wave i), support trendline of the daily up channel from April and the 50% Fibonacci correction of the upward impulse C from the start of August.
The breakout of this support zone continues the active impulse wave 3 which belongs to the intermediate downward impulse sequence (C) from September.
Amazon can be expected to fall to the next support level 217.45 (target price for the completion of the active impulse wave 3).
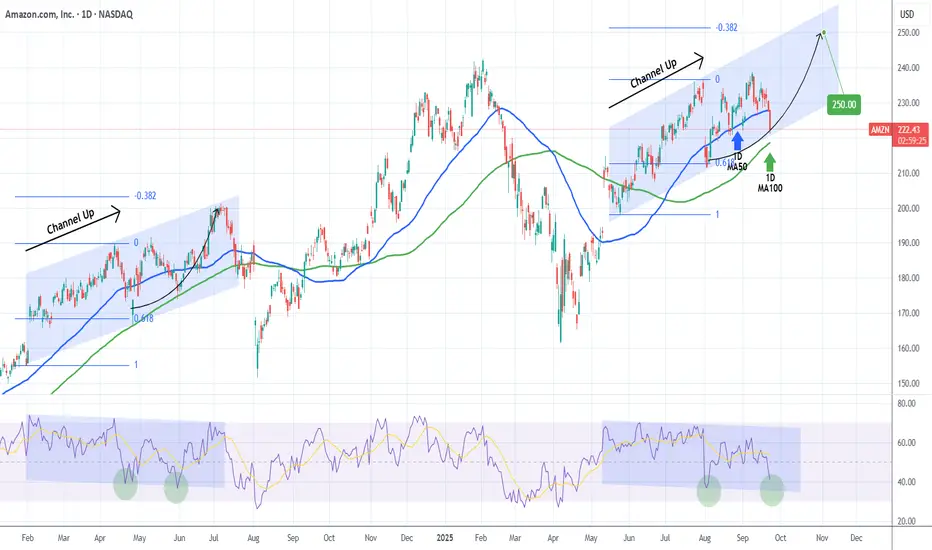
AMAZON Has it found a bottom?Amazon Inc. (AMZN) has been trading within a 4-month Channel Up and is currently pulling back on a Bearish Leg. The 1D MA100 (green trend-line) is just below and last time a similar Channel Up found support on it (May 31 2024), it rebounded for a -0.382 Fibonacci extension top.
As you can see, both patterns are identical, even making their first Higher Lows on their respective 0.618 Fib. Even their 1D RSI fractals are similar and right now we are headed of the 2nd Low (green circle).
As a result, we expect a bullish reversal there, targeting a little under $250 (Fib -0.382 ext).
-------------------------------------------------------------------------------
** Please LIKE 👍, FOLLOW ✅, SHARE 🙌 and COMMENT ✍ if you enjoy this idea! Also share your ideas and charts in the comments section below! This is best way to keep it relevant, support us, keep the content here free and allow the idea to reach as many people as possible. **
-------------------------------------------------------------------------------
💸💸💸💸💸💸
👇 👇 👇 👇 👇 👇
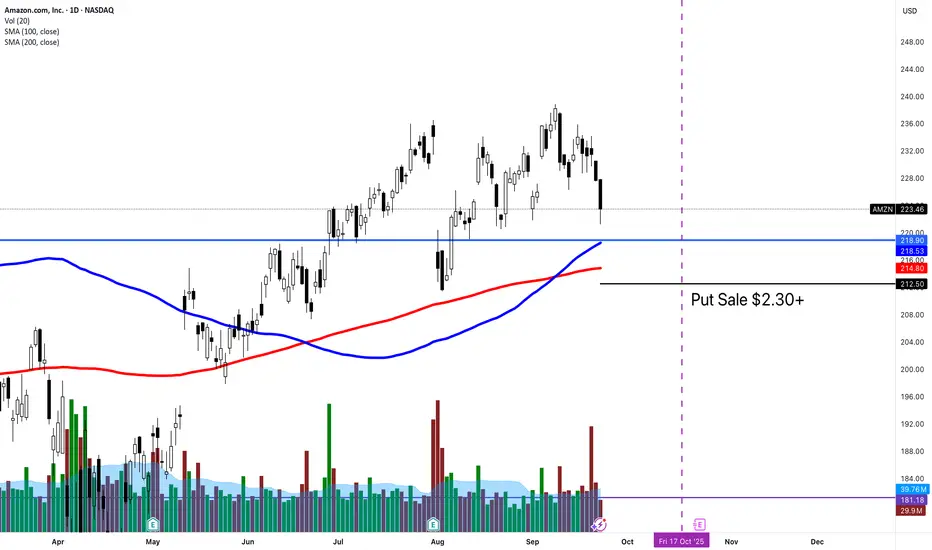
AMZN put sale Put sale is below the 100/200 SMA.
Before earnings. 1%+ premium capture. Who is afraid to own AMZN? Not me.
Buy low, sell high. 5 down candles in a row.
AMZN Sep 23 – Bears Drive the Tape, Eyes on 227 SupportPrice Action & Setup (1-Hour Chart)
Amazon slid hard today, breaking a string of higher lows and printing a clear lower-high, lower-low sequence. Price is sitting right at 228 support after a steady fade from the 235 area. This is now the pivot to watch. A clean hourly close below 227.5 opens the door toward 225 and possibly 222.
Momentum Read
MACD is firmly negative and widening, which confirms downside pressure. Stoch RSI is buried near oversold territory, hinting that any bounce is likely to be more of a dead-cat reaction unless momentum sharply shifts.
GEX (Options Flow) Confluence
Gamma exposure lines up with the bearish chart:
* Highest positive GEX / Call resistance: around 232.5 and 237.5
* Big Call Walls: 237.5 and 242.5 — strong upside caps if AMZN tries to rebound
* Heavy Put Walls: 228 (major support), 225, 222 (next magnets)
A decisive break under 227.5 could trigger dealer hedging to the downside, intensifying the move to 225 and even 222.
Trading Plan
* Short setup: Look for a clean hourly break under 227.5 with volume. First target 225, stretch target 222. Tight stop above 230.
* Bounce scalp: Only if price reclaims 230 with conviction; target 232.5–235, but treat it as a counter-trend trade.
Option Angle
Puts around 225 or 222 strikes can work for short-dated bearish plays if breakdown confirms. Call buyers should stay cautious until a firm reversal above 232.5 materializes.
Bottom Line
Trend bias is down. Losing 227.5 sets a clean path toward 225–222. A surprise reclaim of 230 would be the first sign bears are losing grip.
Disclaimer: This is for educational discussion only and not financial advice. Always do your own research and manage risk.

Emerging Market Impact1. Defining Emerging Markets
The term “emerging markets” (EMs) was first coined in the 1980s by Antoine van Agtmael of the International Finance Corporation to describe developing countries that offered investment opportunities.
Key Features of Emerging Markets:
Rapid Economic Growth – Higher GDP growth rates compared to developed economies.
Industrialization – Transition from agriculture-driven economies to manufacturing and services.
Urbanization – Large-scale migration from rural to urban areas.
Expanding Middle Class – Rising income levels and consumer demand.
Financial Market Development – Stock exchanges, bond markets, and banking systems are evolving.
Volatility & Risk – Political instability, weaker institutions, and external dependence.
Examples:
China & India: Asia’s powerhouses, shaping global trade and technology.
Brazil & Mexico: Latin American giants with commodity and manufacturing influence.
South Africa & Nigeria: African leaders in mining, oil, and population growth.
Turkey & Poland: Bridging Europe and Asia with strategic significance.
2. Economic Impact of Emerging Markets
Emerging markets are no longer just the “junior players” of the global economy—they are becoming growth engines.
Contribution to Global GDP
In 2000, EMs accounted for about 24% of global GDP.
By 2025, they contribute nearly 40–45% of global GDP, with China and India leading.
Consumption Power
By 2030, EMs are expected to account for two-thirds of global middle-class consumption.
Rising disposable incomes mean demand for cars, housing, technology, and branded goods.
Labor & Demographics
EMs often have younger populations compared to aging developed economies.
India, for instance, has a median age of around 28, compared to 38 in the U.S. and 47 in Japan.
This “demographic dividend” fuels productivity and innovation.
Industrial & Tech Transformation
China became the “world’s factory” over the past three decades.
India has emerged as a global IT hub.
Countries like Vietnam, Bangladesh, and Mexico are rising as new manufacturing centers.
3. Financial Impact
Emerging markets play a huge role in global financial markets, attracting foreign investment while also creating risks.
Foreign Direct Investment (FDI)
EMs attract trillions in FDI, driven by cheaper labor, large markets, and natural resources.
For example, multinational giants like Apple, Tesla, and Unilever rely heavily on EM production bases.
Stock Market Growth
Exchanges like Shanghai, Bombay, São Paulo, and Johannesburg have grown rapidly.
MSCI Emerging Markets Index is a benchmark followed by global investors.
Volatility & Risk
EM currencies (like the Indian Rupee, Brazilian Real, Turkish Lira) are prone to fluctuations.
Debt crises (Argentina, Turkey) show vulnerabilities.
Political instability often creates market shocks.
Capital Flows
EMs depend heavily on global liquidity.
U.S. interest rate hikes often lead to capital outflows from EMs, weakening currencies and causing crises (e.g., 2013 taper tantrum).
4. Trade & Globalization
Emerging markets are deeply tied to global trade flows.
Supply Chains
China dominates electronics, steel, and textiles.
Vietnam and Bangladesh are global clothing suppliers.
Mexico and Poland are key auto manufacturing hubs.
Commodities
Brazil and Argentina are agricultural superpowers.
Russia, South Africa, and Nigeria export oil, gas, and minerals.
This creates a commodity cycle linkage: when EM demand rises, commodity prices soar globally.
Trade Balances
Many EMs run surpluses due to strong exports (China, Vietnam).
Others run deficits due to import dependency (India, Turkey).
5. Social & Development Impact
Emerging markets impact society in profound ways.
Poverty Reduction: Millions lifted out of poverty in China and India.
Urbanization: Creation of megacities like Shanghai, Mumbai, São Paulo.
Education & Skills: Expanding universities and digital adoption.
Technology Leapfrogging: Africa moving directly from no-banking to mobile payments (M-Pesa).
Health Improvements: Longer life expectancy and reduced infant mortality.
However, inequality persists—rapid growth often benefits urban elites more than rural poor.
6. Geopolitical & Strategic Impact
Emerging markets are not just economic stories—they influence geopolitics.
China’s Belt & Road Initiative (BRI) expands infrastructure and political influence.
India plays a balancing role between the U.S. and China.
BRICS (Brazil, Russia, India, China, South Africa) aims to counter Western dominance.
EMs often act as swing players in global institutions (IMF, WTO, UN).
Their rising clout is shifting the balance of power from West to East and South.
7. Environmental & Sustainability Impact
Emerging markets are at the heart of the climate challenge.
They are major contributors to carbon emissions (China is #1).
At the same time, they are most vulnerable to climate change—floods, heatwaves, droughts.
Many EMs are investing in renewables (India’s solar parks, Brazil’s ethanol, China’s EVs).
ESG (Environmental, Social, Governance) investing is influencing EM companies to adopt greener practices.
8. Risks of Emerging Markets
While EMs offer opportunities, they also carry risks:
Political Instability – Coups, corruption, weak institutions.
Currency Volatility – Sharp depreciations can trigger crises.
Debt Burden – External borrowing creates vulnerability.
Trade Dependency – Heavy reliance on exports makes them vulnerable to global slowdowns.
Regulatory Uncertainty – Sudden changes in policies discourage investors.
Geopolitical Conflicts – Wars, sanctions, and trade wars hit EM economies hard.
9. Opportunities in Emerging Markets
For investors, EMs present high-growth opportunities:
Consumer Markets: Rising middle class drives demand for luxury goods, smartphones, healthcare, and education.
Infrastructure Development: Roads, ports, power plants—huge investment needs.
Digital Economy: E-commerce, fintech, mobile banking booming.
Energy Transition: Renewable energy projects are scaling fast.
Venture Capital: Startups in India, Africa, and Latin America are attracting global funding.
10. Future Outlook
By 2050, many emerging markets could dominate the global economy.
China: May remain the largest economy.
India: Could surpass the U.S. in GDP by mid-century.
Africa: With the fastest population growth, could be the new frontier.
Latin America: If political stability improves, it could rise as a major supplier of food and energy.
However, the path will not be smooth. EMs must balance growth with sustainability, strengthen institutions, and manage geopolitical tensions.
Conclusion
The impact of emerging markets is one of the most important forces shaping the 21st century. They are no longer passive participants but active shapers of trade, finance, technology, and geopolitics. Their rise has created new opportunities for businesses and investors but also introduced new risks and uncertainties.
In simple terms, the story of emerging markets is the story of the future of the global economy. They bring growth, innovation, and dynamism—but also complexity and volatility. Anyone interested in trade, finance, or policy must pay close attention to these rising economies, because their impact is already being felt everywhere—from Wall Street to Silicon Valley, from African villages to Asian megacities.
Derivatives Trading in Emerging Markets1. Understanding Derivatives in Simple Terms
A derivative is essentially a financial contract whose value is derived from an underlying asset. That asset could be anything — stocks, bonds, currencies, commodities, or even interest rates.
Think of it like this:
If you and your friend bet on whether the price of gold will go up or down next month, you’ve entered into a type of derivative contract.
The bet itself has no standalone value; it derives its worth from the movement of gold prices.
The most common types of derivatives include:
Futures Contracts – Agreements to buy or sell an asset at a fixed price on a future date.
Options Contracts – Rights (but not obligations) to buy or sell an asset at a specific price before a given date.
Forwards Contracts – Custom, over-the-counter (OTC) agreements similar to futures, but privately negotiated.
Swaps – Agreements to exchange cash flows, such as fixed interest for floating interest.
In developed economies, derivatives trading is massive. The notional value of global derivatives markets runs into hundreds of trillions of dollars. But in emerging markets, the journey is still evolving.
2. Why Derivatives Matter in Emerging Markets
Emerging markets — like India, Brazil, China, South Africa, Mexico, and Turkey — are characterized by fast economic growth, higher volatility, and developing financial institutions.
Here’s why derivatives play such a crucial role in these economies:
Risk Management (Hedging)
Commodity producers (like farmers in India or oil exporters in Brazil) face price volatility. Derivatives allow them to lock in prices and reduce uncertainty.
For example, an Indian farmer can use a futures contract on wheat to protect against falling prices during harvest.
Price Discovery
Derivatives markets help determine fair prices of commodities and financial assets. Futures on stock indices or currencies often reflect real-time demand-supply expectations.
Liquidity & Market Depth
They increase participation in markets. A liquid derivatives market often boosts liquidity in the cash (spot) market as well.
Investment Opportunities
For global investors, derivatives provide exposure to emerging market growth stories without needing to directly own local stocks or bonds.
Integration with Global Finance
Derivatives connect emerging markets with global capital flows, making them part of the broader financial ecosystem.
3. Historical Development of Derivatives in Emerging Markets
The journey of derivatives in emerging economies is relatively recent compared to the U.S. or Europe. Let’s take a quick tour:
India
India banned derivatives trading in 1952 due to speculation risks.
In 2000, it reintroduced derivatives on stock indices and later expanded into single-stock futures, options, and commodity derivatives.
Today, India has one of the largest derivatives markets in the world by volume.
Brazil
BM&F Bovespa (now part of B3 exchange) has been a pioneer in Latin America.
It introduced futures contracts on commodities like coffee and later expanded into financial derivatives.
China
Initially cautious due to speculation risks, China opened derivatives trading in the 1990s.
Today, the Shanghai Futures Exchange and China Financial Futures Exchange trade a wide range of contracts.
South Africa
The Johannesburg Stock Exchange (JSE) has a robust derivatives segment, including agricultural futures.
Turkey & Mexico
Both countries have developed active currency and interest rate derivative markets, driven by macroeconomic volatility.
The common thread? Derivatives in emerging markets often start with commodities (agriculture, metals, or energy) and later expand into financial products.
4. Key Types of Derivatives in Emerging Markets
a. Commodity Derivatives
Farmers, miners, and exporters rely heavily on futures and options.
Example: Brazil’s coffee futures, India’s gold futures, and South Africa’s maize futures.
b. Equity Derivatives
Stock index futures and options are increasingly popular.
India’s Nifty50 futures are among the most traded globally.
c. Currency Derivatives
Emerging markets often face currency volatility due to capital flows.
Currency futures (like USD/INR in India) help businesses hedge exchange rate risks.
d. Interest Rate Derivatives
Less developed compared to developed nations, but growing fast.
For example, Mexico and Turkey have active interest rate swap markets due to inflation risks.
5. Opportunities in Derivatives Trading in Emerging Markets
Emerging markets present unique opportunities for traders, investors, and institutions:
High Growth Potential
As economies grow, demand for derivatives rises.
Market Inefficiencies
Emerging markets often display mispricing due to less competition, creating arbitrage opportunities.
Commodity Exposure
Emerging economies are major commodity producers. Derivatives give exposure to commodities like oil, metals, and agriculture.
Retail Participation
In markets like India, retail investors are driving growth in equity derivatives.
Global Diversification
International investors can diversify by accessing emerging market derivatives.
6. Risks and Challenges
While the opportunities are strong, derivatives in emerging markets come with risks:
Volatility
Emerging markets often face sharp price swings due to political or economic shocks.
Regulatory Uncertainty
Policies can change overnight, restricting or liberalizing derivative trading.
Liquidity Issues
Some contracts lack depth, making it hard to exit positions.
Counterparty Risk
In over-the-counter markets, the risk of default is higher.
Speculation vs. Hedging
Regulators often worry about excessive speculation destabilizing markets.
Lack of Awareness
Many small businesses or retail traders in emerging markets don’t fully understand derivatives, leading to misuse.
7. Regulatory Landscape
Regulation plays a defining role in shaping derivative markets.
India: The Securities and Exchange Board of India (SEBI) oversees derivatives trading. It has gradually opened the market but remains cautious about speculation.
Brazil: B3 Exchange operates under the Brazilian Securities and Exchange Commission (CVM).
China: The China Securities Regulatory Commission (CSRC) keeps a tight grip, limiting speculative contracts.
South Africa: The Financial Sector Conduct Authority regulates derivatives under the JSE.
A common theme is balancing market development with financial stability. Too much speculation could cause systemic risks; too much control could stifle growth.
8. Case Studies
Case 1: India’s Nifty Derivatives Boom
Nifty index futures and options dominate global trading volumes.
Low margin requirements and high retail participation fueled this growth.
Case 2: Brazil’s Coffee Futures
Brazil is the world’s largest coffee producer. Coffee futures contracts in São Paulo provide global benchmarks for pricing.
Case 3: China’s Cautious Path
China introduced stock index futures in 2010 but imposed heavy restrictions after the 2015 market crash. This shows the delicate balance regulators maintain.
9. The Future of Derivatives in Emerging Markets
The next decade could see explosive growth in emerging market derivatives:
Digital Platforms & Fintech
Online trading apps will democratize access.
ESG & Green Derivatives
New contracts may emerge around carbon credits and renewable energy.
Cross-Border Trading
Greater integration with global exchanges.
Blockchain & Smart Contracts
Could reduce counterparty risks and improve transparency.
Retail Power
Just like in India, retail traders will drive volume growth in many countries.
10. Conclusion
Derivatives trading in emerging markets is both a story of promise and caution. On one hand, these instruments help farmers, exporters, and investors hedge against volatility, improve price discovery, and connect to global finance. On the other, misuse and over-speculation can destabilize fragile economies.
For investors, derivatives in emerging markets are not just about chasing profits — they are about understanding the heartbeat of fast-growing economies. As regulations mature, technology spreads, and education improves, these markets could very well become the engines of global derivatives growth.
Short AMZN finished with pinbar candleThe market is in position for a correction.
There is a similar pinbar pattern on the weekly, like the previous drop.
Expecting a drop in AMZN to materialize.
Look at the daily, there was a gap down on earnings, a warning of what is coming ahead.
If long, we would expect after the gap close, to continue higher, especially after Fed announcement about the interest rate.
Since it did not materialize to the long side, then the hypothesis of long, is now invalid.
Hence, the hypothesis of short, is more likely.

Using Amazon as an example to write about intrinsic valueThe beautiful thing about equities, is that we can determine what the stock should be worth based on the future cash flows the company generates. It is called intrinsic value and professional investors often use this calculation to help them make higher quality decisions. The primary method of calculation is called discount cash flow. When building a DCF model is is recommended to use Wall Streets estimates to keep an unbiased opinion.
Understanding the concept of discount cash flow, is like understanding the calculations behind any technical indicator, the thing about intrinsic value is that it is a fundamental indication not just technical. Equities go up, because companies are generating cash flows. Unlike commodities, which are only valued based on the general consensus of voters.
It was Benjamin Graham the father of value investing who said, in the short term the market is a voting machine, but in the long term the market is a weighing machine. There is a fantastic book I read called The Intelligent Investor written by Benjamin Graham I highly recommend giving it a read if your serious about making money in the market over the long term.
Intrinsic value is the fundamental, true worth of an asset or business, as determined by an objective analysis of its financial performance and future cash flow potential. It is a crucial concept for investors, especially value investors, who use it to identify assets that are undervalued or overvalued by the market.
Focusing on fundamentals helps investors avoid overpaying for assets and reduces the risk of permanent capital loss. If a stock's market price is significantly lower than its calculated intrinsic value, it may be undervalued and a good buying opportunity. The difference is often called a "margin of safety". Intrinsic value is based on an asset's long-term potential, encouraging a focus on sustainable growth and stability rather than short-term market noise.
Now onto Amazon stock, according to my model the intrinsic value of Amazon is as of this writing $260 meaning that fundamentally it is still undervalued. Take this with a grain of salt because if you create a model using the discount cash flows of the company over the next 5 or 10 years you might get wildly different results. This is why it is essential to understand the calculation for yourself instead of just taking my word for it. This is a highly speculative calculation, it can also become relatively complicated.
Lets compare two individuals performance over the course of their career, I would like to write about Dr. Al Brooks, often referred to as the king of price action by CME group, and Warren Buffett, one of the most successful investors and richest men in the world. Al Brooks, the day traders net worth is about $750 million dollars over the course of his career in the market. Warren Buffett has a net worth of about $150 billion dollars. One is a trader, the other an investor. So where am I going with this?
Everyone wants to get rich quick, everyone starts thinking they will be a trader. 90% of traders permanently lose their capital never to make it back and often times quitting participating in the market. The 10% of traders who are actually profitable, aren't making as much money as you would think, as per the comparison above. The average investor over the course of their lifetime will make 150x more money than the best traders. For me, I fell into the 90% category, trading didn't work for me, after reading The Intelligent Investor, the money starting coming into my account almost effortlessly.
Dear reader, this article was written by me for my own entertainment. Please do not take anything I have written too literally, always do what works best for you and always remember, whatever your doing, you should be having fun. Cheers
Risk vs Reward: How Positional Traders Manage Market SwingsChapter 1: The Nature of Positional Trading
1.1 Defining Positional Trading
Positional trading is a strategy where traders hold positions for extended periods, often ranging from several weeks to several months, with the goal of capturing larger price movements. Unlike intraday or swing traders, positional traders are less concerned with short-term noise. Instead, they rely on broader fundamental themes, technical trends, and macroeconomic cycles.
1.2 Characteristics of Positional Trading
Time Horizon: Longer than swing trading but shorter than long-term investing.
Analysis: Combination of technical indicators (trendlines, moving averages, volume profile) and fundamental analysis (earnings, global events, monetary policy).
Risk Tolerance: Moderate to high, since positions are exposed to overnight and weekend risks.
Capital Allocation: Positions are often larger than swing trades, requiring strict risk management.
1.3 Why Traders Choose Positional Trading
Ability to capture big moves in trending markets.
Lower stress compared to day trading (fewer trades, less screen time).
Flexibility to balance trading with other commitments.
Opportunity to benefit from structural themes such as interest rate cycles, technological disruptions, or geopolitical developments.
Chapter 2: The Core Principle – Risk vs Reward
2.1 Understanding Risk
In trading, risk is not just the possibility of losing money—it also includes the uncertainty of outcomes. For positional traders, risk manifests as:
Price Volatility: Sudden swings due to earnings reports, macroeconomic data, or geopolitical events.
Gap Risk: Overnight or weekend news causing sharp market gaps.
Trend Reversal: A strong uptrend suddenly turning bearish.
Opportunity Cost: Capital locked in a stagnant trade while better opportunities emerge elsewhere.
2.2 Understanding Reward
Reward refers to the potential gain a trader expects from a trade. For positional traders, rewards typically come from:
Riding long-term trends (e.g., a bullish rally in technology stocks).
Capturing multi-month breakouts in commodities or currencies.
Benefiting from sectoral rotations where capital shifts between industries.
2.3 The Risk-Reward Ratio
A foundational tool for positional traders is the risk-reward ratio (RRR), which compares potential profit to potential loss. For example:
If a trader risks ₹10,000 for a possible gain of ₹30,000, the RRR is 1:3.
A higher RRR ensures that even if several trades go wrong, a few winning trades can offset losses.
Most positional traders aim for a minimum of 1:2 or 1:3 risk-reward ratios to sustain profitability.
Chapter 3: Market Swings – The Double-Edged Sword
3.1 What Are Market Swings?
Market swings refer to sharp upward or downward price movements over short to medium periods. They are caused by factors like:
Earnings surprises
Central bank announcements
Political instability
Global commodity price shocks
Investor sentiment shifts
3.2 Friend or Foe?
For positional traders, market swings can be:
Friend: Accelerating profits when positioned correctly.
Foe: Triggering stop-losses and eroding capital when caught off-guard.
3.3 The Positional Trader’s Dilemma
Market swings often force traders into a psychological tug-of-war:
Should they hold through volatility in hopes of a larger trend?
Or should they exit early to preserve gains?
The right answer depends on risk appetite, conviction in analysis, and adherence to strategy.
Chapter 4: Tools of Risk Management
4.1 Stop-Loss Orders
The most basic and effective tool for limiting downside risk.
Hard Stop-Loss: A predefined price level where the position is exited.
Trailing Stop-Loss: Moves upward (or downward in shorts) as the trade becomes profitable, locking in gains while allowing room for continuation.
4.2 Position Sizing
Deciding how much capital to allocate per trade is crucial. A common rule is risking no more than 1-2% of total capital on a single trade. This prevents a single loss from wiping out the account.
4.3 Diversification
Holding positions across different asset classes or sectors reduces exposure to idiosyncratic risks. For example, combining technology stocks with commodity trades.
4.4 Hedging
Advanced positional traders may use options, futures, or inverse ETFs to hedge risks. For instance, buying protective puts while holding long equity positions.
4.5 Patience and Discipline
No tool is more important than discipline. Sticking to pre-defined plans and resisting the urge to overreact to market noise often separates successful traders from the rest.
Chapter 5: Strategies to Maximize Reward
5.1 Trend Following
Using moving averages, MACD, or ADX to identify strong directional trends.
Entering trades in alignment with the broader trend rather than against it.
5.2 Breakout Trading
Entering trades when an asset breaks through a key resistance or support level with high volume.
Positional traders often ride multi-month breakouts.
5.3 Fundamental Catalysts
Aligning trades with earnings cycles, government policies, or macroeconomic themes.
Example: Investing in renewable energy stocks during a policy push for green energy.
5.4 Sector Rotation
Shifting positions as capital flows between sectors.
Example: Moving from banking to IT during periods of rate cuts.
5.5 Pyramid Positioning
Adding to winning trades gradually as trends confirm themselves.
Ensures exposure grows only when the market supports the thesis.
Chapter 6: Psychology of Positional Trading
6.1 The Fear of Missing Out (FOMO)
Traders often chase after rallies late, increasing risk. Successful positional traders resist this urge and wait for setups aligned with their strategies.
6.2 Greed vs. Discipline
Holding too long for extra gains can turn profits into losses. Discipline ensures profits are booked systematically.
6.3 Handling Drawdowns
Market swings inevitably lead to losing streaks. Accepting drawdowns as part of the journey helps maintain mental balance.
6.4 Patience as a Weapon
Unlike day traders, positional traders must often endure long periods of stagnation before trends materialize. Patience is not passive—it is an active tool in their arsenal.
Chapter 7: Lessons for Traders and Investors
Risk is inevitable but manageable – Market swings cannot be eliminated, but tools like stop-losses and diversification reduce their impact.
Reward requires patience – Larger profits are earned by holding through volatility, not by constantly jumping in and out.
Discipline beats prediction – Following rules matters more than correctly forecasting every swing.
Adaptability is key – Global events can shift markets suddenly; traders must be flexible.
Psychology is half the battle – A calm, patient mindset sustains traders through market storms.
Conclusion
Positional trading is not about avoiding market swings—it is about managing them. Every swing presents both a threat and an opportunity. The difference lies in how traders handle them. Those who respect risk, apply disciplined strategies, and patiently wait for reward tend to emerge stronger, while those swayed by fear, greed, or impulsiveness often fall behind.
The essence of risk vs reward in positional trading is best captured as a dance: risk sets the rhythm, reward provides the melody, and discipline keeps the trader moving in sync. In a world where markets will always swing—sometimes violently—the art lies not in predicting every move but in managing exposure, aligning with trends, and staying calm in the face of uncertainty.
For anyone seeking to thrive as a positional trader, the golden rule remains: protect your downside, and the upside will take care of itself.
Amazon (AMZN) BUYAmazon (AMZN), through AWS, is a hidden giant in AI. Its cloud division provides everything from custom AI chips to scalable machine learning platforms, which are used by start-ups and Fortune 500s alike.
AMZN: Eyeing 240 After a Healthy Pullback – Swing & Scalp Sep 171-Hour Chart Technical View
Amazon’s 1-hour chart shows a well-defined rising channel after breaking out from a mid-September base near $226. The stock tagged $234 and is now easing off slightly—a normal pullback inside a fresh uptrend. MACD momentum is flattening but still positive, and Stoch RSI is cooling from overbought levels, signaling a short-term breather rather than a trend change.
* Immediate Support: $232.5 and $231.4 (key intraday demand)
* Major Support: $226.3 HVL (Sept 19 zone)
* Upside Zone: $237.5 to $240 is the near-term target area; a breakout could carry to $242.5–$245
The 9 EMA remains above the 21 EMA, confirming bullish structure as long as $231.4 holds.
GEX & Options Flow
Options positioning shows constructive call-side pressure:
* Call Walls: $237.5 (3rd call wall), $240 (highest positive NET GEX / gamma resistance), then $242.5–$245.
* Put Support: $222.5 and $217.5 mark major downside hedges.
* GEX Bias: Positive gamma with 25.4% calls and IVR at 8.8 (IVx ~31.3) indicate moderate premium costs and a controlled upward bias.
This configuration generally encourages dip-buying and limits sharp downside unless $231 gives way.
Trade Thoughts & Suggestions
* Swing Idea: Buy pullbacks into $232.5–$231.4 with a stop below $230, aiming for $237.5–$240, with $242.5–$245 as a stretch target.
* Scalp Idea: Focus on quick reversals near $231.4 for long entries, or scalp a breakout if $237.5 is taken out with strong volume.
* Bearish Scenario: A decisive break under $230 could shift bias toward $226.3 and lower.
Quick Take
AMZN’s trend is firm and supported by bullish gamma. For Sept 17, dips toward $232 are attractive for intraday scalps and swing entries aiming for a retest of $240 and beyond.
Disclaimer: This analysis is for educational purposes only and does not constitute financial advice. Always do your own research and manage risk before trading.

Amazon Is Up 44% Since April, But Its Chart Looks ProblematicAmazon NASDAQ:AMZN has been in an upward-sloping trend since early April, but the e-commerce giant is trailing the S&P 500 SP:SPX year to date and has fallen some 4% since its February all-time peak. Let's look at what the stock's chart says.
Amazon and the Macro Environment
Many would find it difficult to take on a short position or liquidate a long one on a major tech stock like Amazon just as Wall Street expects the Federal Reserve to pivot toward a significantly more-dovish policy stance.
But remember, Amazon is more than just a tech stock. It's also a major online retailer, the owner of a high-end brick-and-mortar grocer (Whole Foods), parent of a major consumer-discretionary product (Amazon Prime Video) and more.
Would it be as difficult to take a short position or liquidate a long one in such a name as the Fed goes into a dovish stance amid a U.S. labor market that's markedly weaker than anyone knew?
After the U.S. Bureau of Labor Statistics recently issued as massive downward annual to its Apil 2024/March 2025 job-creation numbers, Chief Bloomberg U.S. Economist Anna Wong argued that America could already be in a recession.
"When all the revisions for 2024 and 2025 are complete -- we won't get the final revisions until early 2026 and 2027 -- we expect they'll show the business cycle peaked around April 2024," she said.
"It's possible the economy is either still in recession, or is in the early phase of a new business cycle," said Wong, who formerly served as principal economist for the Federal Reserve Board.
It's not every day that a highly respected economist talks about backdating a recession by a year and half. That would be potentially bad news for a consumer-focused company like Amazon.
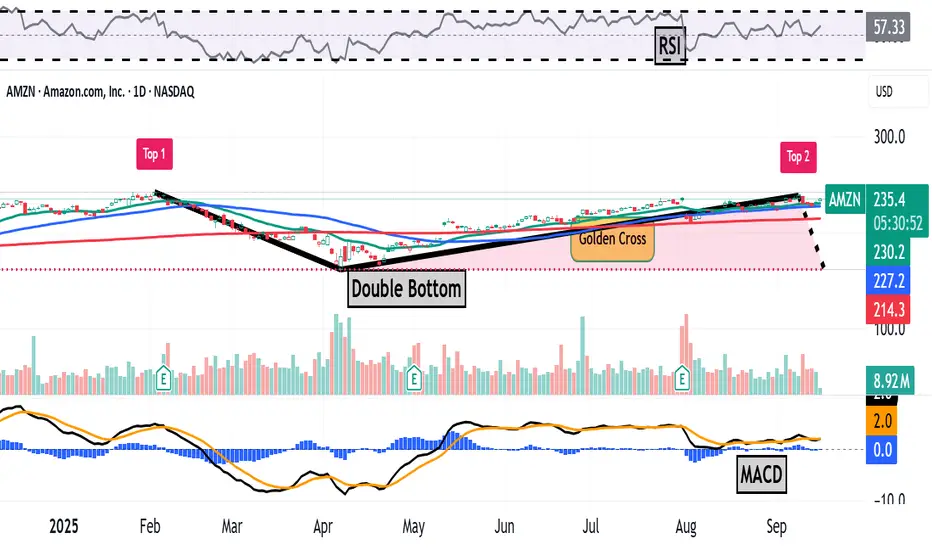
Amazon's Technical Analysis
Now let's look at Amazon's year-to-date chart as of Wednesday:
There are two patterns under development, both potentially bearish.
Readers will first note the potential development of a very large "double-top" pattern of bearish reversal, marked with two red boxes in the chart above.
This pattern's downside pivot would be way down at $161 vs. the $232.54 that AMZN was trading at Tuesday morning.
That would be a long way to go just to reach a pivot, and would also put a so-called "double-bottom" pattern into play.
Meanwhile, Amazon's chart also shows another potentially bearish set-up in the works with a more realistic pivot:
This chart shows an almost-completed "rising-wedge" pattern of bearish reversal with a realistic downside pivot that just happens to be Amazon's 50-day Simple Moving Average (or "SMA," marked with a blue line above).
Th 50-day SMA line is currently running alongside the rising-wedge pattern's power trendline. Amazon is also seeing potential support at its 200-day SMA (the red line above) as well.
However, the chart above shows what happened the last time AMZN came out of a rising wedge this past February, as marked with a purple-shaded area at the chart's left.
The stock fell nearly 30% from about $225 during February's third week to a $161.38 52-week low on April 7.
Meanwhile, Amazon's other technical indicators in the above chart don't tell us much just yet.
For instance, the stock's Relative Strength Index (the gray line at the chart's top) is still better than neutral, but sliding towards mediocrity.
Separately, AMZNs daily Moving Average Convergence Divergence indicator (or "MACD," marked with black and gold lines and blue bars at the chart's bottom) is still technically postured bullishly -- but has some issues.
The histogram of Amazon's 9-day Exponential Moving Average (or "EMA," marked with blue bars) is still positive, but the 12-day EMA (the black line) is curling down towards the 26-day EMA (the gold line). A cross-under there would be a short- to medium-term bearish signal for the stock.
(Moomoo Technologies Inc. Markets Commentator Stephen “Sarge” Guilfoyle had no position in AMZN at the time of writing this column.)
This article discusses technical analysis, other approaches, including fundamental analysis, may offer very different views. The examples provided are for illustrative purposes only and are not intended to be reflective of the results you can expect to achieve. Specific security charts used are for illustrative purposes only and are not a recommendation, offer to sell, or a solicitation of an offer to buy any security. Past investment performance does not indicate or guarantee future success. Returns will vary, and all investments carry risks, including loss of principal. This content is also not a research report and is not intended to serve as the basis for any investment decision. The information contained in this article does not purport to be a complete description of the securities, markets, or developments referred to in this material. Moomoo and its affiliates make no representation or warranty as to the article's adequacy, completeness, accuracy or timeliness for any particular purpose of the above content. Furthermore, there is no guarantee that any statements, estimates, price targets, opinions or forecasts provided herein will prove to be correct.
Moomoo is a financial information and trading app offered by Moomoo Technologies Inc. In the U.S., investment products and services on Moomoo are offered by Moomoo Financial Inc., Member FINRA/SIPC.
TradingView is an independent third party not affiliated with Moomoo Financial Inc., Moomoo Technologies Inc., or its affiliates. Moomoo Financial Inc. and its affiliates do not endorse, represent or warrant the completeness and accuracy of the data and information available on the TradingView platform and are not responsible for any services provided by the third-party platform.
International Payment Gateways1. Introduction
In today’s digital economy, global trade is no longer limited to large corporations. From small businesses to freelancers, millions of people engage in cross-border transactions every day. A consumer in India can order a gadget from the U.S., a freelancer in Africa can work for a client in Europe, and a retailer in Asia can sell to buyers worldwide. The lifeline that makes all this possible is the International Payment Gateway (IPG).
At its core, an international payment gateway is the digital bridge that securely facilitates financial transactions between buyers and sellers across borders. It ensures that when a customer pays in one country, the funds are processed, converted, and settled appropriately in the seller’s account, regardless of geographic location.
This article explores the concept of international payment gateways in detail—what they are, how they work, their benefits, challenges, and future outlook.
2. What is an International Payment Gateway?
An International Payment Gateway (IPG) is a technology platform that allows merchants and businesses to accept payments from customers around the world. It acts as a middleman between the merchant’s website (or app) and the bank or financial network that processes the payment.
Key Functions
Authorization – Verifies whether the customer has sufficient funds or credit.
Authentication – Confirms the legitimacy of the transaction and prevents fraud.
Processing – Transmits transaction details securely to banks or card networks.
Settlement – Transfers the funds to the merchant’s bank account.
Currency Conversion – Converts customer payments into the merchant’s preferred currency.
In simple words, a payment gateway is like a virtual cash register for online businesses, but with global reach.
3. Evolution of International Payment Gateways
The journey of payment gateways has evolved alongside the growth of e-commerce:
1990s – Early days of online shopping, simple credit card processors emerged.
2000s – Rise of PayPal and other digital wallets made cross-border payments easier.
2010s – Mobile payments, API-driven gateways (like Stripe), and global reach.
2020s and beyond – Blockchain-based solutions, AI-driven fraud prevention, and seamless multi-currency wallets dominate the market.
Today, gateways not only process payments but also provide fraud protection, analytics, compliance, and global settlement infrastructure.
4. How International Payment Gateways Work
Let’s simplify the complex flow of cross-border transactions into steps:
Step 1: Customer Initiates Payment
A customer selects a product/service and chooses a payment method (credit card, debit card, digital wallet, UPI, PayPal, etc.).
Step 2: Encryption
The gateway encrypts sensitive information (card details, banking info) to ensure security.
Step 3: Routing to Processor
The data is sent to the acquiring bank (merchant’s bank) via the gateway.
Step 4: Communication with Card Networks
The acquiring bank sends the request to the card network (Visa, Mastercard, Amex, etc.), which then routes it to the issuing bank (customer’s bank).
Step 5: Authorization
The issuing bank checks funds, fraud risks, and authenticity before approving or declining.
Step 6: Response Sent Back
The authorization result is sent back through the same chain—card network → acquiring bank → gateway → merchant website.
Step 7: Settlement
If approved, funds are deducted from the customer’s account, converted into the merchant’s currency if needed, and deposited into the merchant’s bank account (usually within a few days).
5. Features of International Payment Gateways
Modern international gateways offer a wide range of features:
Multi-Currency Support – Customers can pay in their own currency.
Multiple Payment Methods – Credit cards, debit cards, wallets, bank transfers, cryptocurrencies.
Fraud Prevention – AI-driven monitoring, 3D Secure authentication, tokenization.
Compliance – Adheres to PCI DSS (Payment Card Industry Data Security Standard) and regional regulations.
Recurring Billing – Useful for subscriptions and SaaS businesses.
Mobile Integration – Seamless payments on apps and mobile sites.
Analytics & Reporting – Insights into transactions, chargebacks, and customer behavior.
6. Types of International Payment Gateways
There are several categories of gateways based on their functionality and business models:
1. Hosted Gateways
Redirect customers to the gateway’s payment page (e.g., PayPal, Razorpay checkout).
Easy to integrate, but less control over user experience.
2. Integrated Gateways
Customers enter payment details directly on the merchant’s site.
Requires PCI compliance but offers better branding and user experience.
3. API-Based Gateways
Offer advanced flexibility, customization, and direct integration with apps/websites.
Examples: Stripe, Adyen.
4. Localized Gateways
Cater to regional markets with local currency and payment methods.
Example: Alipay (China), Paytm (India).
5. Cryptocurrency Gateways
Enable payments via Bitcoin, Ethereum, or stablecoins.
Examples: BitPay, CoinGate.
7. Major Players in the International Payment Gateway Industry
Some leading international payment gateways include:
PayPal – Global leader in cross-border digital wallets.
Stripe – Popular with startups and developers for API-based integration.
Adyen – Enterprise-focused, used by companies like Uber and Spotify.
Worldpay – Long-standing provider with global reach.
Authorize.Net – One of the earliest online payment gateways.
2Checkout (now Verifone) – Multi-currency global payments.
Alipay & WeChat Pay – Dominant in China.
Payoneer – Widely used for freelancer payments worldwide.
Razorpay, PayU, CCAvenue – Strong players in India.
8. Benefits of International Payment Gateways
For businesses and consumers, these gateways bring immense advantages:
For Businesses
Access to global customers.
Increased sales through diverse payment methods.
Automated conversion and settlement in preferred currency.
Fraud protection and security compliance.
Easy integration with websites, apps, and e-commerce platforms.
For Customers
Convenience of paying in local currency.
Wide choice of payment methods.
Secure and fast transactions.
Global access to products and services.
9. Challenges of International Payment Gateways
Despite their benefits, IPGs face challenges:
High Transaction Fees – Cross-border fees, currency conversion, and settlement charges can be expensive.
Regulatory Compliance – Different countries have varying rules (KYC, AML, data protection).
Fraud & Chargebacks – International transactions are riskier and prone to disputes.
Currency Volatility – Exchange rate fluctuations affect settlements.
Technical Integration – API complexity and ongoing maintenance can be challenging.
Limited Accessibility – Some regions lack reliable banking or digital infrastructure.
10. International Payment Gateway Regulations
To operate globally, gateways must adhere to strict rules:
PCI DSS Compliance – Ensures cardholder data protection.
KYC (Know Your Customer) & AML (Anti-Money Laundering) – Prevents illicit financial activities.
GDPR (General Data Protection Regulation) – Governs data privacy in the EU.
Local Regulations – RBI (India), FCA (UK), SEC (US), etc.
Conclusion
International Payment Gateways are the unsung heroes of the digital economy. They ensure that whether you’re a small Etsy seller in India, a freelancer in Africa, or a corporation in America, you can send and receive payments globally with just a few clicks.
While challenges like high fees, fraud risks, and regulatory hurdles remain, the benefits far outweigh them. As technology advances—with blockchain, AI, and digital currencies—payment gateways will become even faster, cheaper, and more secure.
In essence, International Payment Gateways are not just about payments—they are about enabling global trade, financial inclusion, and the future of borderless commerce.

AMZN 1H + GEX Game Plan for Tue, Sep 16AMZN Compressing Under 239 Gamma Wall — Breakout or Reversal? 🚀
Market Structure (1-Hour View)
* Current action: Amazon is consolidating inside a mild rising channel after rebounding from ~225 support.
* Trend context: Price is holding above short-term trendline support near 228–229, but momentum is flattening after an early push.
* Momentum: MACD rolling over with shrinking histogram; Stoch RSI near the lower zone — suggesting a pause or small dip before the next move.
Key Levels to Watch
* Resistance: 233.7–234.0 (intraday lid), 239.0 (big gamma wall / call resistance), and 244.0 (stretch target).
* Support: 228.1–226.3, with stronger demand around 225.0 (major gamma pivot).
GEX Read (Sep 16)
* Highest positive NETGEX / Gamma resistance: 239.0
* 2nd Call Wall: 244.0, 3rd near 250–255.
* Put walls / magnets: 225.0 (big HVL and gamma support), then 215.0–210.0.
* Options sentiment: Calls ~24%, IVR ~8.9, IVx ~31 → moderate implied volatility, option premiums relatively low.
Implication:
* Dealers may aim to pin AMZN between 225 and 239 unless a fresh catalyst breaks the range.
* Break above 234 with strong volume sets up a squeeze toward 239 and potentially 244.
* Lose 226 and price can drift toward 225 and possibly 215.
Trade Scenarios
1) Bullish Breakout
* Trigger: Hourly close >234 with clear momentum uptick.
* Entry: 234–235 on retest.
* Targets: 239 → 244.
* Stop: Below 231.5.
Options: 235/239 call debit spread for this week.
2) Range Fade
* Trigger: Failure to hold above 233.5 with a rejection wick.
* Entry: 233 short.
* Targets: 228 → 226.
* Stop: Above 235.
Options: 233P or 233/226 put spread for a quick fade.
3) Breakdown
* Trigger: 1H close <226 with failed retest.
* Entry: 225.5 short.
* Targets: 222 → 215.
* Stop: Above 228.
Options: 225/215 put spread if momentum accelerates.
Scalping & Swing Notes
* Early session watch 231–233: acceptance above leans long; repeated rejection favors short scalps back to 228.
* EMA/VWAP retests that hold above 229–230 offer low-risk long entries.
Risk & Management
* Low IV makes debit call spreads efficient.
* Use tight stops if fading near 234–239, as a break above 239 can trigger fast gamma-driven upside.
This analysis is for educational purposes only and does not constitute financial advice. Always manage risk and trade your own plan.

$AMZN - bottom of the channel bounce hereAMZN - Stock bouncing off bottom of the channel. on high watch if move higher here we can see top of the channel at $250. Stock has all time highs at $242.52 area. could see that break soon post Rate cut.