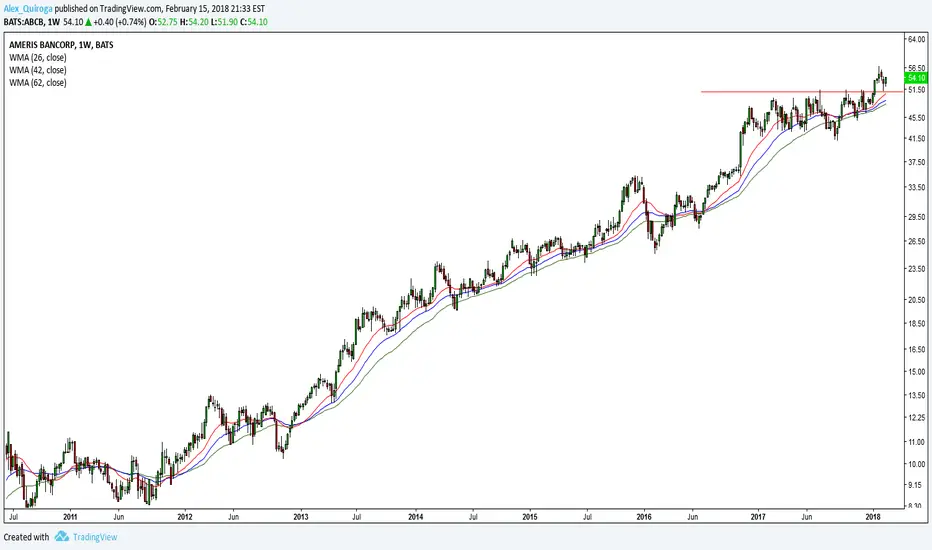
ABCB - Inverted H&S and Symmetrical TriangleLarger inverted H&S structure, angled.
Symmetrical triangles can be assumed if price begins to rise, favouring continuation
Expecting continuation and bullish results along the trend line of the H&S
AXU trade ideas

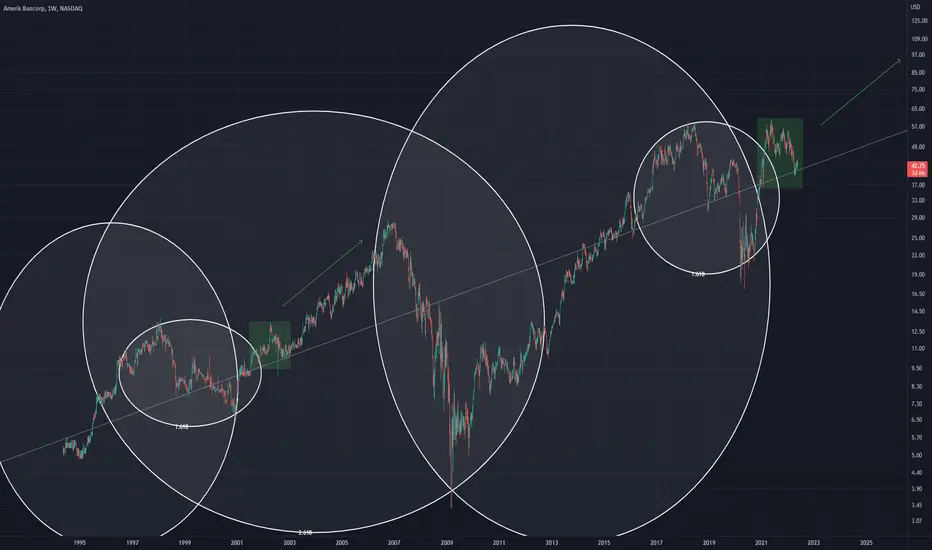
ABCB Similar Points (Fib Circles)Comparing two points along a major trend line
They can be compared due to there position relative to the previous fib circle
also in there structure aswell
I expect movement to follow how the green arrow moved in the earlier scenario


ABCB Triple bottom - looking bright*Trading idea*
Looking at a triple bottom chart pattern on $ABCB
The price has broken through the neckline and is looking good to move upwards into the next 3 Fibonacci levels based on the MACD.
The final profit target I'm looking at is at the golden ratio Fibonacci level 0.618.
TP1 @ 29.53 (0.382 Fib)
TP2 @ 32.41 (0.50 Fib)
TP3 @ 35.28 (0.618 Golden ratio)
Happy trading

Ameris Bancorp Announces Quarterly Dividend Increase and New StoABCB: Ameris Bancorp
2019-09-19 16:05:00
Ameris Bancorp Announces Quarterly Dividend Increase and New Stock Repurchase Program


Ameris Bancorp Announces $100 Million Stock Repurchase ProgramABCB: Ameris Bancorp
2018-10-25 07:00:00
Ameris Bancorp Announces $100 Million Stock Repurchase Program

Survivor of the biggest point drop In History #6 (ABCB)Resistance broken ready, pullback ready, swing low ready
That is all
ABCB setting up again and nearing an advanced pivotABCB is closing in on an advanced pivot that is clearly visible on both the daily and the weekly charts. When pivots are visible on multiple time frames they stand a better chance at working.
Here's the setup...
SETUP: 2nd stage flat base
Classic Pivot : 47.70
Advanced Pivot : 45.15
Support : 42.75 and rising 50dma/10wk line
**note** 50dma and 10wk line is catching up to support at 42.75 which should help make that level more reliable.
RS line is below the 30 period moving average which is slightly troubling BUT if ABCB is able to rally, we'll likely see the RS line breakout as well.
**other points** take a look at the weekly chart. The week of 12/19 (the 2nd down week in the base) was a positive reversal off the 42.75 support level. It came on high weekly volume and price closed high in the weekly range. This is a good sign of support.
ABCB is another idea discovered from our scanner ChartYourTrade MRI .

ABCB looking ready to break out of a flat baseThere are a few things I like about this setup:
All moving averages are accelerating
The RS line is near highs
Price action is tightening as we approach the pivot
Clear support along the 50dma so far
Strong industry group (top 50 per IBD) and other stocks setting up within the group
Earnings is already out of the way
I see the pivot as being the recent high of 36.31 and the nearest support level as 35. There is an ascending trend line drawn on the daily chart which also seems to be offering an area of support.


