Car dealership bubbleBubble guy :D funny name, but i love puts more then calls.
Car business was and still doing very very well, high demand, higher prices, and more premium profit.
the problem is, car dealership providers are showing more inventory and steady sales growth in term of finance not in the number of cars so
Next report date
—
Report period
—
EPS estimate
—
Revenue estimate
—
30 EUR
471.11 M EUR
19.26 B EUR
12.54 M
About Group 1 Automotive, Inc.
Sector
Industry
CEO
Daryl A. Kenningham
Website
Headquarters
Houston
Founded
1995
ISIN
US3989051095
FIGI
BBG000G8RLV4
Group 1 Automotive, Inc. engages in the automotive retailing industry. The firm also sells new and used cars and light trucks, arranges related vehicle financing, sells service contracts, provides automotive maintenance and repair services, and sells vehicle parts. It operates through the United States and the United Kingdom geographical segments. The company was founded in 1995 and is headquartered in Houston, TX.
Related stocks

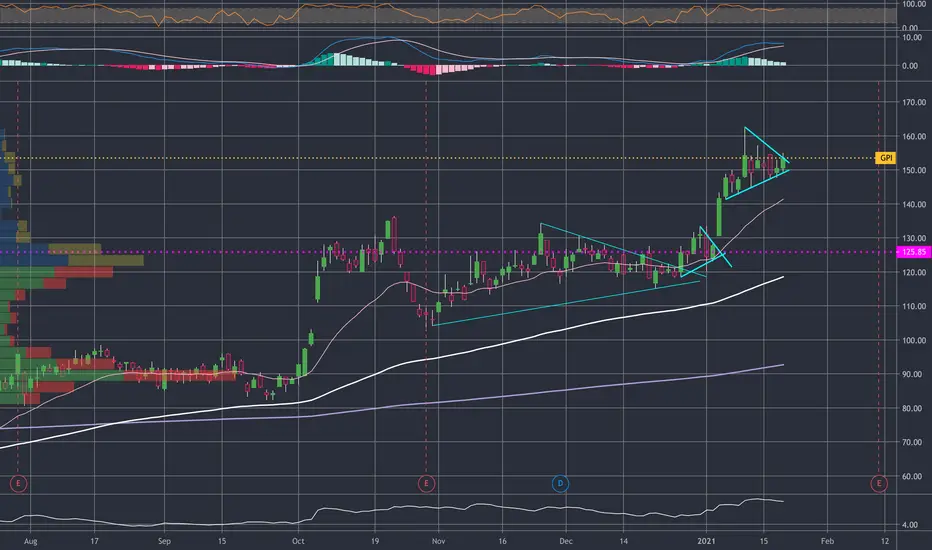
GPI - Breakout The wider car dealer group made strong moves yesterday. (see names like AN / ABG etc)
Looking for entry but missed the move yesterday.

Fundamental Analysis on GPIHey friends! Happy Sunday and welcome to my post on fundamental analysis on NYSE:GPI .
NYSE:GPI (Group 1 Inc) owns and operates 49 collision centers and 191 automotive dealerships across 248 franchises in the U.S., the U.K., and Brazil, offering 33 brands of automobiles altogether. U.S. locati

$GPI #GPI when all failed , this going and going love the way candle set in this winning pattern
PalalalalalalalHH


Trend Reversal? GPIWaiting for 50 & 200 MA confirmation in the 2 hr chart. Interesting setup. Good luck!

GPI, tightVery tight. Going through scans to see what held up in todays pullback. This one looks nice. Pretty tight. Will watch.


See all ideas
An aggregate view of professional's ratings.
Neutral
SellBuy
Strong sellStrong buy
Strong sellSellNeutralBuyStrong buy
Neutral
SellBuy
Strong sellStrong buy
Strong sellSellNeutralBuyStrong buy
Neutral
SellBuy
Strong sellStrong buy
Strong sellSellNeutralBuyStrong buy
Displays a symbol's price movements over previous years to identify recurring trends.
GPI5859236
Group 1 Automotive, Inc. 6.375% 15-JAN-2030Yield to maturity
5.71%
Maturity date
Jan 15, 2030
GPI5025302
Group 1 Automotive, Inc. 4.0% 15-AUG-2028Yield to maturity
4.48%
Maturity date
Aug 15, 2028
See all GAV bonds
Frequently Asked Questions
Depending on the exchange, the stock ticker may vary. For instance, on FWB exchange Group 1 Automotive, Inc. stocks are traded under the ticker GAV.
We've gathered analysts' opinions on Group 1 Automotive, Inc. future price: according to them, GAV price has a max estimate of 460.94 EUR and a min estimate of 361.86 EUR. Watch GAV chart and read a more detailed Group 1 Automotive, Inc. stock forecast: see what analysts think of Group 1 Automotive, Inc. and suggest that you do with its stocks.
Yes, you can track Group 1 Automotive, Inc. financials in yearly and quarterly reports right on TradingView.
Group 1 Automotive, Inc. is going to release the next earnings report on Oct 28, 2025. Keep track of upcoming events with our Earnings Calendar.
GAV earnings for the last quarter are 9.82 EUR per share, whereas the estimation was 8.92 EUR resulting in a 10.15% surprise. The estimated earnings for the next quarter are 9.14 EUR per share. See more details about Group 1 Automotive, Inc. earnings.
Group 1 Automotive, Inc. revenue for the last quarter amounts to 4.84 B EUR, despite the estimated figure of 4.79 B EUR. In the next quarter, revenue is expected to reach 4.83 B EUR.
GAV net income for the last quarter is 117.32 M EUR, while the quarter before that showed 116.56 M EUR of net income which accounts for 0.65% change. Track more Group 1 Automotive, Inc. financial stats to get the full picture.
Yes, GAV dividends are paid quarterly. The last dividend per share was 0.43 EUR. As of today, Dividend Yield (TTM)% is 0.46%. Tracking Group 1 Automotive, Inc. dividends might help you take more informed decisions.
Group 1 Automotive, Inc. dividend yield was 0.45% in 2024, and payout ratio reached 5.11%. The year before the numbers were 0.59% and 4.21% correspondingly. See high-dividend stocks and find more opportunities for your portfolio.
As of Oct 17, 2025, the company has 20.41 K employees. See our rating of the largest employees — is Group 1 Automotive, Inc. on this list?
EBITDA measures a company's operating performance, its growth signifies an improvement in the efficiency of a company. Group 1 Automotive, Inc. EBITDA is 936.60 M EUR, and current EBITDA margin is 5.13%. See more stats in Group 1 Automotive, Inc. financial statements.
Like other stocks, GAV shares are traded on stock exchanges, e.g. Nasdaq, Nyse, Euronext, and the easiest way to buy them is through an online stock broker. To do this, you need to open an account and follow a broker's procedures, then start trading. You can trade Group 1 Automotive, Inc. stock right from TradingView charts — choose your broker and connect to your account.