my idea about NASDAQthe price is hitting the resistance line and also the FIBB RECTR LINE so i expect the price is going down
NAQ trade ideas

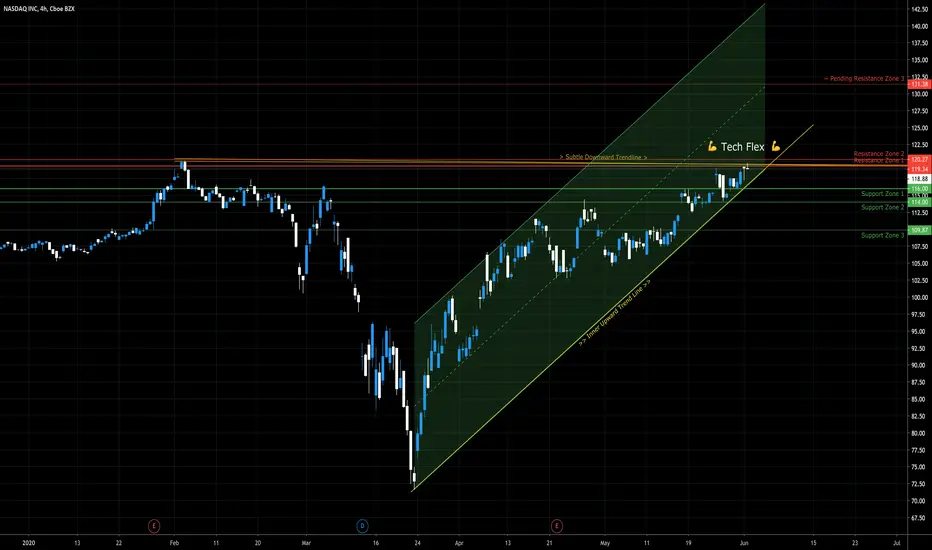
NASDAQ TECH FLEXNDAQ is having a bit of an electric surge and could push ATH (all time highs) amid the pandemic playing out. Tech for the win it seems during times of uncertainty to save the day.
Bears are getting a bit of a slaughtering here as many are turning to and being more reliant on technology than ever before.
A forethought is that smart money in other US markets will leave these stagnate companies to flow into high tech tech firms, due to FOMO thus NASDAQ will hit ALL TIME HIGHS.
Keep in mind that this also makes the economy look stronger yet soo many more are staggery than ever before since the start of 2020 due to the flow on effects of covid and the recession that no one is clearly speaking about that’s been teeter totting since mid last year. (You can’t polish a turd)
NDAQ looks good here for a continuation upwardNDAQ is in a bullish ascending triangle and looks great to break out at 115.50+


Nasdaq, Inc. (NDAQ) long.All description on the chart.
Please, don't forget to like and follow.
Thank you.


NASDAQ's Powerfull Daily UptrendNASDAQ has been outperforming all the other big indices and it's pretty impressive. The series of higher highs and higher lows keeps going, and by the looks of it NASDAQ will print a higher high by the end of next week. That makes the NASDAQ the most easy index to trade in this volatile market.
The CHOP index has been charging up for a next move. If the previous high (green dotted line) gets taken out, I'll go long without a doubt!

NAS100 ANALYSESIT WILL BREAK THE MINOR RESISTANCE TOWARDS HEADING TOWARDS THE MAJOR RESISTANCE ZONE WHICH MEANS WE WILL BE LOOKING FOR BUYING OPPOTURNITIES WHEN THE MARKETS OPEN DURING THE EARLY HOURS OF MONDAY


NASDAQ, Triangle Forming, Bearish Breakout More Likely! Hello, Traders Investors And Community And welcome to this analysis about the current situation facing the NASDAQ INC INDEX and what we can expect the next hours and days. There are some important and significant signs I detected in observing the overall current price-structure and which will determine the further outcome. We are looking at the locally 4-hour timeframe. And at the beginning, it has to be said that NASDAQ is one of the strongest major indices at the moment compared to the SPX and DJI which printing bearish signs and already confirmed on the middler-term to the downside. In this case, the NASDAQ is close to its all-time-high and did not already confirm bearish to the downside but it is printing some bearish signs which should not be ignored.
In my chart, you can see that NASDAQ at the moment trades in a triangular shape which is marked in blue at my chart, the importance now is that this is a symmetrical triangle which can break to the up or downside when confirmed rightly, in this case, there is a higher probability given that we will break to the downside because NASDAQ is forming a bear-flag in the symmetrical triangle which gives the overall formation a more bearish than bullish shape, which should also be kept in mind is that we ran into strong resistance levels here and the other major indices already ran bearish to the downside, this can indicate that the NASDAQ will follow.
The bear-market is still not confirmedly over and although NASDAQ looks like the most bullish one of all the major indices with the current highs near to its all-time-high there still can follow more downside. At the moment we need to elevate and see if the good and prosperous uptrend established can continue to the upside or that more bearish supply pressure enters the market. In case that we break the current triangle with good volume and volatility to the upside, there is a good likelihood for NASDAQ given that it will take out its all-time-highs but that is not the most likely scenario currently because we have more bearish than bullish signs in the triangle.
After the triangle target at 96.7 is reached when the triangle confirmed rightfully we need to consider if NASDAQ can stabilize at this level and move higher or if the bearish pressure is too high and it continues more to the downside. It is also possible that we get some little bounces in this area and after that moving down again so we need to watch for a clear reversal that signals growth and the take out of highs in the structure here. When the bullish stabilization does not set in we need to prepare ourselves for more possible downside as the corona-restrictions and economy-damage can increase again when a second wave develops, therefore we need to elevate ourselves above mere speculation and do not get overly excited on possible bullishness, in this case, it is more important than always to trade what we see not what we think.
Thanks for watching, support for more market insight, and all the best.
There are many roads to prosperity, but one must be taken.
Information provided is only educational and should not be used to take action in the markets.

May Nasdaq Buy (Height) But Jun Nasdaq Drop (Sell)May Nasdaq Buy (Height) But Jun Nasdaq Drop (Sell)


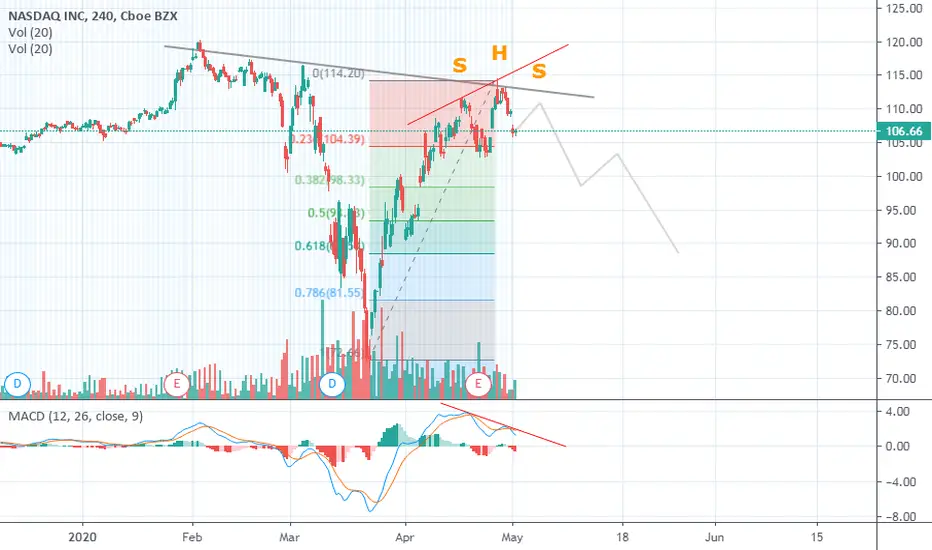
NASDAQ appearing Bearish in several charts.Just like SPX500 the chart has made already a shooting star and a hammer on the weekly chart.
On the 4h chart possible SHS formation, or we may see a drop already today when the market open.
Possible Covid-19 second wave coming.
Very volatile market in May with no big companies showing reports.
And there's the old saying:
"Sell in May and run away, come back on St. Ledger day"
NASDAQ Bullish Reversal confirmationHi!
I have to look at all possibilities. I can't marry a bias even though I have been bearish of late. Despite all the red you are seeing in the market today. The TA side confirms we have broken the 786 fib AND we retested the TL support. These are two key factors in confirming a uptrend. The 786 fib is important for confirmation of a TREND REVERSAL. This can be confirmation of a new bull market. I know. Despite what is going on in the world. This is crazy. It is manipulated by the fed. But I can't argue what I see in front of me.
Alex

Short NASDAQ!Please follow my channel for strong and accurate signal and support the idea by like.
NASDAQ is ramping a bearish momentum trend.

NASDAQ ENDING DIAGONALUS NDAQ is in a five wave structure with a potentially ending diagonal. Lets watch to see how the market plays out.
Disclaimer: This is only an idea and should not be taken as a trading signal.

15 YEAR NASDAQ WEEKLY at HUGE Resistance - Selloff coming??Title says it succinctly right there. Similar chart that I posted for S&P. But even more impressive to me.
Details: This 15 YEAR WEEKLY chart shows MACD on top and Price on bottom. For those BULLS saying we have a V shaped recovery and the market is going higher look at this WEEKLY chart and resistance levels. Notice that weekly 39 EMA correlates well with market direction for the last 20 years.
On the MACD the Blue line shows its JUST above ZERO which is a NEW weekly uptrend.....REALLY?? (These are just 2 ways to show trend direction and resistance and support)
Anyway, Notice that we are at a band of horizontal resistance (light blue lines) and at the SAME TIME rising uptrend top/resistance of one of the upper channel.
Selloff coming?? I think very soon. Good luck.


NDAQ - BULLSEYE!* Remember to support with LIKE and FOLLOW me for more analysis *
NDAQ is performing very well, rising more than 5% since my last analysis. If you missed my call, you can check it here (and follow me to keep in touch, I do daily analysis):
The daily chart shows us a harami/hammer pattern, just above the 21 ema, indicated to us that the bulls arrived at the party:
The target for the daily chart is the green line, the optimal for a Head and Shoulders pattern.
Now let’s see how strong the bulls can be. If you look at the hourly chart, the price met the target of the double bottom (Eve & Eve double bottom), demonstrated by the blue lines. So, it’s a nice place for a pullback, but if the bulls are strong enough, that may not happen at all. Nevertheless, I’m taking some profits now.
Congratulations for those who did the trade, and if you are out, no worries, certainly more opportunities will come. Remember to FOLLOW me and LIKE this idea if it helped you.
* LIKE this idea and FOLLOW me, because:
- Here, you will see clean charts;
- Trades with clear risk management;
- The best of Dow Theory, Price Action and Candlestick psychology;
- Chart patterns with statistics. *
* My name is Nathan, I'm a trader and portfolio manager and I'm here to LEARN. Leave your COMMENT and FOLLOW me to keep in touch. *


Information consume attention I]n an information-rich world, the wealth of information means a dearth of something else: a scarcity of whatever it is that information consumes. What information consumes is rather obvious: it consumes the attention of its recipients. Hence a wealth of information creates a poverty of attention and a need to allocate that attention efficiently among the overabundance of information sources that might consume it. (Simon 1971, pp. 40–41) Wikipedia
― Herbert Simon
Are we not living in an excessive abundant of information overflow today ? The depth and breadth of information that one can find on any topic online is beyond one's imagination. And as in trading, things have also evolved compared to 20 years ago.
We have now more indicators than before, more robot trading systems that you can think of and more ways to dissect the information available. Is this good or bad ? I think it is good for those who wants to have more information to help them understand at different levels. Imo, I think it can be way too much to use or rather been thrown at you when you used this information for trading/investment. It not only takes away your attention, leading you to rabbit holes that you are not supposed to go to. You end up miles away from your intended purpose and possibly may trade other products as well.
That explains why I have given up on all other indicators like RSI, MACD, Stochastic , Bollinger, Moving averages, Volume, so on and so forth. Just these few alone drawn on a chart can elicit confusing messages and thus it paralyse my thinking, make me more fearful of trading as if I need more certainty and more confirmation each time.
No matter how we slice or dice the game of trading, it is nothing but a game of probability. Till now, there are two camps, the bulls who believe all bad news are already factored in and the stock market fuelled by fiscal and monetary policies are ready to soar again. There is no turning back as evidenced on the chart.
The bears , however felt that the disappointing and bad data like jobless claims , declining GDP growth, recessionary pressure, bankruptcy, etc are brewing into a storm and will hit the market soon. That means, this reversal we are seeing now is nothing but a dead cat bounce.
Only time will prove who's right ! As of now, the bulls are winning as we see no stopping of the ferocious bulls charging up and up, much to the delight of the buyers and disappointment of the sellers.
Then, we have analysts that compare charts to the 1930's and also others who quote different indicators to show the resistance and so on. Tons of information are found online and constantly updated.
You , as a trader must draw a line and decide how much is enough before you use whatever available information you have and make a decision out of it.
In my case, it is the same old techniques I have used over the past years - trend lines, support and resistance, price action. Even this alone, I need more practice to truly master it and be good at it.
And like I have said quite a lot on my posting as well is the psychology of trading that is the hidden enemy. Not the jobless claims or President Trump tweets. Those are external circumstances.
The rules are crystal clear but the person executing the rules is a human being and he has emotions. And this emotions can run havoc on some days and mess up your trading game. In some way, I was lead or mislead to think the recovery is fake and probably a dead cat bounce (only time will tell) so I gather more and more information to justify to myself that I am right.
This is where I flout my own rules of trading. Just because I have been doing it daily does not mean I will not make mistakes. In fact, complacency sets in and the need to be cautious and trade according to the rules (simple rules) are taken for granted and the smart aleck in me would want to bend the rules. We think we are better , we know the rules well and want to control it. We end up with losses, painful lessons and a bruised ego.
Like Ray Dalio said, we need pain and reflection in order to progress. I am thankful to TV for creating this platform which allows me to reflect my thoughts in a naked way and allow criticism and feedbacks for checks and balance.
In this chart and it would be the same for DJI and SPX500, we are reaching the level where the price fell hard. In this case, it is 116.73. That means, if you have bought at the bottom or near bottom, watch out for the resistance, take some profits and watch closely.
For those who are late into the buying, I suggest you to be careful if you want to trade, perhaps 1H or 15 mins chart for a short run up. Short sellers will be awaiting at this level to bring the house down. Next week will be exciting , let's see how it turns out !

NASDAQ – A good, technical trend.After NDAQ triggered this Head & Shoulders, the target of this pattern is the 116.19 (green line). Now, we see a pullback, and today the price met the 21 ema and formed a harami / hammer. It is very good, and if triggered could be a very good, quick trade, with a clear stop and nice risk/gain relationship.
I wish it would sink a little lower, to 100 point region (blue line), because it served as support and resistance alike in the past (green squares). But we should work with we got. The low volume of today’s candle is a little disturbing, so, keep your eyes open.
The hourly chart gives us more clues about what’s next. There are two supports here, the red line and the blue line (which is the same from the daily chart). If it goes down that region, the pullback will continue a little further.
1H chart:
We can also see a double bottom here (Eve & Eve double bottom), that could take the price easily to 111. The setup here is simple: If the price breakout the 106, and the candle closes above, it is a long trade. This pattern has 66% chances of a pullback rate, so prepare yourself.
If it helped you, support the idea and follow me for more analysis.
Thank you. Good trades.
