$FTV with a neutral outlook following its earnings #Stocks The PEAD projected a Neutral outlook for $FTV after a Negative under reaction following its earnings release placing the stock in drift D with an expected accuracy of 60%.
F03 trade ideas

$FTV with a Bullish outlook following its earnings #Stocks The PEAD projected a Bullish outlook for $FTV after a Positive Under reaction following its earnings release placing the stock in drift A with an expected accuracy of 100%.

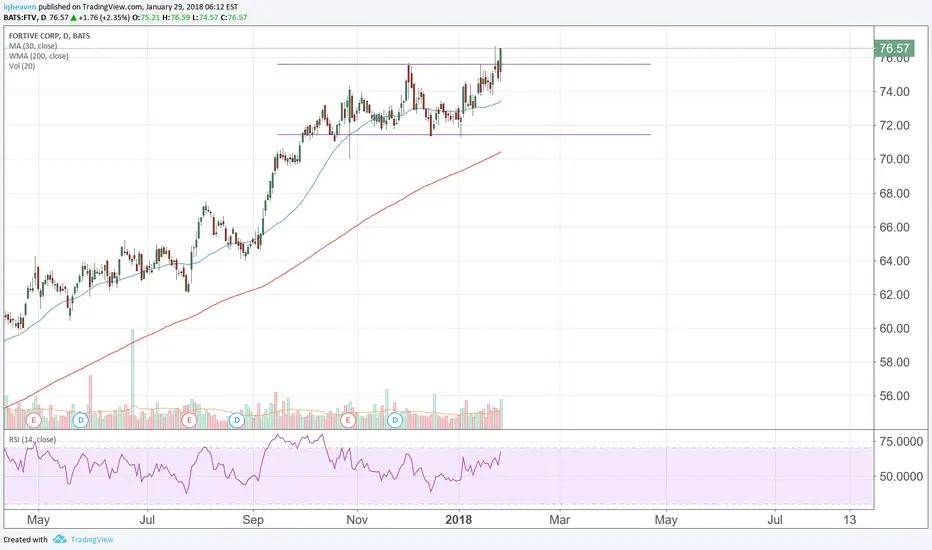
FTV BullishLinear regression channel is sloped up and the current price broke above the regression line and the 200 SMA after testing support at $62
OBV is turning up as is the Force Index (13), (2) and the MACD.
On the ADX the D+ just crossed the D- which is very bullish.
Stop: 2 X ATR
Target : 69.02 (prior high)

FTV: W-bottom applicable?A W-bottom pattern might be developing.
A price action 53.50 supports a bullish trend direction.
Crossing below this level will negate the bullish stance.
Further bullish trend support above 55.00.
Consolidation from 54.50 to 56.00.
Crossing above 56.00 might target 58.00.
Crossing below 54.50 will be the first sign of weakness.
MACD crossover (lower panel) supports a bullish trend direction.

$FTV with a Bullish outlook following its earnings #Stocks The PEAD projected a Bullish outlook for $FTV after a POsitive over reaction following its earnings release placing the stock in drift B.


FTV breakout* Strong earnings
* Broke out of resistance from 2019
* Broke out with 29.72% more than average volume
* Not too far away from its mean


FTV - Short Setup Indicator Notes- Weak Twiggs money flow
Special Note- Huge isider selling from veries directors, Millions of shares worth totaling over a Billion USD.

FTV - 13.01% Potential Profit - Ascending TriangleUptrend Support with a bullish pennant forming about to breakout.
Target price set at new uptrend resistance line.
- 5-month uptrend support
- RSI and STOCH well above 50
- MACD well above Signal
Suggested Entry $74.36
Suggested Stop Loss $72.33
Target price $83.89
Note that I tend to adjust stop losses in order to secure profits early and preserve capital. This means that the target price is going to be achieved as long as there are no strong pullbacks that trigger my new adjusted stop loss.

Picture FORTIVE CORPHey my friends, FORTIVE CORP is on a bullish slant, propability of a push on the trend line to breakout the consolidation zone see a fallout at the end of the session.
Please LIKE & FOLLOW, thank you!
All signals say long on Fortive CorpThe price of Fortive Corp has recently crossed over the historical support/resistance at 62.81 and the MACD looks optimistic, has just crossed over the 9 EMA, and shows convergence. I expect the 50 SMA to cross over the 100 SMA very soon and the RSI looks still ok.
VF Investment cannot be held responsible for any financial damages suffered from following our well-funded but personal opinions and trading ideas.
Please, maintain proper position sizing and risk management!

FTV, Fortive Corp. - Rectangle PatternNYSE:FTV
A rectangle pattern is typically a consolidation pattern and is an area where the price is trading in a range confined between two approximately horizontal lines which represent support and resistance respectively.

FTV Bottom FormationFTV has quickly developed a bottom formation even while High Frequency Traders attempt to run the stock down further. Hidden Dark Pool Quiet Accumulation is moving price upward.


$FTV Rising Wedge - Unusual Options Activity$FTV Fortive forming what looks like a bearish rising wedge on the daily chart. Reminds me a lot of a NVDA chart I posted on Jun 14th just before the stock dropped 10+% in a matter of 1-2 weeks. FTV target $76 by mid-September.
Also of note, some very bearish unusual options activity today . A couple October straddle plays with premium heavily weighted on the Put side. (see below)
1) 8,000 Oct $110 calls for $480,000 with 8,000 Oct $110 puts for $23M (deep ITM)
2) 19,000 Oct $100 calls for $19,000 with 19,000 Oct $100 puts for $35M (deep ITM)
These net out to about a $57M bearish bet on FTV by October.
Note: Informational analysis, not investment advice.

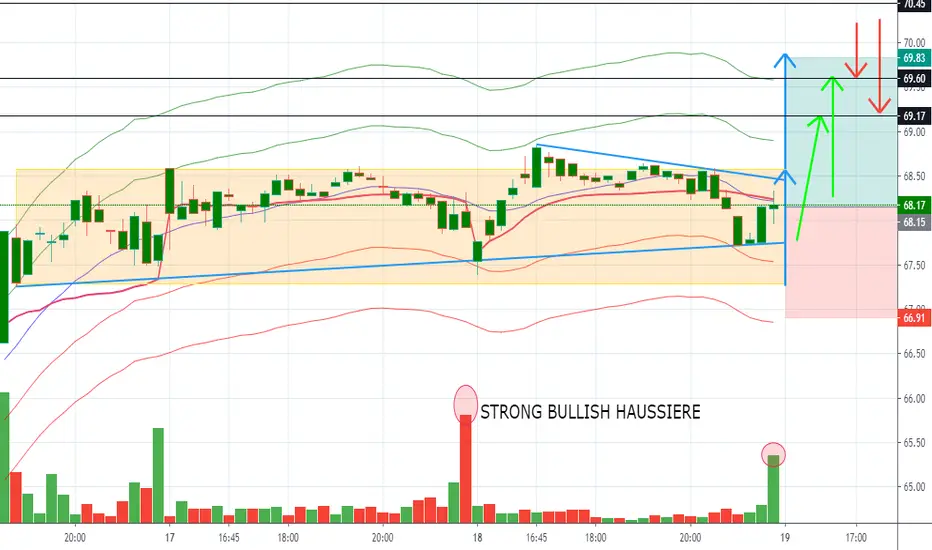
FTVSo, prise break out consolidation
Target - nest consolidation
I prefer small stop, but you can use wide stop(zone 69.95 - 69.85)