Novo Nordisk – 40-Year Supercycle Breakdown (Monthly)After nearly four decades inside a rising secular channel, Novo Nordisk broke below it for the first time ever in July 2025 . Since then, two consecutive monthly closes below the channel — coupled with two consecutive closes under the monthly EMA 100 (previously flawless support) — confirm a m
Key facts today
Next report date
—
Report period
—
EPS estimate
—
Revenue estimate
—
3.34 EUR
13.50 B EUR
38.82 B EUR
3.16 B
About Novo Nordisk A/S Class B
Sector
Industry
CEO
Maziar Mike Doustdar
Website
Headquarters
Bagsværd
Founded
1923
ISIN
DK0062498333
FIGI
BBG00FZMFB99
Novo Nordisk A/S is a global healthcare company, which engages in the discovery, development, manufacturing and marketing of pharmaceutical products. It operates through the Diabetes and Obesity Care, and Rare Disease segments. The Diabetes and Obesity Care segment includes diabetes, obesity, cardiovascular, and emerging therapy areas. The Rare Disease segment refers to rare blood disorders, rare endocrine disorders, and hormone replacement therapy. The company was founded by Harald Pedersen and Thorvald Pedersen in 1923 is headquartered in Bagsværd, Denmark.
Related stocks

$NVO – Completed Supercycle, ABC Correction Underway (Monthly)www.tradingview.com
Redrew the long-term channel to fit the entire price history — and every major swing since the 1980s now aligns perfectly within it.
Within this structure, NYSE:NVO appears to have completed a clear 5-wave advance (1987–2023). The impulsive phase looks mature, and the price

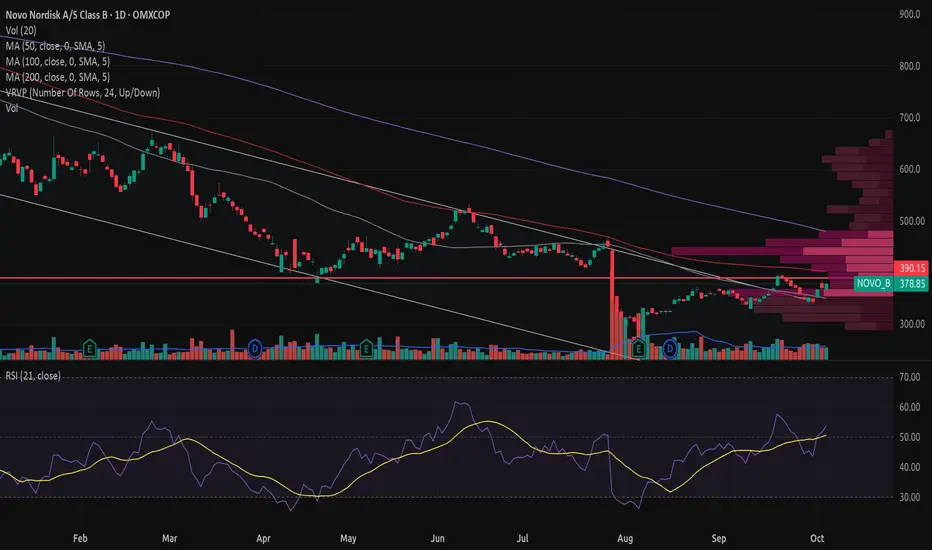
Is Novo breaking out of a falling trend channel?In 2024, Novo formed a head–shoulder pattern with a breakdown at the end of September. Since then, the stock has been moving within a falling trend channel until now.
On September 18 this year, the stock broke above the trend channel by 6–7% on increased volume. It has since pulled back to test the
$NVO end of bearish trend. - NYSE:NVO has exited the bearish trend and very soon it will be doing a trend reversal and enter a new trend.
- if it consolidates, trade sideways or up is yet to be seen.
- However, if a stock exits such a prominent downtrend then move to the upside after breakout is explosive.
- Fundamentals

Safe play for the next five years?Using the historical data on the log proves the lifetime trend for this stock. I believe this is a good buy for the long run.

Novo Nordisk Setup – Is This the Pharma Sector’s Strongest Play?🚀 NVO "Novo Nordisk" – Wealth Strategy Map (Swing/Day Trade)
📈 Trade Plan (Bullish Setup)
Trend Confirmation: The bullish trend is supported by Dow Theory accumulation phase 📊.
Candle Signal: A Heikin Ashi Doji has formed, adding confluence to the setup.
Indicator Alert: LSMA (Least Squares Moving A

NVO: Awakening a Sleeping GiantNovo Nordisk (NVO) has been through a turbulent period marked by political pressure, leadership transition, and volatile price action. Once a dominant growth leader, the stock entered a prolonged downtrend, losing nearly two-thirds of its value from its highs. But beneath the surface, critical stru

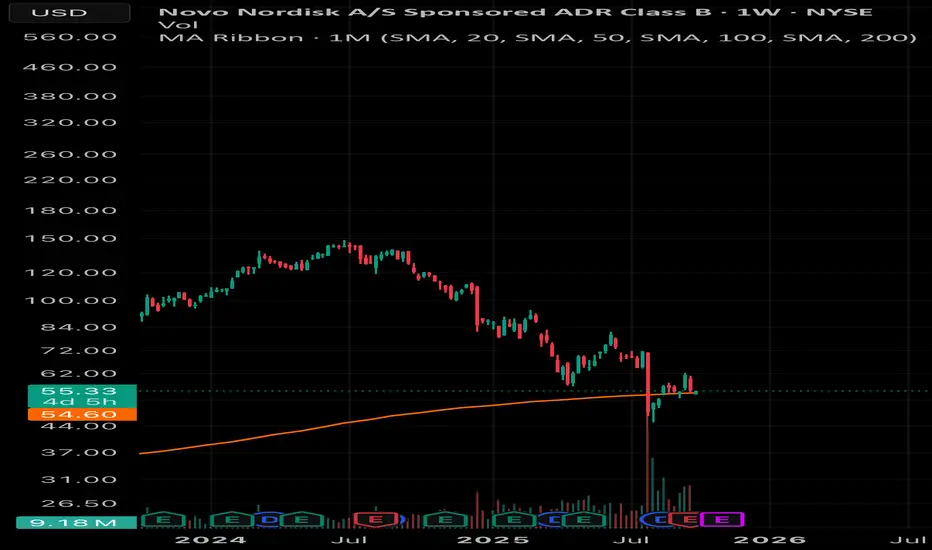
NVO-Zoom out perspectiveThe 3 months price candle recently closed, with long wick below, candle closed nicely just above the historic 100 SMA on 1 month timeframe line.
Appeared that there were strong buying pressure under the trend line (below $55)
I believed that we are likely at local bottom and about to reverse to th

NVO-If this hold, may be last chance to be greedyWe had a small dip, back to the SMA 100 on monthly timeframe for second time it the past few week.
If thai hold again, exploding upward movement will come
NVO-Still strugglingSadly we did not break through and got rejected from the Down trend resistance.
Next support levels,
$45 previous low
$37-35 next accumulation zone and 200 SMA monthly Time frame
Prepare to buy more if we goes down

See all ideas
Summarizing what the indicators are suggesting.
Neutral
SellBuy
Strong sellStrong buy
Strong sellSellNeutralBuyStrong buy
Neutral
SellBuy
Strong sellStrong buy
Strong sellSellNeutralBuyStrong buy
Neutral
SellBuy
Strong sellStrong buy
Strong sellSellNeutralBuyStrong buy
An aggregate view of professional's ratings.
Neutral
SellBuy
Strong sellStrong buy
Strong sellSellNeutralBuyStrong buy
Neutral
SellBuy
Strong sellStrong buy
Strong sellSellNeutralBuyStrong buy
Neutral
SellBuy
Strong sellStrong buy
Strong sellSellNeutralBuyStrong buy
Displays a symbol's price movements over previous years to identify recurring trends.
N
XS300255582
Novo Nordisk Finance (Netherlands) BV 3.625% 27-MAY-2037Yield to maturity
3.54%
Maturity date
May 27, 2037
N
XS282046075
Novo Nordisk Finance (Netherlands) BV 3.375% 21-MAY-2034Yield to maturity
3.24%
Maturity date
May 21, 2034
N
XS300255353
Novo Nordisk Finance (Netherlands) BV 3.125% 27-MAY-2033Yield to maturity
3.08%
Maturity date
May 27, 2033
N
XS282045567
Novo Nordisk Finance (Netherlands) BV 3.25% 21-JAN-2031Yield to maturity
2.82%
Maturity date
Jan 21, 2031
N
XS300255329
Novo Nordisk Finance (Netherlands) BV 2.875% 27-AUG-2030Yield to maturity
2.73%
Maturity date
Aug 27, 2030
XS244124704
Novo Nordisk Finance (Netherlands) BV 1.375% 31-MAR-2030Yield to maturity
2.65%
Maturity date
Mar 31, 2030
N
XS300255299
Novo Nordisk Finance (Netherlands) BV 2.375% 27-MAY-2028Yield to maturity
2.57%
Maturity date
May 27, 2028
N
XS282045460
Novo Nordisk Finance (Netherlands) BV 3.125% 21-JAN-2029Yield to maturity
2.52%
Maturity date
Jan 21, 2029
N
XS282044994
Novo Nordisk Finance (Netherlands) BV 3.375% 21-MAY-2026Yield to maturity
2.42%
Maturity date
May 21, 2026
XS234803042
Novo Nordisk Finance (Netherlands) BV 0.125% 04-JUN-2028Yield to maturity
2.39%
Maturity date
Jun 4, 2028
XS244933017
Novo Nordisk Finance (Netherlands) BV 1.125% 30-SEP-2027Yield to maturity
2.26%
Maturity date
Sep 30, 2027
See all NOV bonds
Curated watchlists where NOV is featured.


Frequently Asked Questions
The current price of NOV is 48.75 EUR — it has decreased by −1.19% in the past 24 hours. Watch Novo Nordisk A/S Class B stock price performance more closely on the chart.
Depending on the exchange, the stock ticker may vary. For instance, on GETTEX exchange Novo Nordisk A/S Class B stocks are traded under the ticker NOV.
NOV stock has fallen by −4.11% compared to the previous week, the month change is a 6.61% rise, over the last year Novo Nordisk A/S Class B has showed a −56.01% decrease.
We've gathered analysts' opinions on Novo Nordisk A/S Class B future price: according to them, NOV price has a max estimate of 80.17 EUR and a min estimate of 40.09 EUR. Watch NOV chart and read a more detailed Novo Nordisk A/S Class B stock forecast: see what analysts think of Novo Nordisk A/S Class B and suggest that you do with its stocks.
NOV stock is 3.36% volatile and has beta coefficient of 1.56. Track Novo Nordisk A/S Class B stock price on the chart and check out the list of the most volatile stocks — is Novo Nordisk A/S Class B there?
Today Novo Nordisk A/S Class B has the market capitalization of 221.68 B, it has increased by 12.50% over the last week.
Yes, you can track Novo Nordisk A/S Class B financials in yearly and quarterly reports right on TradingView.
Novo Nordisk A/S Class B is going to release the next earnings report on Nov 5, 2025. Keep track of upcoming events with our Earnings Calendar.
NOV earnings for the last quarter are 0.80 EUR per share, whereas the estimation was 0.79 EUR resulting in a 0.46% surprise. The estimated earnings for the next quarter are 0.67 EUR per share. See more details about Novo Nordisk A/S Class B earnings.
Novo Nordisk A/S Class B revenue for the last quarter amounts to 10.28 B EUR, despite the estimated figure of 10.29 B EUR. In the next quarter, revenue is expected to reach 10.27 B EUR.
NOV net income for the last quarter is 3.54 B EUR, while the quarter before that showed 3.89 B EUR of net income which accounts for −8.86% change. Track more Novo Nordisk A/S Class B financial stats to get the full picture.
Novo Nordisk A/S Class B dividend yield was 1.83% in 2024, and payout ratio reached 50.28%. The year before the numbers were 1.35% and 50.35% correspondingly. See high-dividend stocks and find more opportunities for your portfolio.
As of Oct 15, 2025, the company has 76.3 K employees. See our rating of the largest employees — is Novo Nordisk A/S Class B on this list?
EBITDA measures a company's operating performance, its growth signifies an improvement in the efficiency of a company. Novo Nordisk A/S Class B EBITDA is 21.50 B EUR, and current EBITDA margin is 50.95%. See more stats in Novo Nordisk A/S Class B financial statements.
Like other stocks, NOV shares are traded on stock exchanges, e.g. Nasdaq, Nyse, Euronext, and the easiest way to buy them is through an online stock broker. To do this, you need to open an account and follow a broker's procedures, then start trading. You can trade Novo Nordisk A/S Class B stock right from TradingView charts — choose your broker and connect to your account.
Investing in stocks requires a comprehensive research: you should carefully study all the available data, e.g. company's financials, related news, and its technical analysis. So Novo Nordisk A/S Class B technincal analysis shows the sell today, and its 1 week rating is sell. Since market conditions are prone to changes, it's worth looking a bit further into the future — according to the 1 month rating Novo Nordisk A/S Class B stock shows the sell signal. See more of Novo Nordisk A/S Class B technicals for a more comprehensive analysis.
If you're still not sure, try looking for inspiration in our curated watchlists.
If you're still not sure, try looking for inspiration in our curated watchlists.