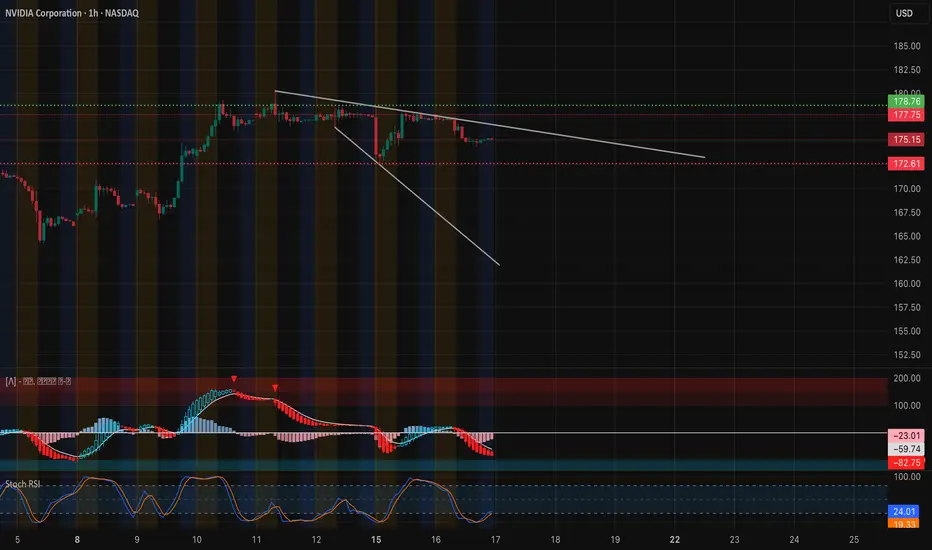
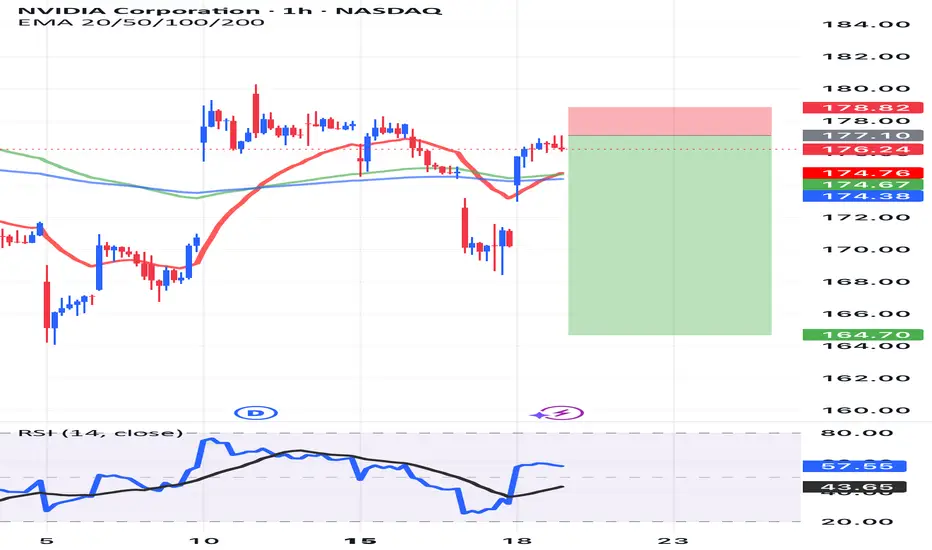
NVDA Sep 22 Game Plan – “Grinding Up or Topping Out?”1️⃣ Big Picture on the 1-Hour Chart
* Price action: NVDA closed Friday around 176.07, sitting right on a short-term rising trend line. Price has been stair-stepping higher off the 172 area, but momentum is flattening.
* Key levels:
* Resistance: 178.60–180 (recent high & big call wall)
* Support: 175–172.5 (trendline & gamma pivot)
* Indicators:
* MACD on the hourly is rolling over – still above zero but losing steam.
* Stoch RSI is down near oversold and trying to curl, so a quick bounce isn’t off the table.
This paints a neutral-to-slightly-bullish short-term picture: the uptrend is alive, but it’s late in the cycle unless buyers step in hard at the open.
2️⃣ GEX / Options Flow
* Call concentration shows heavy walls near 178.6–180.
* HVL (High Volume Level) is sitting near 172.5, which often acts like a magnet if price slips.
* Below that, 167.5 and 165 are the next notable put supports.
* IVR is low (around 3), so options are relatively cheap if you’re looking at quick plays.
This means market makers may want to pin NVDA in the 175–180 zone early in the week. Breaks above 180 could squeeze toward 182.5+ fast, but a fail back under 175 risks a slide to 172.5 and maybe 170.
3️⃣ Trading Thoughts & Suggestions
* Scalp / day trade: Watch for a clean break of 178.6–180 with volume. If it holds, 182–183 is the next scalp target. Tight stop under 177.5.
* Fade setup: If early strength gets rejected hard at 178.6–180 and the trendline breaks, short ideas toward 175 → 172.5 make sense.
* Swing idea: Only interested in swings if we close >180 with confirmation; otherwise, chop is more likely.
4️⃣ Bottom Line
NVDA is at a decision spot. A quick pop above 180 could spark a mini gamma squeeze. Failure there with a trendline break drags it back toward 172.5 or even 170. I’ll let Monday’s first hour dictate the bias.
Disclaimer: This is just market opinion for educational discussion. It’s not financial advice. Always manage your own risk before trading.
NVDG trade ideas
NVDA SELLIf you have not SELL NVDA, than be prepare to SELL NVDA riding it back down to 93.00 to 77.00 as Profit Targets, Stop Loss will be determine later!
If anyone likes long mumbo jumbo garbage analysis, than this is NOT for you.
Also, if you are afraid of risk, failure, and want only a 100% sure thing, than
run as fast as you can from the market, because the market is NOT a sure thing,
so it is definitely NOT for you.
WARNING: This is just opinions of the market and its only for journaling purpose. This information and any publication here are NOT meant to be, and do NOT constitute, financial, investment, trading, or other types of advice or recommendations. Trading any market instrument is a RISKY business, so do your own due diligence, and trade at your own risk. You can loose all of your money and much more.

Ranging channel without a sense of a new direction 166-182Sideway action at support & resistance, hasn't made any challenges to breakaway or break down any further, means it is looking to squeeze out closer to 180 before shifting in to a continued sideway channel.
NVIDIA NVIDIA Corporation is a leading American technology company headquartered in Santa Clara, California, renowned for designing and manufacturing graphics processing units (GPUs) that power gaming, professional visualization, and artificial intelligence (AI) applications. Founded in 1993, NVIDIA revolutionized the graphics industry with its GeForce series of consumer GPUs and expanded into AI computing, becoming a key supplier of AI chips globally.
Key Aspects of NVIDIA in 2025:
Dominates the discrete GPU market with approximately 92% market share.
Powers more than 75% of the world’s fastest supercomputers, particularly in AI and machine learning workloads.
Achieved a historic market capitalization exceeding $4 trillion in mid-2025.
Continues to release advanced AI models and platforms, leveraging its GPU technology for sectors like autonomous vehicles, data centers, and cloud computing.
Has a strategic partnership with Intel to jointly develop AI infrastructure and integrated CPU-GPU platforms.
Strong innovation focus on AI edge computing, high-performance computing (HPC), and neural network acceleration.
NVIDIA remains a central force in the global semiconductor ecosystem, driving advancements in AI, gaming, and professional graphics.
#AI #STOCKS #NVIDIA

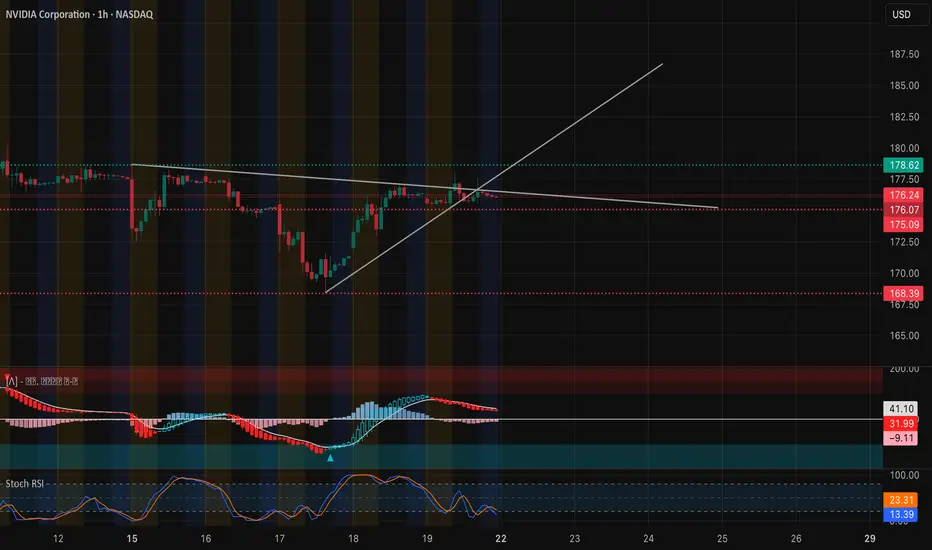
NVDA Holding the Line – Gamma Magnet at $190 for Oct 3 Intraday Technical Outlook (15m Chart)
NVIDIA (NVDA) closed near $188.97, stabilizing after an intraday fade from the $191 zone. On the 15-minute chart, price action shows consolidation with buyers trying to defend key support:
* MACD: Flattening and curling back toward neutral, signaling momentum could flip positive if buyers step in early tomorrow.
* Stoch RSI: Pushed back into overbought levels, showing near-term buying strength but also risk of quick pullbacks.
* Key Levels: Support rests at $188–187.2, with stronger downside protection near $185. Resistance is set at $191–192, the prior high and channel top.
Intraday takeaway: NVDA is range-bound between $187 and $191. A breakout above $191 can accelerate toward $193–195, while a failure to hold $187.2 risks a slide back toward $185.
Options Sentiment & GEX Outlook (1H Chart)
The 1-hour GEX setup highlights a tight battle around current levels:
* Gamma Walls:
* $191–192.5: Strongest positive GEX / call wall cluster — key resistance zone.
* $187.5–185: Gamma pivot and support levels where buyers may defend.
* $180 / $175: Put wall supports if selling pressure intensifies.
* Implications:
* Sustaining above $188.5–189 keeps NVDA magnetized toward the $191–192.5 call wall.
* If $187.2 fails, dealer flows may drive price toward $185 and potentially $180.
* Volatility Context: IVR sits at 10.1 (very low), meaning options are cheap relative to history. This makes directional call/put buys attractive — but also means sellers risk getting trapped if momentum surges.
My Thoughts & Recommendation
For Oct 3 trading, NVDA sits at a gamma pivot with a tight setup:
* Intraday (scalping/trading): Longs favored above $188.5, targeting $191–192.5. Quick rejection at $191 can be shorted back to $187.2–185.
* Options trading (swing/0DTE): Calls make sense only above $189–190 for a breakout chase toward $193–195. If NVDA fails at $191 and dips below $187.2, puts targeting $185–180 have cleaner risk/reward.
Bias heading into Oct 3: Neutral-to-bullish, but watch $191 as the breakout test.
Disclaimer:
This analysis is for educational purposes only and does not constitute financial advice. Always do your own research and manage risk before trading.
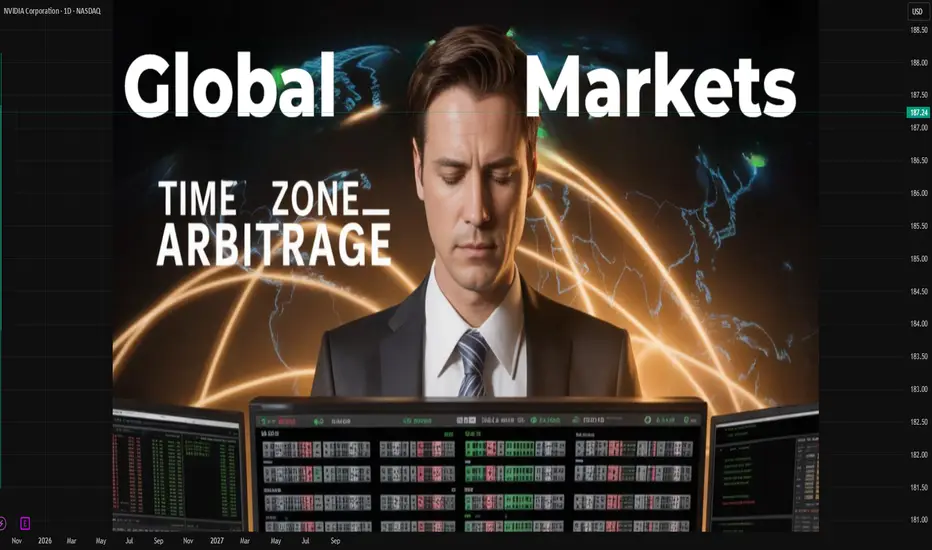
Introduction to Time Zone Arbitrage in Global Markets1. Understanding Arbitrage in Financial Markets
At its core, arbitrage is the practice of exploiting price discrepancies of the same asset across different markets or forms to earn risk-free profit. This fundamental concept underpins much of modern financial trading. In theory, if a stock, currency, commodity, or derivative is priced differently in two markets, a trader can simultaneously buy low in one market and sell high in another, pocketing the difference.
Traditional arbitrage opportunities are rare and fleeting, especially in highly liquid and technologically advanced markets. With the advent of electronic trading, algorithmic strategies, and high-frequency trading, the speed at which these discrepancies are corrected has accelerated dramatically.
Time zone arbitrage emerges as a special form of arbitrage, where the temporal differences between markets become the primary source of exploitable inefficiencies. The financial world is never closed: while one market sleeps, another operates, creating windows for traders to capitalize on lagging price reactions.
2. Global Markets and Time Zones
Financial markets operate within strict local hours. For example:
New York Stock Exchange (NYSE): 9:30 AM – 4:00 PM EST
London Stock Exchange (LSE): 8:00 AM – 4:30 PM GMT
Tokyo Stock Exchange (TSE): 9:00 AM – 3:00 PM JST
These schedules create overlapping periods—for instance, NYSE and LSE overlap between 8:00 AM and 11:30 AM EST—where liquidity and volatility peak. However, outside these overlaps, markets function independently, and information from one market may not immediately influence another due to operational hours.
Time zone arbitrage exploits these gaps. For instance, significant economic data released in the U.S. after the Asian markets close can create arbitrage opportunities for traders when Asian markets reopen the next day. Essentially, traders are leveraging information delays caused by non-synchronous trading hours.
3. Mechanisms of Time Zone Arbitrage
Time zone arbitrage typically involves three major mechanisms:
Price Discrepancy Exploitation:
When an asset trades in multiple markets, its price may diverge temporarily due to the staggered opening hours. For example, a stock listed on both NYSE and LSE might react to corporate news at different times. A trader can buy in the lagging market and sell in the one where the news impact has already been reflected.
Currency Movements:
Forex markets operate 24/5, but liquidity and volatility vary by time zone. Economic announcements from one country may cause currency pairs to move in one region before others react. Traders who monitor these shifts can execute trades across regions to capture price differences.
Futures and Derivatives Arbitrage:
Futures and derivatives tied to underlying assets in different time zones can experience lagged reactions. For example, S&P 500 futures traded in Singapore may temporarily misprice relative to the U.S. cash market during Asian hours. Arbitrageurs can exploit these short-term inefficiencies.
4. Drivers of Time Zone Arbitrage Opportunities
Several factors contribute to the emergence of time zone arbitrage opportunities:
Information Asymmetry:
Not all markets receive or process information simultaneously. Corporate earnings announcements, economic data releases, or geopolitical events may affect markets differently depending on their opening hours.
Liquidity Gaps:
Markets in non-overlapping time zones may have lower trading volumes, causing temporary price inefficiencies. These liquidity gaps are prime targets for arbitrage strategies.
Currency and Macro-Economic Events:
Global macroeconomic releases—like U.S. Non-Farm Payrolls or European Central Bank announcements—impact multiple markets. Since these announcements occur during specific time zones, traders in other regions may act ahead of local market participants.
Technological Differences:
Not all markets are equally automated. While developed markets adjust quickly due to algorithmic trading, emerging markets may show delayed price reactions, enhancing arbitrage potential.
5. Examples of Time Zone Arbitrage
5.1 Forex Market
A classic example is the USD/JPY pair. Suppose a major U.S. economic report releases at 8:30 AM EST. Tokyo traders may not react until the TSE opens at 9:00 AM JST, creating a brief window where the currency pair’s price is misaligned with the news. Arbitrageurs can profit by executing trades between London, Tokyo, and New York markets.
5.2 Stock Market Cross-Listings
Many multinational companies list their shares in multiple exchanges. For example, HSBC trades in London, Hong Kong, and New York. If news affects the Hong Kong market during its daytime, traders can exploit the lag in New York’s reaction to the same news due to time differences.
5.3 Commodities Futures
Consider crude oil futures, which trade in both the CME in the U.S. and the Intercontinental Exchange (ICE) in London. A geopolitical event affecting oil supply may influence ICE prices during European hours, but CME futures may take time to adjust until New York opens, offering arbitrage potential.
6. Tools and Techniques
Modern time zone arbitrage relies heavily on technology. Key tools include:
Algorithmic Trading Systems:
These monitor multiple markets simultaneously, identify mispricings, and execute trades in milliseconds.
High-Frequency Trading (HFT):
Leveraging microsecond speed, HFT firms can capitalize on arbitrage opportunities across time zones before others detect them.
Data Feeds and News Analytics:
Real-time economic and corporate news feeds, combined with AI-powered sentiment analysis, allow traders to anticipate cross-market price movements.
Cross-Market Surveillance:
Continuous monitoring of correlated instruments across regions ensures timely identification of exploitable discrepancies.
7. Risks and Constraints
While time zone arbitrage is theoretically low-risk, several practical challenges exist:
Execution Risk:
Delays in order execution can turn profitable trades into losses.
Transaction Costs:
Spreads, commissions, and fees may erode arbitrage profits, especially in lower-liquidity markets.
Market Volatility:
Unexpected price swings due to global events may render arbitrage positions unprofitable.
Regulatory Barriers:
Some jurisdictions impose restrictions on cross-border trading, capital flows, or short-selling, limiting arbitrage potential.
Technological Risks:
Reliance on connectivity, data feeds, and trading algorithms exposes traders to system failures or cyber risks.
8. Strategies for Time Zone Arbitrage
Successful traders use a mix of strategies:
Cross-Exchange Arbitrage: Exploiting price differences for the same security on multiple exchanges.
Statistical Arbitrage: Using historical correlations and statistical models to predict and trade mispricings.
Latency Arbitrage: Capitalizing on delays in data transmission between markets.
Macro-Event Arbitrage: Reacting to economic, political, or corporate events affecting global markets asynchronously.
9. Market Participants
Time zone arbitrage is primarily the domain of:
Institutional Traders: Hedge funds and proprietary trading desks dominate this space due to the scale and technology required.
High-Frequency Traders: Specialize in exploiting microsecond-level price discrepancies.
Global Asset Managers: Engage in cross-market hedging and arbitrage as part of portfolio optimization.
Retail Traders: Increasingly accessing time zone arbitrage opportunities through online platforms and ETFs, though on a smaller scale.
10. Broader Implications for Global Markets
Time zone arbitrage plays a vital role in market efficiency:
Price Discovery: Arbitrage helps synchronize prices across markets, improving transparency.
Liquidity Distribution: Facilitates smoother capital flows between regions.
Integration of Emerging Markets: Encourages alignment with global market trends.
Technological Advancements: Drives innovation in trading systems, data analytics, and risk management.
However, it can also introduce systemic risks. Over-reliance on algorithms or HFT in multiple time zones may amplify volatility during unexpected events, as seen in global “flash crashes.”
11. The Future of Time Zone Arbitrage
The evolution of global markets suggests that time zone arbitrage will continue to grow in complexity:
24/7 Markets: Cryptocurrency and digital asset markets operate round-the-clock, reducing traditional time gaps but creating new cross-exchange arbitrage opportunities.
AI and Machine Learning: Predictive models can detect emerging arbitrage opportunities faster than human traders.
Global Market Integration: As emerging markets align with major exchanges, arbitrage windows may shrink, but sophisticated strategies will continue to exploit subtler inefficiencies.
Regulatory Evolution: Harmonization of cross-border trading rules may reduce some arbitrage opportunities but also create standardized pathways for institutional strategies.
12. Conclusion
Time zone arbitrage is a sophisticated yet fundamental aspect of modern financial markets. By leveraging temporal gaps between global markets, traders can exploit price inefficiencies for profit. Its successful execution requires advanced technology, rapid decision-making, deep market knowledge, and careful risk management.
While it enhances market efficiency and integration, it also introduces challenges related to volatility, regulation, and technological dependency. As markets evolve—especially with the rise of 24/7 digital trading—time zone arbitrage will remain a critical area for institutional traders, high-frequency operations, and innovative investment strategies.
Ultimately, time zone arbitrage highlights the interconnectedness of global finance, demonstrating that even a world divided by hours can be united by the continuous pursuit of opportunity.
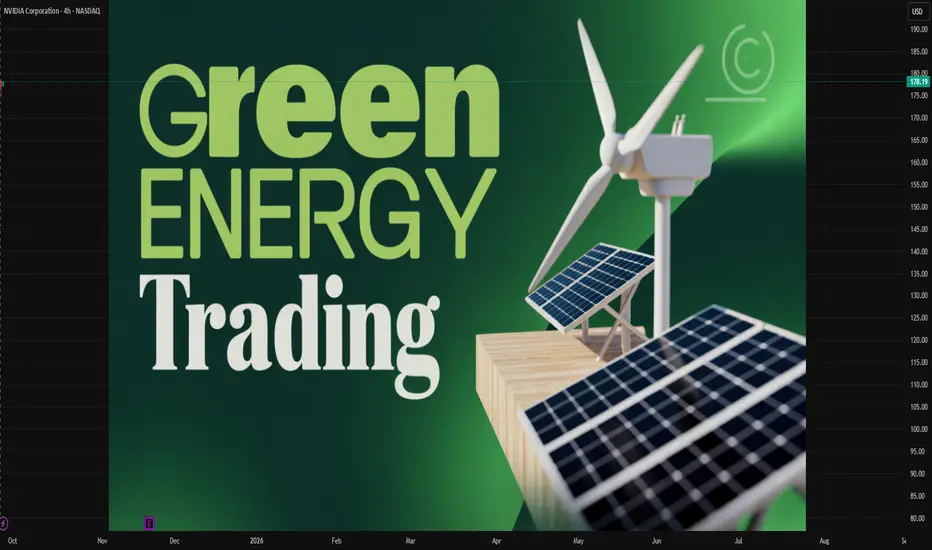
Global Green Energy Trading Trends1. What we mean by “green energy trading”
“Green energy trading” spans several related but distinct markets:
Physical electricity markets where renewable generation competes in wholesale power markets.
Corporate offtake markets / Power Purchase Agreements (PPAs) — long-term contracts linking buyers (often corporates) and renewable project sellers.
Renewable Energy Certificates (RECs) / Guarantees of Origin (GOs) — unbundled instruments that represent the environmental attribute of 1 MWh of renewable generation.
Carbon markets — both compliance (cap-and-trade) and voluntary carbon markets (VCM) for offsets/removals.
Trade in low-carbon fuels and commodities — early and fast-growing markets for green hydrogen, ammonia, and derivatives intended for shipping, industry, and storage.
Cross-border electricity and capacity trades, enabled by interconnectors and regional power pools.
Each sub-market has its own liquidity dynamics, price drivers, participants and integrity issues. Treating them as a connected ecosystem — where PPAs, REC supply, carbon pricing and hydrogen exports all interact — is essential to understanding modern green energy trading.
2. Market scale & capital flows: momentum, but uneven progress
Investment into clean energy technologies remains large and growing worldwide. Multiple 2025 trackers show record or near-record levels of investment in renewables and associated infrastructure, even while investment patterns differ by region. BloombergNEF and other trackers documented strong capital flows into solar, wind and storage in recent reporting, while public reports by the IEA and REN21 confirm renewables’ rising share of global generation.
Still, important caveats exist: while installed capacity is growing fast, investment is increasingly focused on solar PV plus associated storage; grid and transmission investment lags; and some regions face investor retrenchment owing to policy or market risk. That re-risking shows up in slower PPA volumes or higher financing spreads in specific jurisdictions — the headline number (global investment) masks significant regional divergence.
3. Electricity trading and PPAs: corporates and utilities reshape demand
Corporate demand for long-term PPAs has been a major growth engine for green trading. Large companies continue to sign deals to meet procurement and net-zero goals, supporting project finance. In 2024 corporates signed tens of gigawatts of PPAs globally, and while volumes fluctuate quarter-to-quarter, 2024–2025 figures still show hundreds of terawatt-hours of contracted renewable energy across major markets. The PPA market has also diversified — shorter tenors, virtual PPAs (financial-only), sleeved structures, and hybrid PPA + storage deals are now routine. LevelTen and market reports highlight these shifts in price discovery and contract structure.
Market implications:
PPAs reduce merchant risk for developers, unlocking capital for new projects.
Financial PPAs (VPPA) allow companies in non-renewable grids to buy green attributes without physical delivery.
The combination of PPAs and REC purchases makes an increasingly liquid “corporate demand stack” that supports project economics, particularly in markets with weak or absent compliance instruments.
4. REC, GO and attribute markets: unbundling clean electrons
REC markets (called GOs in Europe, I-RECs in some markets) are maturing and expanding. Demand drivers include corporate procurement, renewable portfolio standards, and voluntary claims verification. The size of REC markets has ballooned where corporate offtake meets supportive policy; where policy is weak, VPPAs coupled with RECs are common.
Key dynamics:
Price dispersion — REC prices vary enormously across geographies depending on policy support and renewable penetration.
Unbundling vs. bundled — growing debate over whether simply buying RECs (without matching delivery) is sufficient for claims of “using renewable energy.” Many corporates now aim for time-matched and location-matched procurement to reduce “additionality” questions.
Market innovation — “time-tagged” or “hourly” certificates and blockchain pilots for traceability are becoming more common.
This market still faces integrity questions: standardization of vintage, additionality, double-counting avoidance, and the interplay with compliance regimes require ongoing governance.
5. Carbon markets: compliance growth and voluntary market reform
Carbon pricing and trading remain central to the economics of green energy. The World Bank’s 2025 carbon pricing report shows that carbon pricing covers an increasing share of emissions and is mobilizing fiscal resources — but coverage and price levels are highly uneven.
Two parallel trends matter for green trading:
Expansion and strengthening of compliance markets. More jurisdictions are adopting or tightening ETS (emissions trading systems) and carbon taxes, increasing demand for high-quality credits and driving corporate hedging strategies.
Reform of voluntary carbon markets (VCM). After volatility and integrity scandals, the VCM is undergoing standardization — improved registries, stricter methodologies, and a market tilt toward removals and high-integrity nature-based or engineered solutions. Ecosystem Marketplace’s 2025 SOVCM documents this transition.
Impacts:
Carbon prices (and the existence of credible compliance markets) materially affect the levelized cost calculus for low-carbon fuels (e.g., hydrogen) and for investments in add-on abatement technologies.
The VCM’s reform will shape corporate net-zero strategies — companies increasingly seek verifiable removals rather than cheap, low-integrity offsets.
6. Green hydrogen & traded molecules: the next frontier
Green hydrogen (electrolytic H₂ powered by renewables) and its derivatives (ammonia, e-methanol) are moving from pilots to nascent global trade. IRENA and other analysts highlight strong potential for cross-border hydrogen trade, with resource-rich, low-cost renewable regions set to become exporters and industrial consumers (EU, Japan, Korea) as importers. IRENA’s 2025 analysis maps techno-economic potential for hydrogen and derived commodities, showing realistic export/import corridors emerging by 2030–2050.
Why hydrogen trade matters for trading dynamics:
Hydrogen opens a new commodities market with different logistics (electrolyzers, compression, shipping of ammonia or LOHCs) and new price formation mechanisms tied to electricity costs, electrolyzer capex, and shipping.
Early trade will be bilateral and project-based (offtake contracts, tolling arrangements), transitioning to more liquid spot/forward markets as infrastructure and certification (low-carbon hydrogen certificates) develop.
Countries with cheap renewables + coastal infrastructure (Australia, parts of the Middle East, North Africa, Chile) are positioning to be exporters; heavy industrial demand centers (EU, Japan, Korea) are positioning to be importers.
Risks: cost trajectories for electrolyzers, the timeline of dedicated shipping/port infrastructure, and the need for an international certification framework to avoid greenwashing.
7. Cross-border electricity trading and grid issues
As renewable shares rise, regional interconnections become more valuable: geographic smoothing of supply, optimized dispatch across time zones, and better utilization of variable renewables. Projects to expand interconnectors (Europe, Africa-Europe links, emerging interregional links in Asia) are gaining priority, but progress is constrained by permitting, financing and political coordination.
Market design consequences:
Larger, interconnected markets can reduce curtailment and lower system costs, but they also require harmonized market rules, congestion management and mechanisms to allocate transmission costs.
High penetration of renewables increases the importance of ancillary service markets (frequency, inertia, fast reserves) and the monetization of storage services through trading platforms.
8. Technology & digitalization shaping trade
Trading infrastructure, data and software are changing how green energy trades are executed:
Hourly / granular attribute certificates. Time-matched RECs and hourly settlement help link generation and consumption more credibly.
Trading platforms and marketplaces. Platforms for PPAs, RECs, and carbon credits (including tokenized assets and marketplace aggregators) improve liquidity and price discovery.
Advanced forecasting and AI. Better wind/solar forecasts reduce short-term imbalance costs and improve the value of battery-coupled projects; AI also optimizes scheduling and trading strategies for aggregated distributed energy resources (DERs).
Blockchain / registries. Pilots for immutable registries aim to reduce double counting and improve provenance — particularly important in voluntary markets and hydrogen certification.
These innovations lower transaction costs and allow new market entrants (aggregators, VPP operators) to participate, broadening liquidity.
9. Policy, geopolitics and industrial policy: winners and losers
Green trading does not happen in a vacuum: geopolitics and industrial policy decisions shape the supply chains and competitive advantages.
Industrial policy matters. Countries that invest in electrolyzer manufacturing, battery supply chains, and port/infrastructure for hydrogen can capture export value chains. IRENA and other analysts point to likely exporters and importers through 2050.
Trade frictions and ‘green industrial policy’. Governments are using tax credits, domestic content rules, and subsidies (e.g., IRA in the U.S., similar programs in the EU and Asia) to lock in upstream manufacturing — this can distort trade flows and prompt retaliatory measures.
Energy security arguments. The energy transition coexists with strategic concerns — countries are wary of dependence on single suppliers for critical inputs (batteries, rare earths, hydrogen), and that shapes trade and contracting patterns.
Geopolitical disruptions (e.g., shifts in trade alliances, sanctions) can quickly change routing and price dynamics for green commodities.
10. Corporate behaviour & financial innovation
Corporates are major demand drivers through PPAs, on-site generation, and REC purchases; financial markets are responding with new instruments:
Green bonds and sustainability-linked financing have become standard to fund projects.
Hedging structures: corporate hedges, merchant storage arbitrage, and hybrid contracts (capacity + energy + attribute) are being packaged to manage revenue volatility.
Insurance & de-risking products are maturing to address construction and merchant risk for green projects — critical to mobilize institutional capital.
Investor due diligence has also matured: financial crates now scrutinize grid access, congestion risk, and REC/offset integrity before underwriting deals.
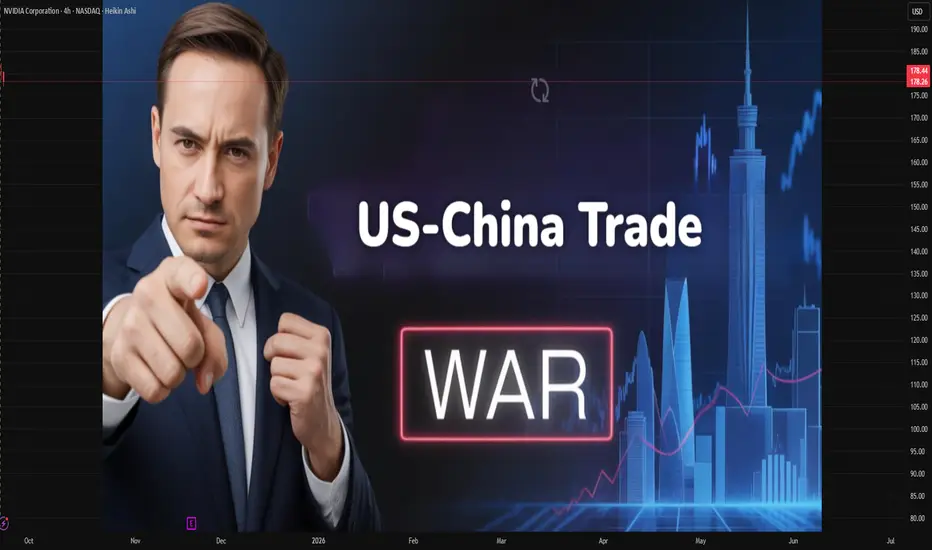
Origins and Causes of the US–China Trade WarIntroduction
The trade war between the United States and China has become one of the most defining economic conflicts of the 21st century. It is not merely about tariffs or trade imbalances but represents a broader clash of economic models, political systems, and global ambitions. To truly understand why this trade war began, one must look beyond the headlines and consider the deep historical, economic, and geopolitical contexts that shaped U.S.–China relations over the past five decades.
The U.S.–China trade war formally erupted in 2018 under President Donald Trump’s administration, but its roots stretch back much further—to China’s economic reforms in the late 1970s, the U.S. decision to integrate China into the global trading system, and the growing perception in Washington that Beijing’s rise posed both economic and strategic challenges. The conflict was therefore the culmination of decades of tensions regarding trade deficits, intellectual property theft, industrial subsidies, and the role of state power in shaping markets.
This essay explores the origins and causes of the U.S.–China trade war in detail, examining historical background, economic dynamics, political factors, and the deeper strategic rivalry that underpins the confrontation.
1. Historical Context of U.S.–China Trade Relations
1.1 Early Isolation and Opening Up
For much of the 20th century, China was economically isolated. Following the Communist Revolution in 1949, China adopted a centrally planned economic system with little interaction with global markets. The U.S. had minimal trade with China, especially during the Cold War, when the two countries were ideological and geopolitical rivals.
Everything began to change under Deng Xiaoping’s economic reforms in 1978. China began opening up to foreign trade and investment, allowing special economic zones and market-driven policies. American companies saw enormous opportunities in China’s cheap labor and expanding consumer base.
1.2 Rapprochement and Normalization
The normalization of diplomatic relations in 1979 under President Jimmy Carter paved the way for commercial ties. Over the 1980s and 1990s, trade grew rapidly, and the U.S. increasingly viewed China as both a manufacturing hub and a market for exports.
1.3 WTO Accession and Its Consequences
A crucial turning point came in 2001, when China joined the World Trade Organization (WTO). The United States supported China’s accession, believing it would liberalize China’s economy, reduce state intervention, and bring Beijing closer to Western norms of free markets.
Instead, China used WTO membership to expand its export-led growth strategy. Its manufacturing capacity boomed, and U.S. companies moved large parts of their supply chains to China. While this benefited U.S. corporations and consumers with cheap goods, it also contributed to job losses in American manufacturing, fueling political resentment.
2. Economic Causes
2.1 U.S. Trade Deficit with China
One of the most visible triggers of the trade war was the massive trade imbalance. By the mid-2010s, the U.S. trade deficit with China exceeded $375 billion annually. Washington saw this as evidence of unfair practices, while Beijing argued it was the natural result of global value chains where final assembly took place in China.
2.2 Intellectual Property Theft and Technology Transfer
American firms long complained about forced technology transfer, intellectual property (IP) theft, and restrictions on market access. U.S. companies operating in China often had to form joint ventures with local firms, effectively handing over proprietary technology. Additionally, cyber espionage campaigns allegedly backed by the Chinese state targeted American corporations to steal industrial and military secrets.
2.3 Industrial Policy and State Subsidies
China’s economic model is built on significant state involvement in industry. Programs like “Made in China 2025”, launched in 2015, aimed to establish dominance in high-tech sectors such as semiconductors, robotics, and artificial intelligence. The U.S. saw these policies as unfair because Chinese firms received state subsidies, cheap loans, and protection from competition, giving them an edge over foreign rivals.
2.4 Currency Manipulation Accusations
For years, U.S. policymakers accused China of artificially undervaluing its currency (the yuan) to make exports cheaper and imports more expensive, thereby boosting its trade surplus. While this practice diminished after 2010, the perception remained influential in Washington’s decision-making.
3. Political and Strategic Causes
3.1 U.S. Domestic Politics and Populism
By the 2010s, public opinion in the U.S. had shifted. The loss of manufacturing jobs was often attributed to globalization and specifically to trade with China. Politicians began campaigning on promises to bring jobs back and stand up to Beijing. Donald Trump, elected in 2016, tapped into this sentiment with his “America First” agenda.
3.2 Rising Chinese Ambitions
China’s rapid economic rise also translated into greater global influence. The Belt and Road Initiative (BRI), military modernization, and technological leadership ambitions challenged U.S. dominance. Washington grew concerned that China was not just a trading partner but a strategic competitor seeking to reshape global power structures.
3.3 Clash of Economic Models
At the core of the conflict lies a fundamental clash of economic philosophies. The U.S. system emphasizes free markets, private enterprise, and limited government intervention, while China relies heavily on state capitalism and party-driven industrial policy. This structural difference fueled mistrust and accusations of unfair competition.
3.4 National Security Concerns
Trade and technology are increasingly intertwined with national security. The U.S. worried that dependence on Chinese supply chains—particularly in areas like telecommunications (Huawei, 5G), semiconductors, and rare earth minerals—posed security risks. Restrictions on Chinese technology firms were thus framed not only as trade issues but also as matters of national defense.
4. Escalation into a Trade War
4.1 Trump’s Tariff Strategy
In 2018, President Trump imposed tariffs on Chinese imports worth billions of dollars, citing Section 301 of the U.S. Trade Act of 1974. China retaliated with its own tariffs on U.S. goods, particularly targeting politically sensitive industries like agriculture.
4.2 Negotiations and Breakdown
Although several rounds of negotiations were held, fundamental differences remained unresolved. The U.S. demanded structural reforms in China’s economy, while Beijing refused to abandon state-led policies it considered essential for development.
4.3 Global Economic Fallout
The trade war created uncertainty in global markets, disrupted supply chains, and led to slower economic growth worldwide. Multinational corporations had to rethink sourcing strategies, with some shifting production to countries like Vietnam and Mexico.
5. Deeper Structural Causes
5.1 Thucydides Trap and Power Transition Theory
Some scholars frame the trade war as part of the “Thucydides Trap”—the idea that when a rising power (China) threatens to displace an established power (the U.S.), conflict becomes likely. From this perspective, the trade war is just one manifestation of a broader rivalry for global supremacy.
5.2 Technological Dominance as the New Battleground
The real competition is not about traditional manufacturing but about who leads in emerging technologies—AI, 5G, quantum computing, and biotech. The U.S. fears losing its edge to China, which invests heavily in these areas with state backing.
5.3 Globalization Backlash
The trade war also reflects a broader backlash against globalization. In the U.S., many communities felt left behind by outsourcing and global supply chains. The trade conflict thus became a way to politically channel domestic frustrations.
6. Conclusion
The U.S.–China trade war did not arise overnight. It was the product of decades of economic integration combined with unresolved tensions over trade imbalances, intellectual property, state subsidies, and market access. At its core, the conflict represents not just a dispute over tariffs but a struggle between two economic systems and visions of world order.
The United States seeks to preserve its global dominance and protect its industries, while China aims to secure its rise as a technological and geopolitical power. The trade war is therefore less about soybeans and steel and more about the future of global leadership.
Whether the two countries can find a sustainable coexistence will shape not only their bilateral relationship but also the trajectory of the world economy in the decades ahead.
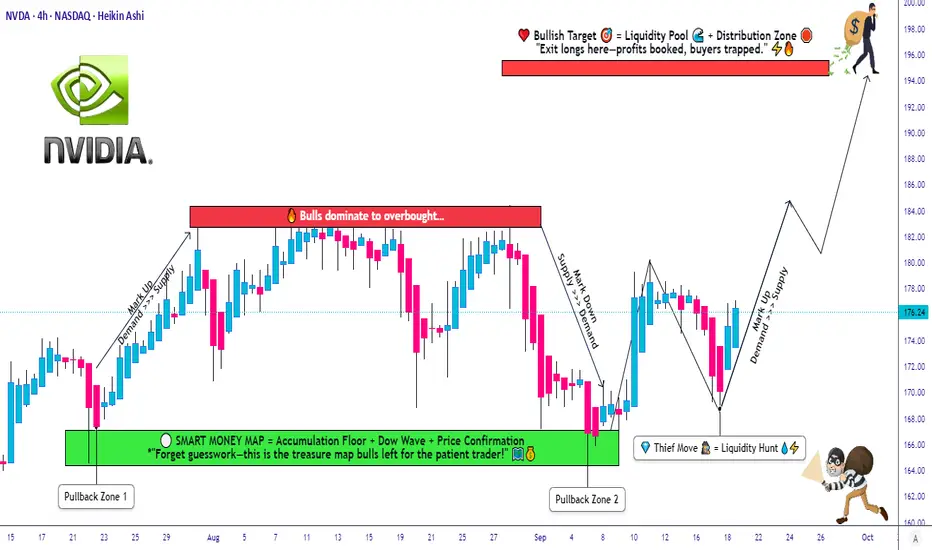
NVDA Setup Explained: Layered Entry + Clear SL/TP Levels😎 NVDA Thief’s Wealth Heist: Swing/Day Trade Blueprint 🚀
Asset: NVIDIA Corporation (NVDA) 📈Vibe: Bullish, sneaky, and ready to snatch profits with style! 💰
Welcome, ladies and gentlemen, to the Thief’s OG Wealth Strategy Map for NVDA!
This is a fun swing/day trading plan designed to grab liquidity like a master thief. Let’s break down this bullish setup with a double bottom pullback, layered entries, and a cheeky escape plan. Ready to outsmart the market? 🕵️♂️
📊 Market Analysis: Why NVDA?
NVDA is riding a bullish wave 🌊, confirmed by a double bottom pullback pattern and a sneaky liquidity grab at key support levels. The stock’s momentum is screaming “UP!” as buyers step in to defend the price. This setup is perfect for swing or day traders looking to capitalize on NVIDIA’s tech-fueled surge. 💻
🗺️ The Thief’s Plan: Bullish Heist Strategy
🎯 Entry Strategy:Deploy the Thief’s Layering Tactic with multiple buy limit orders to maximize your entry precision.
Suggested price levels:
$172.00
$174.00
$176.00
$178.00
Pro Tip: Feel free to add more layers based on your risk appetite and market conditions. The more, the merrier! 🧑💼
🛑 Stop Loss (SL):Set a Thief’s SL at $168.00 to protect your loot.
Note: Dear Thief OGs, this SL is my suggestion, but you’re the boss of your trades! Adjust based on your risk tolerance and let the profits roll. 💸
🎉 Take Profit (TP):Aim for the juicy $195.00 target, where we expect strong resistance, potential overbought conditions, and a possible trap for the unprepared. Lock in those hard-earned gains and escape like a pro! 🏃♂️
Note: This TP is my call, but you do you! Take profits at your own pace and keep the cash flowin’. 😎
🔗 Related Pairs to Watch (in USD)
To boost your market awareness, keep an eye on these correlated assets:
NASDAQ:AMD (Advanced Micro Devices): NVDA’s chipmaking cousin often moves in tandem. A bullish NVDA could signal strength in AMD. 📡
NASDAQ:SMH (VanEck Semiconductor ETF): This ETF tracks the semiconductor sector, including NVDA. Watch for sector-wide momentum. 📊
NASDAQ:QQQ (Invesco QQQ Trust): NVDA’s a heavy hitter in this tech-heavy ETF. QQQ’s trend can confirm NVDA’s direction. 🚀
Key Correlation Point: NVDA’s performance is tied to the broader semiconductor and tech sector. If AMD or SMH shows bullish patterns, it reinforces NVDA’s upside potential. Conversely, weakness in QQQ could signal caution. Stay sharp, thieves! 🕵️
🛠️ Why This Setup Rocks
Double Bottom Pullback: A textbook bullish reversal pattern, signaling strong buying interest. 📉➡️📈
Liquidity Grab: The market’s attempt to shake out weak hands before the real move up. We’re smarter than that! 😏
Layered Entries: Spread your risk across multiple price levels for a smoother ride. 🎢
Risk Management: Clear SL and TP levels keep your heist disciplined and profitable. 🧠
⚠️ Disclaimer
This Thief Style Trading Strategy is just for fun and educational purposes! I’m not a financial advisor, and trading involves risks. Make your own decisions, manage your risk, and trade responsibly. Let’s keep the vibes high and the losses low! 😜
✨ “If you find value in my analysis, a 👍 and 🚀 boost is much appreciated — it helps me share more setups with the community!”
#NVIDIA #NVDA #Trading #SwingTrading #DayTrading #ThiefStrategy #StockMarket #Bullish #TechnicalAnalysis
$NVDA- channel breakout possible here- on watchNVDA - Stock moving towards top of the channel. possible breakout above $179-180 level area. multiple bad and good news coming for the stock. on high watch. above $180 we can see a move towards all time highs.

NVDASuccess in forex and stocks comes from a combination of knowledge, discipline, and patience. Understanding market trends, economic factors, and company
fundamentals is crucial, but equally important is controlling emotions and sticking to a well-planned strategy. Continuous learning, adapting to changing conditions, and managing risk wisely can turn opportunities into consistent growth over time.
Consistency, not luck, separates successful traders from the rest.
$NVDA: Structural Extension🏛️ RESEARCH NOTES
Rejections at highs look way too systematic. I also see drop in average %𝜟 of both parties at local top of ongoing wave.
⚖️ That means we can extend this structure to cover the possible compression (otherwise the escape).

$NVDA - Bullish Reverse Head & ShoulderThere is a reverse head & shoulder pattern setting up which is a bullish pattern. Break above the neckline should send the price to near $200.

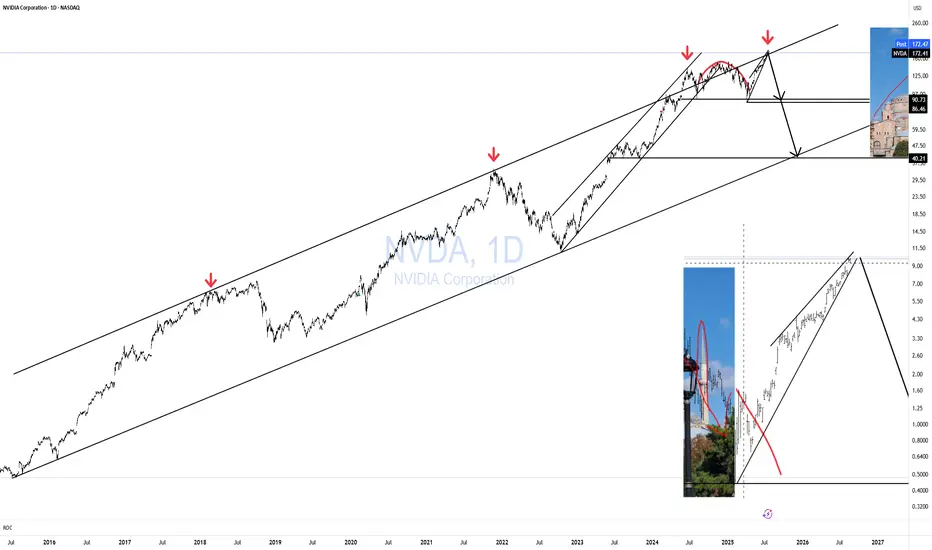
Nvidia - The rally is still not over!🔌Nvidia ( NASDAQ:NVDA ) still heads much higher:
🔎Analysis summary:
For the past decade, Nvidia has perfectly been respecting a major bullish rising channel formation. Currently, Nvidia is still far away from the upper red resistance trendline, which indicates another potential move higher. Just understand that the trend is your closest friend.
📝Levels to watch:
$200
SwingTraderPhil
SwingTrading.Simplified. | Investing.Simplified. | #LONGTERMVISION

NVDA HAGIA SOPHIA!The Hagia Sophia pattern has now fully formed; it just needs the crack! and the Hook!
No matter what your vague hunches and feelings are about AI, the charts will always win.
You can't "buy the dip" unless you know when to "Sell the Rip"!
If you can't see this resistance area, I don't know what to tell you.
Everyone is bullish at the top of a bubbliotious market without exception!
Click boost, Like, Subscribe! Let's get to 5,000 followers. ))
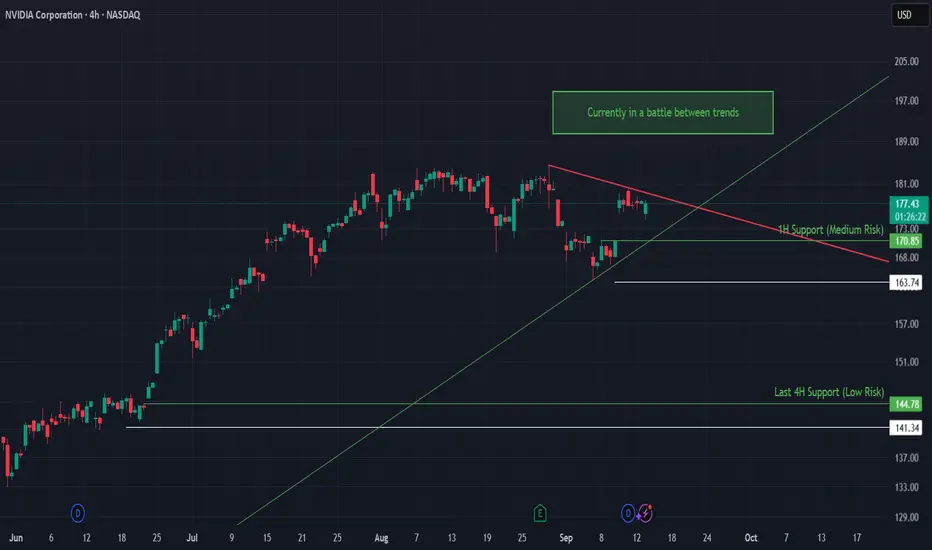
NVDA at a Crossroads: Battle Between TrendlinesNVIDIA is currently consolidating in a tight range, locked between an ascending green trendline of support and a descending red resistance trendline. This setup signals that a breakout is near, with the next directional move likely to bring strong momentum.
🔍 Technical Analysis
Current Price: 176.74
Structure: Triangle squeeze between rising support and falling resistance.
The ascending trendline from June continues to provide strong bullish structure, but the red downtrend capping recent highs must be broken to regain upside momentum.
🛡️ Support Zones (with Stop-Loss):
🟢 170.85 | SL: 163.74 – 1H Support (Medium Risk)
🟢 144.78 | SL: 141.34 – 4H Support (Low Risk, strong base)
🔼 Resistance Levels:
🟥 Red downtrend line near 180 – Breakout above confirms renewed bullish impulse.
🧭 Outlook
Bullish Case: Hold above 170.85 and break the red downtrend → momentum push toward 185–190.
Bearish Case: Failure to hold 170.85 could trigger a deeper pullback into 163 or even 145.
Bias: Neutral to bullish as long as price stays above the green trendline.
🌍 Fundamental Insight
While NVDA remains a market leader in AI and GPUs, recent earnings have highlighted slowing revenue growth compared to prior explosive quarters. This has cooled investor enthusiasm, making technical levels even more important for short-term direction.
✅ Conclusion
NVDA is at a decision point: stuck between trendlines, awaiting a breakout. Bulls must defend 170.85 while bears eye resistance around 180. A resolution here could set the tone for the coming weeks.
⚠️ Disclaimer
This analysis is for educational purposes only and does not constitute financial, investment, or trading advice.
NVDA Trying to Find a Floor – Sept 18 Trade Levels to Watch Here’s my take on Nvidia heading into Wednesday’s session, based on the 1-hour chart and current GEX data.
1️⃣ Price Action & Market Structure
* Trend check: NVDA is still in a short-term downtrend after last week’s selloff, but buyers stepped in near $168–170, which lines up with prior volume support.
* Key level: $172.5 is a near-term pivot. Price is testing it now; a sustained push above could start a relief bounce toward $175–177.
* Resistance overhead: The descending trendline around $174.8–175 is the first real test for bulls. Above that, $178.5 and $182.5 are next supply zones.
2️⃣ GEX (Options Flow) Read
* Call/put balance: Calls only about 25% of flow—puts still dominate, showing cautious sentiment.
* Put walls: Big put interest at $170 and $165 creates a “magnet” if $172.5 fails.
* Call side: Not much until $177.5 and $182.5, where gamma clusters could help a squeeze if buyers surprise.
3️⃣ Trading Thoughts
* Conservative long scalp: If NVDA closes an hourly candle above $172.5–174, a pop toward $177–178.5 is on the table. Tight stop under $170.
* Short setup: If price rejects $172.5 and slips back below $170, expect a quick test of $167.5, maybe $165 on momentum.
4️⃣ Option Angle
* Directional play: Debit spreads (e.g., $175/$180 calls) are fine for a bounce if price confirms over $174.
* Income angle: Credit spreads selling $165 puts or $180 calls fit a range-bound view if you expect more chop.
5️⃣ My View
Nvidia is oversold enough to bounce, but the overall tape is still heavy. I’ll wait for an hourly close over $174 to trust the long side. Otherwise, any fade below $170 keeps the short trend alive.
Disclaimer: This analysis is for educational discussion only and does not constitute financial advice. Always do your own research and manage risk before trading.
NVDA: A Stoic Approach to a Losing Trade (The Second Breath)As we just discussed, a loss is not a failure; it's information.
This trade on NVDA is a perfect, real-time application of that Stoic and Douglas-inspired philosophy. The first attempt was stopped out for a small "paper cut" loss. The Stoics teach us to focus only on what we can control. We couldn't control the price hitting our first stop, but we can absolutely control our reaction.
Our reaction is not one of frustration, but of calm acceptance. We take the information the market gave us, remain balanced, and execute the next step of our plan.
The New Trade Plan
This second attempt is an action taken with more wisdom and an even better potential reward.
Style: Long / Re-Entry
Entry: Limit Order at $167.75
Stop Loss: A tight, strategically placed stop at $162.25 (3.28% risk)
Target: $192.50
Risk/Reward Ratio: Approximately 1 : 4.5
The #limitlessTrader's Mindset
The first trade was simply an exhale. This second trade is the next breath, taken with more clarity and from a place of balance. This is the process.
Just shine.
Disclaimer: This is not financial advice. It is for educational and informational purposes only. Please conduct your own research and manage your risk accordingly.

Is Nvidia preparing for a retracement?On July 23rd I posted a chart suggesting that Nvidia had topped (at my green T1). Since then Nvidia has stalled at my T1 range for the past 2 months.
Question remains, will Nvidia retrance from here as anticipated? What do you think, I'd like to hear from you, to gauge sentiment.
May the trends be witht you.

Nvida BEAR n BULL idea. i'm bearish on nvida right now, this is my idea.
I'm really convinced that nvida will retest the support on old ath.
then go to the price target on green.

NVIDIA (NVDA) BUY NVIDIA (NVDA) is the undisputed king of AI hardware. Its GPUs power most machine learning models, including the systems behind ChatGPT and other generative AI tools. Investors have already seen explosive gains, but demand for AI chips shows no signs of slowing.

Nvidia plummets ~3% afterhours! Buy the dip or sell the rally?Nvidia delivered another strong quarter, beating expectations on both revenue and EPS. However, shares dropped after hours to around $175, as data centre revenue narrowly missed forecasts and China sales remained absent due to regulatory uncertainty.
Technically, if NVDA breaks below $175, bears may target the $170 double bottom support in a dead-cat-bounce fashion, with a risk of further downside if that level fails. However, if the stock holds above $179 and reclaims $185, bulls could see a rally toward $193 and potentially $220 in the medium term, which could still materialise after a short-term decline toward $170.
This content is not directed to residents of the EU or UK. Any opinions, news, research, analyses, prices or other information contained on this website is provided as general market commentary and does not constitute investment advice. ThinkMarkets will not accept liability for any loss or damage including, without limitation, to any loss of profit which may arise directly or indirectly from use of or reliance on such information.

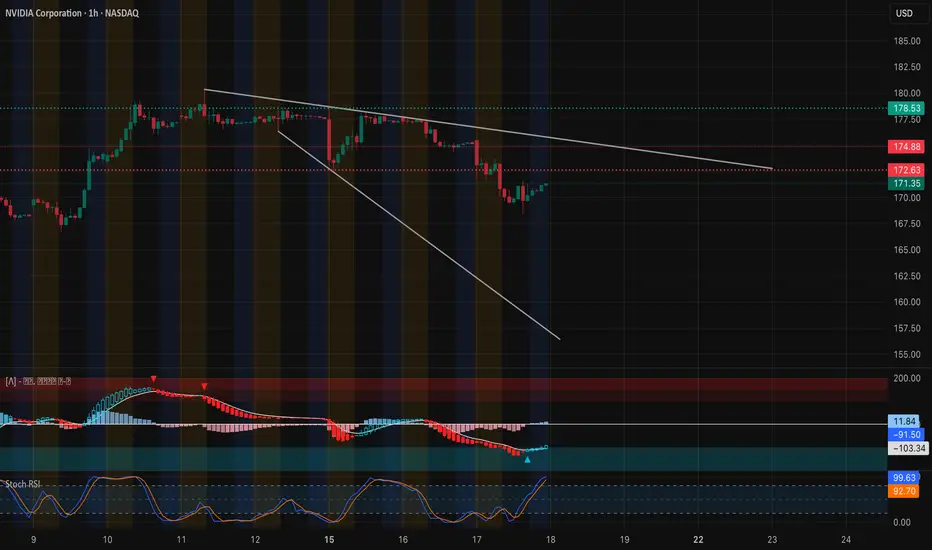
NVDA: Testing Key Support After Sharp Drop –Swing & Scalp Sep 171-Hour Chart Technical View
Nvidia’s 1-hour chart shows clear short-term weakness. After failing near $182.5, price has been trending down and now hovers around $175.15. MACD remains deep in negative territory and Stoch RSI is oversold, hinting at potential for a short-term bounce but no confirmed reversal yet.
* Immediate Support: $172.5 (high-volume node and HVL 09/19)
* Secondary Support: $170 and $166.5
* Resistance: $177.7 and $182.5 are key overhead levels for any rebound
Price is trading under both 9 and 21 EMA, confirming a short-term bearish structure until a clean reclaim above $177.7.
GEX & Options Flow
Options positioning highlights mixed sentiment with cautious call interest:
* Call Walls: $177.5 (2nd call wall), $182.5 (highest positive NET GEX / gamma resistance), and $185.
* Put Walls: $170 and $165 (significant downside hedges).
* GEX Bias: Around 23.5% calls with IVR at 5.7 (IVx ~40.8). This relatively low IVR shows option premiums are moderate despite the pullback.
Dealers may support the $172.5 area, but below that, gamma exposure flips bearish and accelerates downside risk.
Trade Thoughts & Suggestions
* Swing Idea: Aggressive buyers can nibble near $172.5 with a tight stop below $170, aiming for a relief bounce to $177.7–$182.5.
* Scalp Idea: Short bounces into $177.7 resistance if momentum stays weak, or scalp quick long entries off a confirmed double-bottom near $172.5.
* Bearish Scenario: A decisive break under $170 could accelerate selling toward $166.5.
Quick Take
NVDA is in a corrective phase. For Sept 17, all eyes are on $172.5. Holding that level can spark an oversold bounce; losing it could open the door to deeper downside.
Disclaimer: This analysis is for educational purposes only and does not constitute financial advice. Always do your own research and manage risk before trading.