GFI — New ATH Breakout | Pullback OpportunityHello Everyone, Followers,
Same as usual I will share 3 different analysis this week as well and GFI is the first one.
Lets drill down:
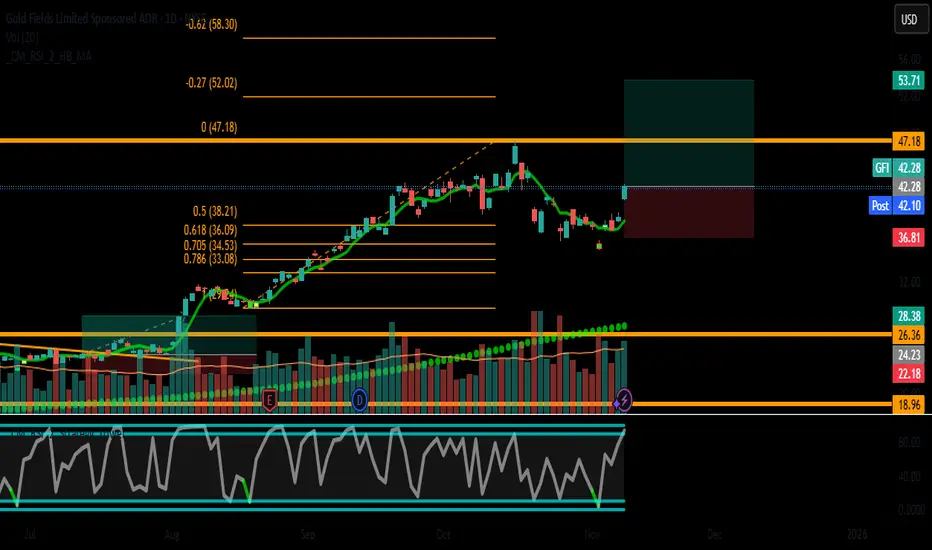
📈 GFI has confirmed a strong bullish breakout and printed new all-time highs after breaking its previous resistance.
Price is now extended above the breakout zo
Gold Fields Ltd.
No trades
Next report date
—
Report period
—
EPS estimate
—
Revenue estimate
—
2.14 USD
1.20 B USD
5.02 B USD
894.52 M
About Gold Fields Limited
Sector
Industry
CEO
Michael Fraser
Website
Headquarters
Johannesburg
Founded
1968
IPO date
Jul 1, 1992
Identifiers
2
ISIN ZAE000018123
Gold Fields Ltd. is a gold mining company, which engages in the production of gold and operation of mines. Its operating mines are located in Australia, Ghana, Peru, and South Africa. The company was founded on May 03, 1968 and is headquartered in Johannesburg, South Africa.
Related stocks

Indonesia-South Africa Deal
Channel: ANI News
Tittle: Indonesia Vice-President reaches South Africa to join world leaders at G20 Summit
May Peace & Blessings be Upon You ,
He is Raka, the son of Joko Widodo, and he attended the G20 Summit.
There will be lot of investment and policy update:
-Indonesia-South Africa will have

Long Setup (Fundamental + Technical + Momentum Convergence)TradingView Idea: GFI (Gold Fields Limited) - Swing Long Setup (Fundamental + Technical + Momentum Convergence)
🎯 Ticker: GFI (NYSE)
📈 Type: Swing Long / Position Trade
⏰ Timeframe: Daily (D1)
📊 Multi-Timeframe Analysis:
Daily Trend: BULLISH ✅
Daily Technical Recommendation: Neutral, consolidating
GFI: Long-Term breakout with room to runGFI has broken out of a long-term base. That points to possible long-term momentum to the upside. There still looks to be plenty of room for a multi-year move. Short-term swings are possible, but for a long-term investor, this could be a solid setup.

$GFI in your eyeBull flag breakout above massive base on the monthly chart. Should make new ATH soon

Gold Fields Limited $GFI: A Golden Opportunity in 2025? Gold Fields Limited ( NYSE:GFI ): A Golden Opportunity in 2025? 🏅💰
1/10
Gold production at NYSE:GFI declined 4% to 2.30 million ounces in 2023, but the company's All-In Sustaining Costs (AISC) stayed strong at US$1,295/oz, beating expectations. Stable cost control is key here. 📉 Can gold prices li

GFI: Time to knock on that door again?Since the market’s April low, the S&P 500 has surged more than 20%. Investors poured into high flyers: AI, semiconductors, mega-cap tech. The rally has been fast and crowded, driven by momentum and optimism. But not every part of the market shared in the celebration.
Gold stocks, once seen as a saf

Our opinion on the current state of GFIELDS(GFI)Gold Fields (GFI) is a relatively high-cost international gold mining house with a single mine in South Africa - South Deep.
South Deep was bought by Gold Fields in 2006, and it has struggled to make the mine profitable, pouring in a total of R32bn (R22bn purchase price plus R10bn in development

Our opinion on the current state of GFIELDS(GFI)Gold Fields (GFI) is a relatively high-cost international gold mining company with one mine in South Africa—South Deep. Acquired in 2006, South Deep has been a challenging asset for Gold Fields, with the company investing a total of R32 billion (R22 billion for the purchase and R10 billion for devel

Gold Fields Limited - Who benefits most from the gold rally? Key arguments supporting the idea
Gold is currently trading above $2500, reflecting a 36% increase from its low point last October and a 23% rise since the start of the new bull run in late February. However, the market has yet to price-in these astronomical gold price levels with gold mining sto

See all ideas
Summarizing what the indicators are suggesting.
Neutral
SellBuy
Strong sellStrong buy
Strong sellSellNeutralBuyStrong buy
Neutral
SellBuy
Strong sellStrong buy
Strong sellSellNeutralBuyStrong buy
Neutral
SellBuy
Strong sellStrong buy
Strong sellSellNeutralBuyStrong buy
An aggregate view of professional's ratings.
Neutral
SellBuy
Strong sellStrong buy
Strong sellSellNeutralBuyStrong buy
Neutral
SellBuy
Strong sellStrong buy
Strong sellSellNeutralBuyStrong buy
Neutral
SellBuy
Strong sellStrong buy
Strong sellSellNeutralBuyStrong buy
Displays a symbol's price movements over previous years to identify recurring trends.
G
GFIOF4832113
Gold Fields Orogen Holding (BVI) Ltd. 6.125% 15-MAY-2029Yield to maturity
4.54%
Maturity date
May 15, 2029
See all GFIOF bonds
Frequently Asked Questions
The current price of GFIOF is 55.22 USD — it has decreased by −0.68% in the past 24 hours. Watch Gold Fields Ltd. stock price performance more closely on the chart.
Depending on the exchange, the stock ticker may vary. For instance, on OTC exchange Gold Fields Ltd. stocks are traded under the ticker GFIOF.
GFIOF stock has risen by 4.19% compared to the previous week, the month change is a 23.84% rise, over the last year Gold Fields Ltd. has showed a 214.82% increase.
We've gathered analysts' opinions on Gold Fields Ltd. future price: according to them, GFIOF price has a max estimate of 106.39 USD and a min estimate of 40.25 USD. Watch GFIOF chart and read a more detailed Gold Fields Ltd. stock forecast: see what analysts think of Gold Fields Ltd. and suggest that you do with its stocks.
GFIOF reached its all-time high on Jan 28, 2026 with the price of 61.40 USD, and its all-time low was 2.40 USD and was reached on Oct 8, 2018. View more price dynamics on GFIOF chart.
See other stocks reaching their highest and lowest prices.
See other stocks reaching their highest and lowest prices.
GFIOF stock is 0.69% volatile and has beta coefficient of 1.56. Track Gold Fields Ltd. stock price on the chart and check out the list of the most volatile stocks — is Gold Fields Ltd. there?
Today Gold Fields Ltd. has the market capitalization of 49.33 B, it has increased by 4.84% over the last week.
Yes, you can track Gold Fields Ltd. financials in yearly and quarterly reports right on TradingView.
Gold Fields Ltd. is going to release the next earnings report on Feb 19, 2026. Keep track of upcoming events with our Earnings Calendar.
GFIOF earnings for the last half-year are 1.12 USD per share, whereas the estimation was 1.19 USD, resulting in a −5.49% surprise. The estimated earnings for the next half-year are 2.35 USD per share. See more details about Gold Fields Ltd. earnings.
Gold Fields Ltd. revenue for the last half-year amounts to 3.48 B USD, despite the estimated figure of 3.59 B USD. In the next half-year revenue is expected to reach 5.30 B USD.
GFIOF net income for the last half-year is 1.06 B USD, while the previous report showed 807.84 M USD of net income which accounts for 30.86% change. Track more Gold Fields Ltd. financial stats to get the full picture.
Gold Fields Ltd. dividend yield was 4.05% in 2024, and payout ratio reached 39.21%. The year before the numbers were 2.68% and 51.25% correspondingly. See high-dividend stocks and find more opportunities for your portfolio.
As of Feb 14, 2026, the company has 6.56 K employees. See our rating of the largest employees — is Gold Fields Ltd. on this list?
EBITDA measures a company's operating performance, its growth signifies an improvement in the efficiency of a company. Gold Fields Ltd. EBITDA is 3.79 B USD, and current EBITDA margin is 50.95%. See more stats in Gold Fields Ltd. financial statements.
Like other stocks, GFIOF shares are traded on stock exchanges, e.g. Nasdaq, Nyse, Euronext, and the easiest way to buy them is through an online stock broker. To do this, you need to open an account and follow a broker's procedures, then start trading. You can trade Gold Fields Ltd. stock right from TradingView charts — choose your broker and connect to your account.
Investing in stocks requires a comprehensive research: you should carefully study all the available data, e.g. company's financials, related news, and its technical analysis. So Gold Fields Ltd. technincal analysis shows the buy rating today, and its 1 week rating is buy. Since market conditions are prone to changes, it's worth looking a bit further into the future — according to the 1 month rating Gold Fields Ltd. stock shows the strong buy signal. See more of Gold Fields Ltd. technicals for a more comprehensive analysis.
If you're still not sure, try looking for inspiration in our curated watchlists.
If you're still not sure, try looking for inspiration in our curated watchlists.