GENTM still in sideway
GENM downtrend now from monthly chart.
Weekly chart, I can see the price movements have become slow and in a sideway
Daily Chart - I think i can have a small investment in the sideway box.
To be safe, i put my SL and TP and RR is 1.5:3?
Genting Malaysia Berhad
No trades
Next report date
—
Report period
—
EPS estimate
—
Revenue estimate
—
0.0063 USD
56.09 M USD
2.44 B USD
1.36 B
About Genting Malaysia Bhd.
Sector
Industry
CEO
Kok Thay Lim
Website
Headquarters
Kuala Lumpur
Founded
1980
IPO date
Dec 22, 1989
Identifiers
2
ISIN MYL4715OO008
Genting Malaysia Bhd. engages in the provision of leisure and hospitality services. It operates through the following segments: Leisure and Hospitality, Properties, and Investment and Others. The Leisure and Hospitality segment includes resort activities, gaming, hotels, food and beverage, theme parks, retail, entertainment attractions, tours and travel related services, and others. The Properties segment focuses on property development, property investment, and management. The Investment and Others segment refers to the utilities, reinsurance, yacht charter services, and information technology services. The company was founded on May 7, 1980 and is headquartered in Kuala Lumpur, Malaysia.
Related stocks

GENM, do you make the right move?Especially intraday trades, should minimize their loss when price drop below 2.76.
So far yet has any signal of recovery. Just wait next trading day and see how what's the market maker's next move.
Note : It's often easier to make profits when you're in sync with the overall direction of the mark

GENM - protect the downside It might reach the peak for this round.
>> Need to break the long term downtrend line (pink) but seems it's quite hard to do so.
>> Two road blocks are the top there.
>> Protect the downside.
Let the bull rest / go for holiday.....
When the market moves where, and how, and if - these are all u

GENM (Genting Malaysia). We need "Patience" to buy/hold. 30/6/23Genting Malaysia has gone many years of "honey moon" time for "more bedding time" BEFORE...A "Huge/Giant" ""Tringale" " abcde (green)"running" for "many years" = To Test Our "waiting skills" waiting for 5-10 years.. "Buy and Hold" "Patience" on "BLUE cheap" stock.

GENM | Bottom formingToday's price down with high volume are mainly created during the day bottom price. High volume with price stays the same is a sign of bottoming for our analysis.
However, do take note that this is just a sign of price bottoming. It is not a sign of rebound yet. To catch the rebound, we will need t

GENM - Pullback Completed ?Sign of Strength in the chart:
1. Shakeout Completed
2. Pullback with NS
3. Bullish signal is back
Disclaimer
This information only serves as reference information and does not constitute a buy or sell call. Conduct your own research and assessment before deciding to buy or sell any stock

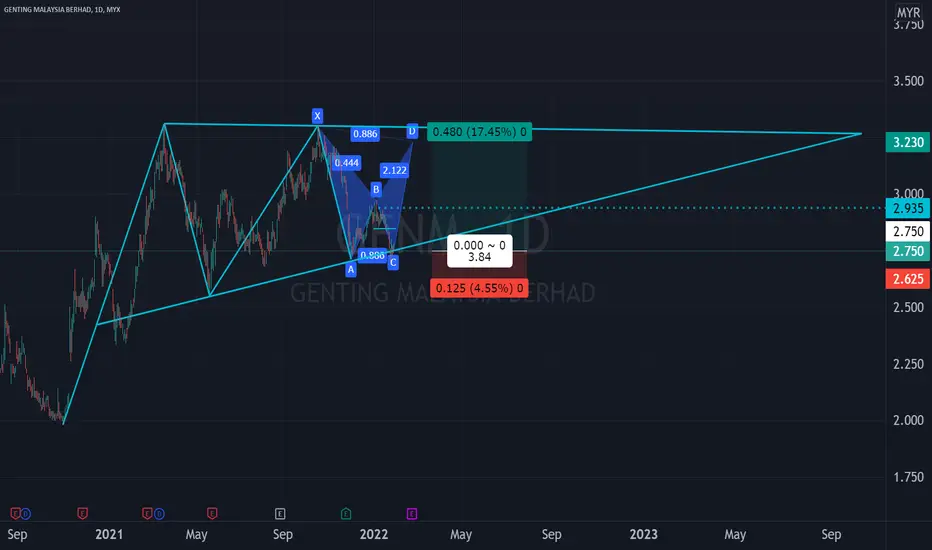
GENM IN HARMONIC PATTERNGENM spotted with bearish bat harmonic pattern rebounding at fib0886 (Point C) where a potential trade can be taken up to fibo886 extension or Point D. The harmonic pattern happens to be inside a bullish pennant. Proposed trade as per chart where the CL is below a yearly pivot (not shown).
GENM VCP SETUPRecovery stocks recently got movement since travel restriction will soon lifted after nationwide achieve 90% vaccination.
GENM observed contraction below:
C1: -21%
C2: -11%
C3: -3% (earliest signal low cheat)
C4: -6%
C5: -4%
Let's monitor its movement. GENTING also has the similar setup.
Disclai

<TradeVSA> Re-Accumulation with Potential VCP SetupCase Study:
1. Genting
2. Genm
Sign of Strength in the chart:
1. Re-accumulation
2. Potential VCP Setup
3. Strong background
Disclaimer
This information only serves as reference information and does not constitute a buy or sell call. Conduct your own research and assessment before deciding to bu

<TradeVSA> Strong Accumulation. Low Risk Now ?Case Studies:
1. WCT
2. SPSETIA
3. GENM
Focus in this video:
1. How to combine weekly and daily chart
2. Sign of Strength with Green Pentagon in both timeframe
3. Background in the Accumulation stage
4. What is a successful Accumulation / Reversal ?
Disclaimer
This information only serves as refer

See all ideas
Summarizing what the indicators are suggesting.
Neutral
SellBuy
Strong sellStrong buy
Strong sellSellNeutralBuyStrong buy
Neutral
SellBuy
Strong sellStrong buy
Strong sellSellNeutralBuyStrong buy
Neutral
SellBuy
Strong sellStrong buy
Strong sellSellNeutralBuyStrong buy
An aggregate view of professional's ratings.
Neutral
SellBuy
Strong sellStrong buy
Strong sellSellNeutralBuyStrong buy
Neutral
SellBuy
Strong sellStrong buy
Strong sellSellNeutralBuyStrong buy
Neutral
SellBuy
Strong sellStrong buy
Strong sellSellNeutralBuyStrong buy
Displays a symbol's price movements over previous years to identify recurring trends.
GMALY5120809
Genting New York LLC 3.3% 15-FEB-2026Yield to maturity
8.48%
Maturity date
Feb 15, 2026
GMALY5890713
Genting New York LLC 7.25% 01-OCT-2029Yield to maturity
6.16%
Maturity date
Oct 1, 2029
GMALY5165455
GENM Capital Labuan Ltd. 3.882% 19-APR-2031Yield to maturity
5.58%
Maturity date
Apr 19, 2031
See all GMALF bonds
EMHD
Invesco FTSE Emerging Markets High Dividend Low Vol UCITS ETFWeight
0.32%
Market value
813.13 K
USD
Explore more ETFs
Frequently Asked Questions
The current price of GMALF is 0.5528 USD — it has increased by 9.16% in the past 24 hours. Watch Genting Malaysia Berhad stock price performance more closely on the chart.
Depending on the exchange, the stock ticker may vary. For instance, on OTC exchange Genting Malaysia Berhad stocks are traded under the ticker GMALF.
We've gathered analysts' opinions on Genting Malaysia Berhad future price: according to them, GMALF price has a max estimate of 0.83 USD and a min estimate of 0.55 USD. Watch GMALF chart and read a more detailed Genting Malaysia Berhad stock forecast: see what analysts think of Genting Malaysia Berhad and suggest that you do with its stocks.
GMALF reached its all-time high on Nov 12, 2013 with the price of 1.4200 USD, and its all-time low was 0.3550 USD and was reached on Apr 8, 2025. View more price dynamics on GMALF chart.
See other stocks reaching their highest and lowest prices.
See other stocks reaching their highest and lowest prices.
GMALF stock is 8.39% volatile and has beta coefficient of 0.15. Track Genting Malaysia Berhad stock price on the chart and check out the list of the most volatile stocks — is Genting Malaysia Berhad there?
Today Genting Malaysia Berhad has the market capitalization of 2.88 B, it has increased by 4.20% over the last week.
Yes, you can track Genting Malaysia Berhad financials in yearly and quarterly reports right on TradingView.
Genting Malaysia Berhad is going to release the next earnings report on Feb 26, 2026. Keep track of upcoming events with our Earnings Calendar.
GMALF earnings for the last quarter are 0.00 USD per share, whereas the estimation was 0.01 USD resulting in a −30.00% surprise. The estimated earnings for the next quarter are 0.00 USD per share. See more details about Genting Malaysia Berhad earnings.
Genting Malaysia Berhad revenue for the last quarter amounts to 796.13 M USD, despite the estimated figure of 653.45 M USD. In the next quarter, revenue is expected to reach 768.45 M USD.
GMALF net income for the last quarter is 28.38 M USD, while the quarter before that showed 98.73 M USD of net income which accounts for −71.26% change. Track more Genting Malaysia Berhad financial stats to get the full picture.
Genting Malaysia Berhad dividend yield was 4.42% in 2024, and payout ratio reached 225.73%. The year before the numbers were 5.58% and 194.55% correspondingly. See high-dividend stocks and find more opportunities for your portfolio.
As of Feb 15, 2026, the company has 16.9 K employees. See our rating of the largest employees — is Genting Malaysia Berhad on this list?
EBITDA measures a company's operating performance, its growth signifies an improvement in the efficiency of a company. Genting Malaysia Berhad EBITDA is 677.92 M USD, and current EBITDA margin is 24.99%. See more stats in Genting Malaysia Berhad financial statements.
Like other stocks, GMALF shares are traded on stock exchanges, e.g. Nasdaq, Nyse, Euronext, and the easiest way to buy them is through an online stock broker. To do this, you need to open an account and follow a broker's procedures, then start trading. You can trade Genting Malaysia Berhad stock right from TradingView charts — choose your broker and connect to your account.
Investing in stocks requires a comprehensive research: you should carefully study all the available data, e.g. company's financials, related news, and its technical analysis. So Genting Malaysia Berhad technincal analysis shows the buy rating today, and its 1 week rating is neutral. Since market conditions are prone to changes, it's worth looking a bit further into the future — according to the 1 month rating Genting Malaysia Berhad stock shows the neutral signal. See more of Genting Malaysia Berhad technicals for a more comprehensive analysis.
If you're still not sure, try looking for inspiration in our curated watchlists.
If you're still not sure, try looking for inspiration in our curated watchlists.