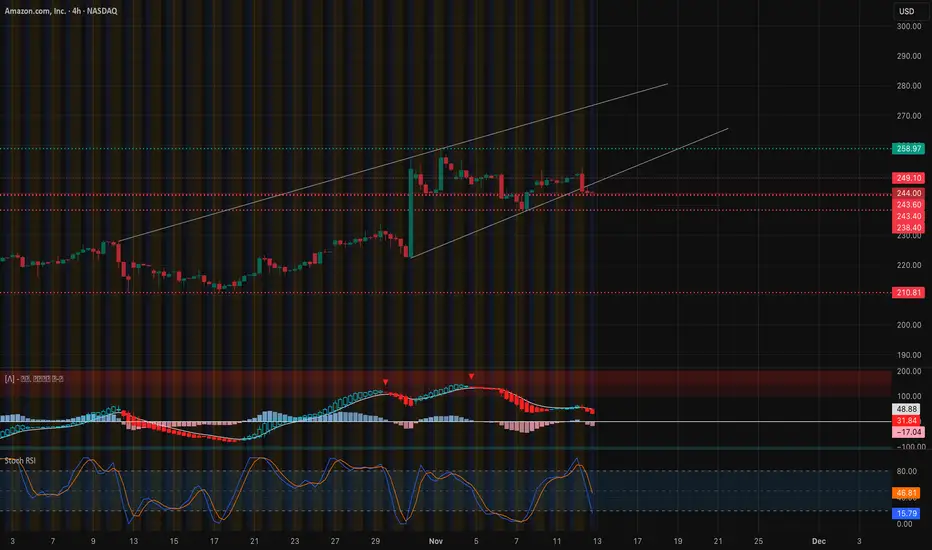
Short??Being the long term trend is up I wouldn’t short this. I’m being patient for a big correction that will widen this channel for the last wave of the long term trend. $96 area is what I’m looking for. Stay patient and don’t fall for the short term momentum swings.
Key facts today
Next report date
—
Report period
—
EPS estimate
—
Revenue estimate
—
26.2 PLN
245.16 B PLN
2.64 T PLN
9.68 B
About Amazon.com, Inc.
Sector
Industry
CEO
Andrew R. Jassy
Website
Headquarters
Seattle
Founded
1994
ISIN
US0231351067
FIGI
BBG01NX6JDG2
Amazon.com, Inc. engages in the provision of online retail shopping services. It operates through the following business segments: North America, International, and Amazon Web Services (AWS). The North America segment includes retail sales of consumer products and subscriptions through North America-focused websites such as amazon.com and amazon.ca. The International segment offers retail sales of consumer products and subscriptions through internationally-focused websites. The Amazon Web Services segment involves in the global sales of compute, storage, database, and AWS service offerings for start-ups, enterprises, government agencies, and academic institutions. The company was founded by Jeffrey P. Bezos in July 1994 and is headquartered in Seattle, WA.
Related stocks

1 HR AMZN Target Area (Green Box)
To the upper right is a green rectangle labeled “TARGET”.
The dotted diagonal green line projects price from the bottom low up into this box.
This represents the bullish target if the reversal continues.
Failed Target Marker
Below the price, far down, there is a dotted y

AMZN Hidden Breakout Setup. TA for Nov. 12–15AMZN Hidden Breakout Setup — Gamma Pressure Building Fast
AMZN has spent the past week moving with a strange mix of strength and hesitation — grinding upward but constantly pausing at the same levels. To most traders, it looks like standard consolidation.
But when you overlay the GEX landscape, sud
Amzn weekly chartI think we are heading into a tough correction based on my personal view.
Look at this divergence on the RSI indicator on the weekly timeframe.
I believe I’m done with this stock.
Good luck 4all🌷

Amazon Raises $15B for AI Expansion — Stock at Key Support ZoneAmazon has launched its first US dollar bond sale since 2022, securing $15 billion to accelerate investments in AI infrastructure. Demand was massive, reaching $80 billion, signaling strong investor confidence in Amazon’s long-term growth story. The funds will support capital expenditures, acquisiti

AMZN at a Critical Turning PointThe chart shows a large Cup & Handle formation, with the neckline marked by the black horizontal resistance. Recently, AMZN broke above this neckline but failed to hold, pulling back to retest the breakout zone.
Right now, price is sitting exactly on a major decision area where:
• The neckline
• T

Derivatives Trading in Emerging Markets1. Understanding Derivatives
A derivative is a financial instrument whose value is derived from the price of an underlying asset. The underlying can be stocks, bonds, commodities, interest rates, exchange rates, or market indices. The most common types of derivatives include forwards, futures, opti
AMZN : Bulls Taking a Pause Before the Next Leg Up!Amazon’s recent surge has hit a temporary Pause, forming a healthy pullback phase. If structure remains intact, another bullish wave could follow soon. Key levels to watch: 238–240 for a potential continuation setup.
Disclosure: We are part of Trade Nation's Influencer program and receive a monthly

Sanctions and Their Role in the Global Market1. Understanding Sanctions
Sanctions are restrictions placed by one country or a group of countries on another nation or entity to enforce international laws or influence political or economic decisions. They are often used as alternatives to military intervention, serving as diplomatic or economic

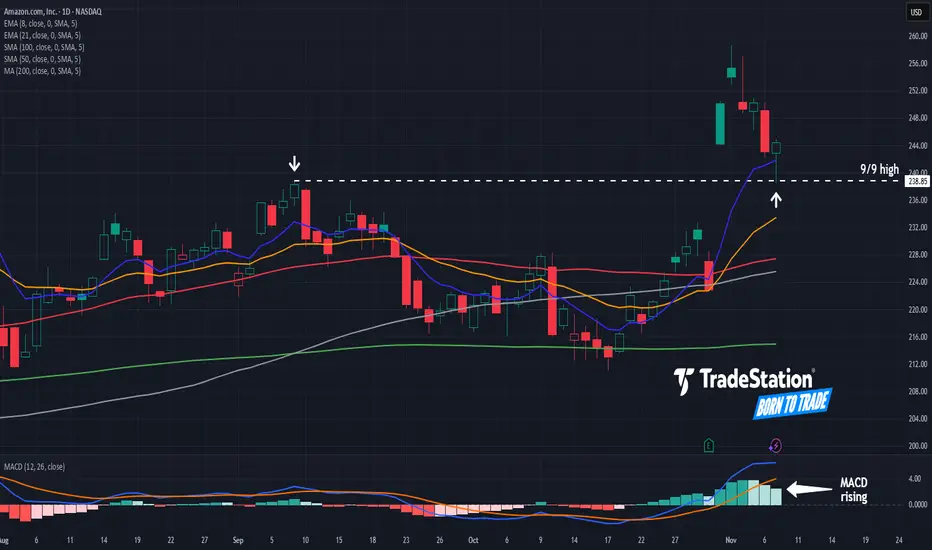
Amazon.com Pulls Back After Earnings BreakoutMomentum from strong earnings propelled Amazon.com to new highs last week, and now it’s pulled back.
The first pattern on today’s chart is the September 9 high of $238.85. The e-commerce and cloud-computing giant tested and held that level last Friday. Has old resistance become new support?
Second
See all ideas
Summarizing what the indicators are suggesting.
Neutral
SellBuy
Strong sellStrong buy
Strong sellSellNeutralBuyStrong buy
Neutral
SellBuy
Strong sellStrong buy
Strong sellSellNeutralBuyStrong buy
Neutral
SellBuy
Strong sellStrong buy
Strong sellSellNeutralBuyStrong buy
An aggregate view of professional's ratings.
Neutral
SellBuy
Strong sellStrong buy
Strong sellSellNeutralBuyStrong buy
Neutral
SellBuy
Strong sellStrong buy
Strong sellSellNeutralBuyStrong buy
Neutral
SellBuy
Strong sellStrong buy
Strong sellSellNeutralBuyStrong buy
Displays a symbol's price movements over previous years to identify recurring trends.
US23135CK0
Amazon.com, Inc. 4.1% 13-APR-2062Yield to maturity
5.55%
Maturity date
Apr 13, 2062
US23135CC8
Amazon.com, Inc. 3.25% 12-MAY-2061Yield to maturity
5.54%
Maturity date
May 12, 2061
AMZN4531868
Amazon.com, Inc. 4.25% 22-AUG-2057Yield to maturity
5.49%
Maturity date
Aug 22, 2057
US23135BT2
Amazon.com, Inc. 2.5% 03-JUN-2050Yield to maturity
5.48%
Maturity date
Jun 3, 2050
US23135CJ3
Amazon.com, Inc. 3.95% 13-APR-2052Yield to maturity
5.48%
Maturity date
Apr 13, 2052
AMZN4996701
Amazon.com, Inc. 2.7% 03-JUN-2060Yield to maturity
5.46%
Maturity date
Jun 3, 2060
AMZN5182959
Amazon.com, Inc. 3.1% 12-MAY-2051Yield to maturity
5.45%
Maturity date
May 12, 2051
AMZN4531866
Amazon.com, Inc. 4.05% 22-AUG-2047Yield to maturity
5.42%
Maturity date
Aug 22, 2047
US23135AQ9
Amazon.com, Inc. 4.95% 05-DEC-2044Yield to maturity
5.24%
Maturity date
Dec 5, 2044
AMZN5182958
Amazon.com, Inc. 2.875% 12-MAY-2041Yield to maturity
5.17%
Maturity date
May 12, 2041
AMZN4531864
Amazon.com, Inc. 3.875% 22-AUG-2037Yield to maturity
4.82%
Maturity date
Aug 22, 2037
See all AMZN bonds
Curated watchlists where AMZN is featured.


Frequently Asked Questions
The current price of AMZN is 800.5 PLN — it has decreased by −6.45% in the past 24 hours. Watch Amazon.com, Inc. stock price performance more closely on the chart.
Depending on the exchange, the stock ticker may vary. For instance, on GPW exchange Amazon.com, Inc. stocks are traded under the ticker AMZN.
AMZN stock has fallen by −12.03% compared to the previous week, the month change is a 4.49% rise, over the last year Amazon.com, Inc. has showed a −4.91% decrease.
We've gathered analysts' opinions on Amazon.com, Inc. future price: according to them, AMZN price has a max estimate of 1,319.50 PLN and a min estimate of 916.32 PLN. Watch AMZN chart and read a more detailed Amazon.com, Inc. stock forecast: see what analysts think of Amazon.com, Inc. and suggest that you do with its stocks.
AMZN reached its all-time high on Feb 4, 2025 with the price of 974.8 PLN, and its all-time low was 622.9 PLN and was reached on Apr 7, 2025. View more price dynamics on AMZN chart.
See other stocks reaching their highest and lowest prices.
See other stocks reaching their highest and lowest prices.
AMZN stock is 6.90% volatile and has beta coefficient of 0.24. Track Amazon.com, Inc. stock price on the chart and check out the list of the most volatile stocks — is Amazon.com, Inc. there?
Today Amazon.com, Inc. has the market capitalization of 9.12 T, it has decreased by −3.59% over the last week.
Yes, you can track Amazon.com, Inc. financials in yearly and quarterly reports right on TradingView.
Amazon.com, Inc. is going to release the next earnings report on Jan 29, 2026. Keep track of upcoming events with our Earnings Calendar.
AMZN earnings for the last quarter are 7.10 PLN per share, whereas the estimation was 5.71 PLN resulting in a 24.34% surprise. The estimated earnings for the next quarter are 7.15 PLN per share. See more details about Amazon.com, Inc. earnings.
Amazon.com, Inc. revenue for the last quarter amounts to 655.71 B PLN, despite the estimated figure of 647.50 B PLN. In the next quarter, revenue is expected to reach 774.06 B PLN.
AMZN net income for the last quarter is 77.11 B PLN, while the quarter before that showed 65.55 B PLN of net income which accounts for 17.64% change. Track more Amazon.com, Inc. financial stats to get the full picture.
No, AMZN doesn't pay any dividends to its shareholders. But don't worry, we've prepared a list of high-dividend stocks for you.
As of Nov 19, 2025, the company has 1.56 M employees. See our rating of the largest employees — is Amazon.com, Inc. on this list?
EBITDA measures a company's operating performance, its growth signifies an improvement in the efficiency of a company. Amazon.com, Inc. EBITDA is 515.61 B PLN, and current EBITDA margin is 19.15%. See more stats in Amazon.com, Inc. financial statements.
Like other stocks, AMZN shares are traded on stock exchanges, e.g. Nasdaq, Nyse, Euronext, and the easiest way to buy them is through an online stock broker. To do this, you need to open an account and follow a broker's procedures, then start trading. You can trade Amazon.com, Inc. stock right from TradingView charts — choose your broker and connect to your account.
Investing in stocks requires a comprehensive research: you should carefully study all the available data, e.g. company's financials, related news, and its technical analysis. So Amazon.com, Inc. technincal analysis shows the strong sell today, and its 1 week rating is strong sell. Since market conditions are prone to changes, it's worth looking a bit further into the future — according to the 1 month rating Amazon.com, Inc. stock shows the strong sell signal. See more of Amazon.com, Inc. technicals for a more comprehensive analysis.
If you're still not sure, try looking for inspiration in our curated watchlists.
If you're still not sure, try looking for inspiration in our curated watchlists.