JSE:PRX Prosus Following Naspers Down!Prosus is being distributed on the back of Naspers - see posts below. Time to watch for the volatility.
1TY trade ideas

JSE:PRX Prosus As with Naspers Prosus has made me wait after observing some weakness in the stock. However, change of character on a significant reversal bar after a failed test is likely confirming that the up sloping trading range is a distribution range and we could see the start of the markdown process starting.

PRX The chart is an extract from my weekly report.
Prosus N.V (PRX, R1864.66) | Pivot Cleared | The share currently trades close to it's all time highs, having cleared the overhead resistance (R1765/1800) in place since July 2020. Over the same period, we note the price having made higher lows, which signifies buyers becoming more aggressive on each pullback. Traders/investors want to remain long as long as the R1765/1800 level is held. The accompanying chart timeframe is monthly which shows the Relative Strength Index with a 75 reading (very strong rank).

Observation - Value Discount PROSUS VS TENCENT- Some interesting stats when viewing the difference between TENCENT & PROSUS since September 2020.


Shooting Star on ProsusJSE:PRX has been trading in somewhat of a channel since April 2020. Two day's a go it broke out of the channel and looked like it would continue up, but instead formed a shooting star pattern. Yesterday and today are showing strong downward momentum. We could see a move towards the bottom of the channel or to the support level at around 150000.

Strong Bullish Signals for Prosus (PRX) Fundamental Analysis
1. Industry: Ecommerce, Social and Internet Platforms ++
2. Price: Relatively Cheap
3. Analyst Consensus Target: 145 (Tipranks)
4. Risk-Reward Ratio: 1:6
5. 5Y EPS Growth: 20-40% (Simply Wall St)
Technical Analysis
1. Volume is growing
2. Support of the MA 100 line (1h)
3. Boilinger Percentage: 35% (high short-term potential)
4. Morningstar growth rate: A
5. Short-term target: 100
6. Long term target: 140

Sell signal Prosus N.V. Just entered a short position in EURONEXT:PRX .
Entry @ 87,75
Stop @ 91,20 (-3,9%)
Target @ 75,20 (+14,3%)
There's long term divergence MACD (sell signal given) and RSI (sell signal given). DMI confirms with a DI - > DI + and ADX rising; confirming downtrend.
At the moment there's some gap filing going on, it's just waiting for the red rising support line to be broken and the next down gap to be made ...
Target is the support @ 75,20 which has been formed with big volume, so I assume it's kind of solid.

JSE:PRX Prosus Following Naspers Down?With Prosus shareholding in Naspers it is following the trend down (See post below) and we are now looking for a markdown to occur. We are looking for a markdown to below R1200.


Sloped Kijun!Its a good start to the week for PRX on the weekly. We seem to bouncing off the weekly kijun which is sloped upwards. If this continues we should have enough momentum to reach the weekly tenkan around 163208 zone, which is our target. The lagging span is free to move as well which is a good for our hypothesis. We entered the trade on the daily after a convincing move today at close of session which broke through the daily tenkan. Caution should be taken because on this same timeframe the lagging has a strong resistance at the ssb region of 156645 which could send price down again.
Entry: 155 800
TP: 168 208
SL: 149 751
RR: 1.31

PRX Bull-Bear ViewThe 7-day RSI is extremely oversold with a 20 reading in which case we may see an oversold bounce. On the other hand the US tech sector sold off sharply on Friday which may see follow-through to Tencent which could lower levels for PRX. The selling pressure has been significant as evidenced by the large red candles but to say that continues would be backward-looking whilst at the same time extrapolating. The share is however below it's downward-trending 8/21 moving averages tilts the bias to the downside.
Bull Approach: There's a gap to be closed at R1432 which may be closed (and potentially overshoot) however this is close to the swing lows in the range of 1405-1435.
Bear Approach: Sell the rallies into the 8-day, currently at ~R1560-R1610.76.
This chart forms part of a larger research report and should not be viewed as a recommendation to buy/sell.


PRX - Adding some shares on this backtest of bullish breakoutPRX has been in a strong uptrend ever since it broke out of BLUE falling channel (note the perfect backtest of this breakout with the doji on May 4th). Now it's broken out of BLACK bullish ascending triangle, which has a conservative target of 93.40. Recent weakness looks like a backtest of triple support (the ascending triangle's flat and rising trendlines, and the 20 dma), and thus presents an attractive entry point for those who are bullish on this stock. Even if the RED trendline were to keep acting as resistance in the future, the price target can still be reached in little over a month.
Full disclosure: long PRX at 0.9% of total assets. While being a european company listed in Amsterdam, this stock is a great proxy for emerging market tech and especially e-commerce stocks, of which PRX holds a big diversified portfolio. It is almost a little EM tech fund in and of itself.

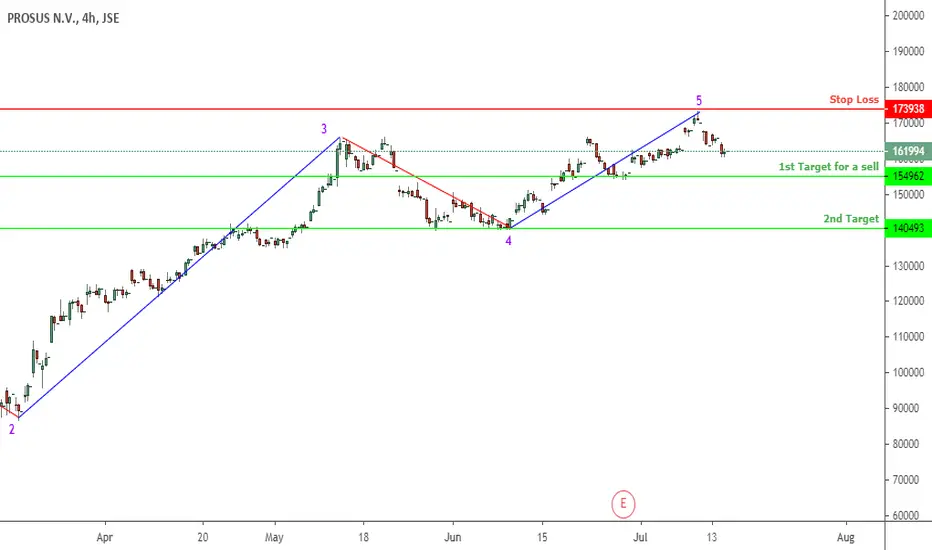
#Prosus - Sell $JSE#Prosus #PRX - Market has found resistance at 173224, good opportunity to short it, 1st TP is 154962 and 2nd TP is 140500.
PRX*Extract from client research note 01-June-2020
Following a significant appreciation off the March lows, the share has retreated with the strength of the Rand being one of the major drivers. The price has slipped below both it’s 8 and 21-day exponential moving average with the current retracement being -14% from it’s peak of 166046c. While the immediate and short term trend remains down, the price is approaching it’s 50-day EMA which is in line with the top of the upward trending channel in place since 10 December 2019 as well as the ‘gap’ created on 05 May 2020. Now I don’t know if we’ll see a rebound at that level as we also have a ‘gap’ at 132101c, created on 16 April hence we may see the price target the mid-point of the channel before making a bullish reversal.

Possible Trend Reversal on ProsusJSE:PRX formed a bearish harami on Thursday last week which is a top reversal signal.
This was confirmed by the break through the upward trendline and the stochastic.
This could mean a move downward for a while if confirmed by breaking below the low of last Wednesday.

PRX PRX 134937c - RSI bearish divergence (daily chart) and rolling over - extended beyond upward trending channel. MoM +55%.
Looking at a pullback.


PROSUS - Added to the watchlist- Interesting break of the down trend
- I would like to see price come back and test this downtrend then continue up to enter a long
JSE:PRX
- MANAGE YOUR RISK -
Disclaimer: All ideas are my opinion and should not be taken as financial advice.

Prosus: Attempting To Make A RecoveryEquities | PRX Prosus 992.47
- is attempting a recovering. System signaling RSI (Daily) attempting to cross above the 30 level
- Bullish divergence as per RSI
- Candle structure sees long tail/shadow being developed today
