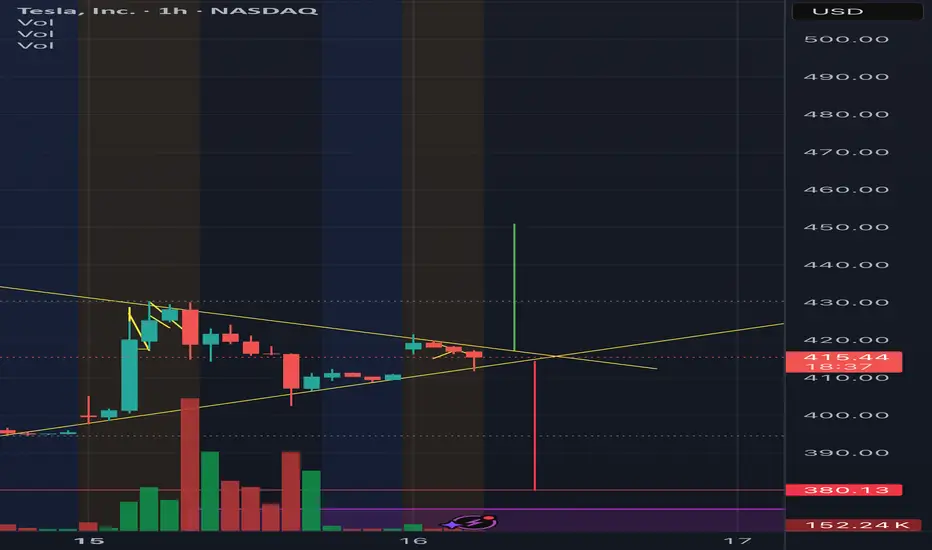
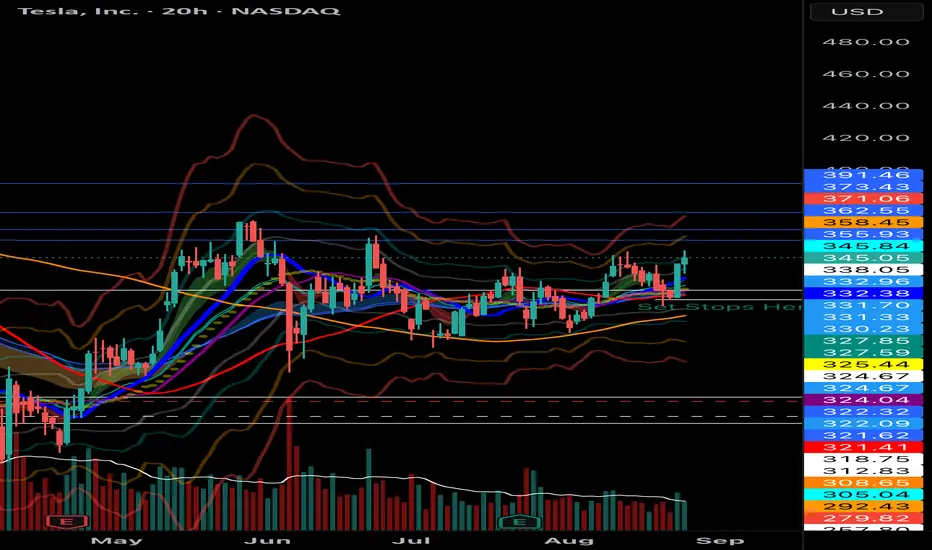
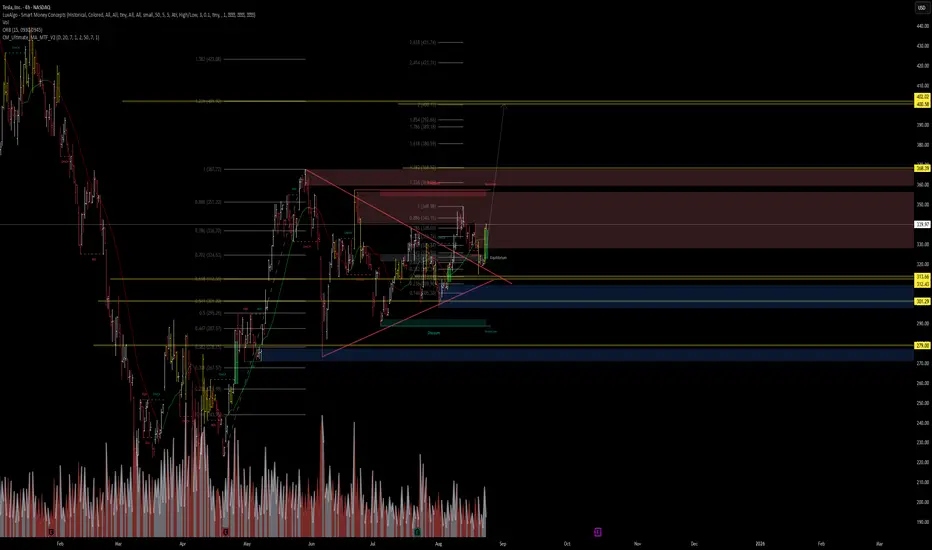
You will ask yourself, "how did he know Tesla would do that"?I wrote this on my July 29th chart description (below):
"Price action really has less to do with the news making Elon a hero, then a villain and then back and forth...but moreso to do with price action patterns that just keep repeating". Since then, the pattern has played out exactly as anticipated, and my 1st take profit target just hit (+22%).
July 29th chart:
Now the question remains, will Telsa hit my next target range (T2). Although it is a much larger range than my T1, I will monitor price action closely and use TA to get out near the top before the next major retracement.
Let me know if you're into Tesla and if you are interested in me charting the top of this run.
May the trends be with you.
TL0 trade ideas

TESLA BULLISH,READ NOTES SEP 11 2025Tesla is looking bullish to break this consolidation. Initial target would be $390. Now breakout is an expectation so always manage your risk.
NOTE: LOOKING BULLISH TO BREAKOUT

Tesla breakout set up 2 potential moves for Tesla on 15 min chart should happen around the retail data release in the US.
TSLA: WAVE CTSLA has been consolidating within a range since early June and is expected to breakout over the next few weeks. As the markets are due to end a minor wave 4, the final wave 5 should allow TSLA to breakout out to the upside to a potential target of $422.

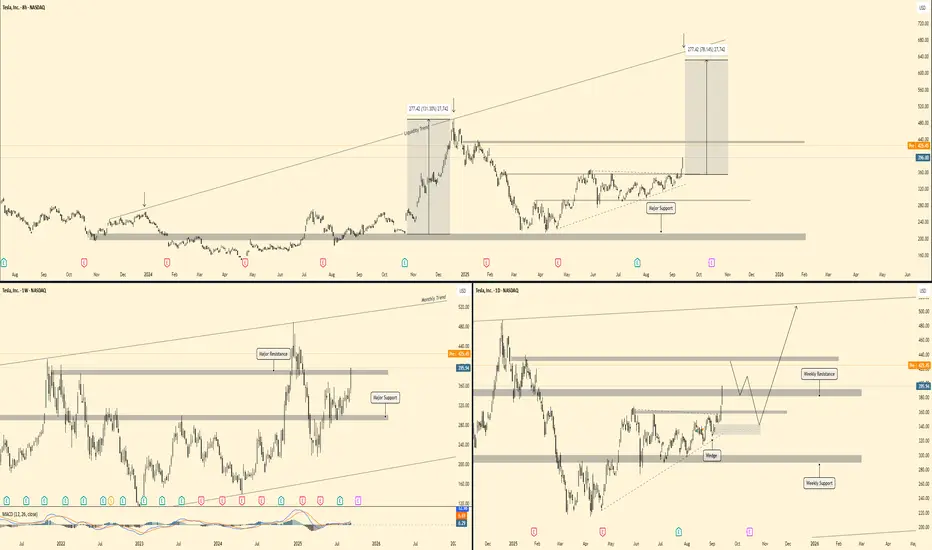
Tesla - Forecast (Before and After)🕰 Weekly View
Price is holding above major support at 325–340 and pushing into weekly resistance around 420–440. The broader monthly trend points higher, with upside liquidity aligned toward the 500–520 zone.
📉 Daily Structure
Resistance: 420–440 supply zone.
Support: 325–340 demand zone, with a secondary base near 280.
Price has broken from a wedge formation and is now testing overhead supply, with potential to retest support before continuation.
⏱ 8H Breakdown
Tesla has been trending steadily upward off major support. Clean structure shows momentum building. A breakout and retest scenario could drive price toward 500+ targets, while failure at 420–440 could cause a pullback into 360–380 support.
🔎 Outlook
Scenario 1 → Retest support (360–380) before continuation higher.
Scenario 2 → Clean breakout above 440 accelerates into 500–520 zone.
Bias : Bullish continuation → mid-term target 500+.
$TSLA Daily Bands Finally TightNASDAQ:TSLA daily bands are finally tight. Can see a bigger move here. OTM calls came in at the lows this morning. 350C 11/21/25 @ 25.43 for 2.5 million
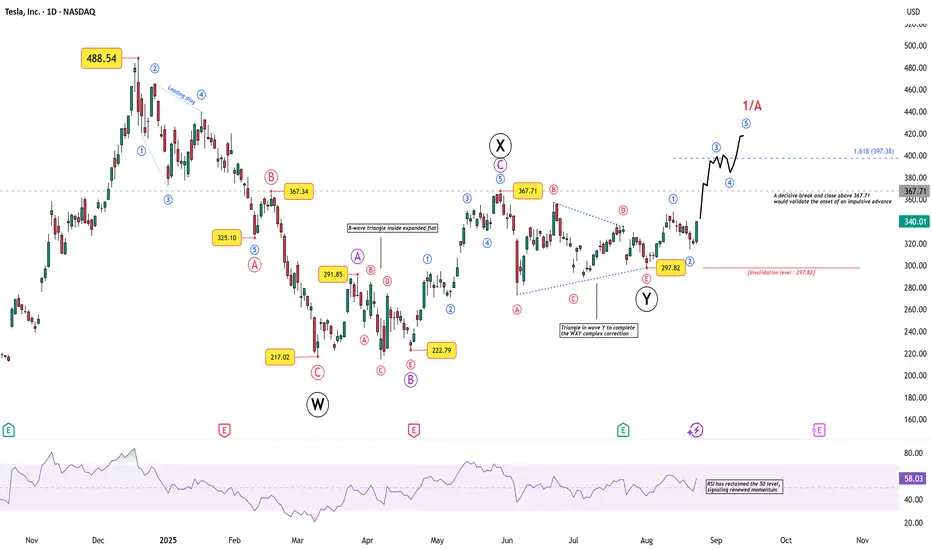
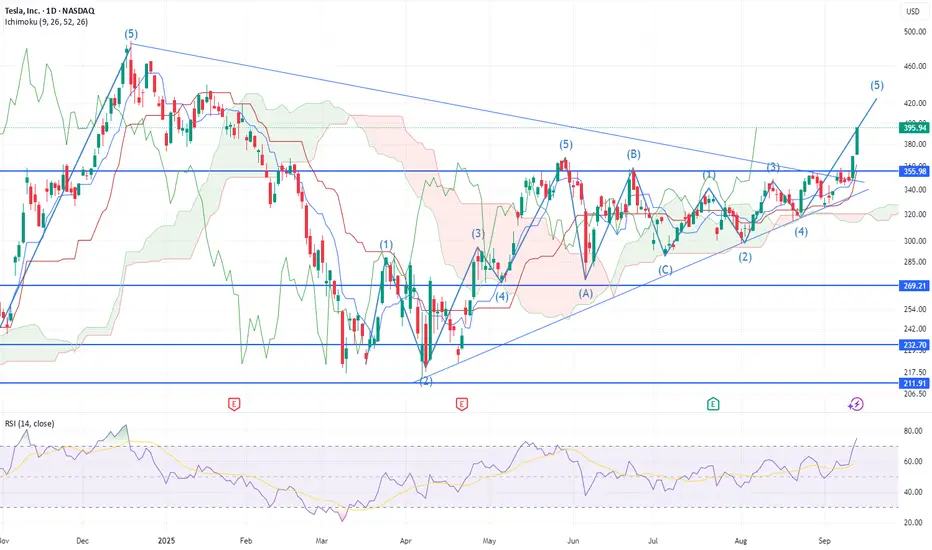
Tesla’s Breakout Test: Impulse or Fakeout?Tesla’s recent price action is stirring interest again, not just for retail traders but also for chart technicians who track Elliott Wave structures across global equities.
After a deep corrective phase that carried price down from 488.54 to 217.02 , Tesla has been carving out a multi-layered corrective structure. Here’s the breakdown:
Wave W completed into 217.02 , marking a sharp low.
This was followed by a complex X wave , which included an expanded flat where the B-wave unfolded as a triangle — a rare but valid corrective formation.
Wave Y then ended with a contracting triangle, neatly completing the W–X–Y correction near 297.82 .
From that point, Tesla appears to have begun an impulsive sequence:
Wave 1 and 2 are already visible, with the 297.82 low as the key invalidation level.
A decisive break and close above 367.71 would confirm the onset of Wave 3, targeting 397.38 (1.618× Wave 1).
Momentum is supporting the structure: RSI has reclaimed the 50 level, hinting at renewed strength.
What Next?
If the count holds, Tesla could be in the early stages of a larger impulsive rally, with Wave 1/A projecting toward the 400–420 zone . However, traders should remember that breaking below 297.82 invalidates the impulsive outlook and revives the broader corrective scenario.
Disclaimer: This analysis is for educational purposes only and does not constitute investment advice. Please do your own research (DYOR) before making any trading decisions.

TSLA eyes on $409.56: Golden Genesis fib to hold "High Ground"TSLA has been surging based on various news.
Now retracing towards a Genesis fib at $409.56
Clean bounce would indicate very strong trend.
Golden Genesis fibs are important milestones.
High gravity fibs can capture price into orbit.
Expect consolidation around it then sling shot.
.
Previous analysis that caught a PERFECT BOTTOM:
Hit BOOST and FOLLOW for more such PRECISE and TIMELY charts.
========================================================
.

TSLA 1H + GEX Game Plan for Tue, Sep 16TSLA Cooling After a Monster Run — Will 410 Hold or Is 430 Next? ⚡️
Market Structure (1-Hour View)
* Sharp run-up: TSLA ripped from mid-300s to a peak around 430 and is now consolidating in a broad rising channel.
* Trend support: Current pullback is testing a rising channel floor near 405–410.
* Momentum: MACD still in a bearish cross with fading histogram; Stoch RSI is climbing out of oversold — early sign of a potential rebound.
Key Levels to Watch
* Resistance: 410.8 (current pivot), 420.0–422.0, and 430.4 (recent high / gamma wall).
* Support: 402.2, 395.9, then deeper supports near 346.1 and 340.0 if momentum collapses.
GEX Read (Sep 16)
* Highest positive NETGEX / Call resistance: 430.4
* 2nd Call Wall: ~420–422 area.
* HVL / gamma pivot: 356–357.
* Put walls: 320 and 305.
* Options sentiment: Calls >100% (very call-heavy), IVR ~20, IVx ~65.9 — big bullish skew but with elevated implied volatility.
Implication:
* Dealers may keep TSLA pinned around 400–420 for balance.
* A strong reclaim of >420 with volume invites a retest of 430.4 and possibly higher.
* Lose 402 and a slide to 395–390 is possible.
Trade Scenarios
1) Bullish Continuation
* Trigger: 1H close >412–415 with uptick in volume.
* Entry: 414–415 on retest.
* Targets: 420 → 430.4.
* Stop: Below 408.
* Options: 420/430 call debit spread expiring this week.
2) Range Fade
* Trigger: Failure to clear 415 with repeated rejection wicks.
* Entry: 413–414 short.
* Targets: 402 → 395.9.
* Stop: Above 417.
* Options: 410P or 415/402 put spread for quick fade.
3) Deeper Pullback
* Trigger: Clear 1H break <402 with retest fail.
* Entry: 401–402 short.
* Targets: 395 → 390, with a stretch toward 356–357 (HVL) if heavy selling accelerates.
* Stop: Back above 406.
Options: 400/390 put spread for a measured pullback.
Scalping & Swing Notes
* First test of 410–412 will set the early tone; quick rejections there can produce a 5–10 point scalp.
* If we gap near 400, watch for a sweep into 395 then bounce back toward 410.
Risk & Management
* Keep sizing conservative: TSLA’s elevated IV means sharp intraday swings.
* Scale out partials at first target and tighten stops if momentum accelerates in your favor.
This analysis is for educational purposes only and does not constitute financial advice. Always trade with a plan and manage risk carefully.

TSLA Volatility Contraction Pattern (VCP) LONG When TSLA breaks above 350 and closes, the price will launch to $390 very quickly.
A VCP is a technical pattern, showing lessening declines in a range bound formation. A bull flag showing higher-lows is the best, as seen with TSLA.
Volatility is going to breakout sharply to the upside. If you TSLA above 350 just buy and hold, you’re too late trying to get a better deal.
🚀🚀🚀🌖
Tesla's $395.94 Price: Bullish Cup-and-Handle Setup Suggests Bre
Current Price: $395.94
Direction: LONG
Targets:
- T1 = $410.00
- T2 = $430.00
Stop Levels:
- S1 = $385.00
- S2 = $375.00
**Wisdom of Professional Traders:**
This analysis synthesizes insights from thousands of professional traders and market experts, leveraging collective intelligence to identify high-probability trade setups. The cup-and-handle formation in Tesla's price chart has generated considerable attention among seasoned investors, who generally consider it a strong bullish continuation pattern. This consensus suggests that Tesla's stock has robust momentum approaching critical breakout points. Observing key support levels while aligning with price trends is the cornerstone of this thesis.
**Key Insights:**
Tesla has been trading within a consolidative range over recent weeks, forming a bullish cup-and-handle chart pattern. The "handle" phase, indicative of a slight correction or pause after the cup-like curve, suggests that investor sentiment remains cautiously optimistic, waiting for key resistance levels to break. The $400 psychological barrier acts as interim resistance, but once breached, technical indicators point to the possibility of upward momentum extending toward $410 and beyond.
The RSI (Relative Strength Index) remains below overheated levels, indicating room for further bullish movement. Volume-weighted price action reinforces Tesla's resilience, as buyers appear to regain control after each minor dip. Furthermore, institutional traders have indicated increasing interest around this asset, implying confidence in Tesla’s long-term trajectory.
**Recent Performance:**
Tesla’s price has climbed steadily over the past month, rebounding from a low of $365 and rallying toward the current price of $395.94. The stock has exhibited an impressive ability to recuperate losses following volatility spurred by macroeconomic developments. Despite temporary periods of nervous selling, Tesla has surpassed its 50-day moving average with signs of continued strength. This movement has been aided by lower-than-expected inflation data, which fuels broader equity market optimism.
**Expert Analysis:**
Technical analysts have underscored Tesla’s structural integrity, specifically pointing at the cup-and-handle pattern as a textbook bullish configuration. Experts note that a sustained close above $400 could trigger aggressive buying interest from trend-following traders. Meanwhile, fundamental investors remain focused on Tesla’s growth prospects in EV battery technology and autonomous driving innovations, which support the company’s narrative as a potential market disruptor. On the technical front, Tesla’s MACD (Moving Average Convergence Divergence) indicator has started to turn positive, supporting upward price action.
**News Impact:**
Tesla recently announced advancements in its full self-driving (FSD) software and increased its footprint in international markets. These developments have sparked optimism among investors, particularly as governments worldwide tighten regulations on emissions and favor green technology initiatives. Moreover, reports of Tesla’s cost-cutting measures in battery production have strengthened its competitive advantage within the EV market. These factors provide a compelling narrative for bulls seeking to capitalize on its technological edge and market dominance.
**Trading Recommendation:**
Given Tesla’s bullish technical setup and fundamental resilience, initiating a LONG position at the current price of $395.94 is recommended. Targeting $410 and $430 ensures alignment with major resistance points, while employing stop levels at $385 and $375 protects against market retracements. Combining price action analysis with Tesla’s growing market visibility supports this trading recommendation. Traders should monitor volume levels closely for confirmation of a breakout beyond key psychological resistance zones.
Do you want to save hours every week?

TSLA SELL AT $426! Retracement to $372 imminent TSLA was a perfect ascending bullish triangle, yes, I drew the Elliott Wave wrong but got the calls right at $300 ($339 first target) and bounce off support at $324.80 ish (separate post). Remember the $7500 EV credit expires soon so there will likely be a pull forward of purchases this quarter which could temporarily juice the stock. We could see all time highs but first we must retrace once target of $426 is reached.
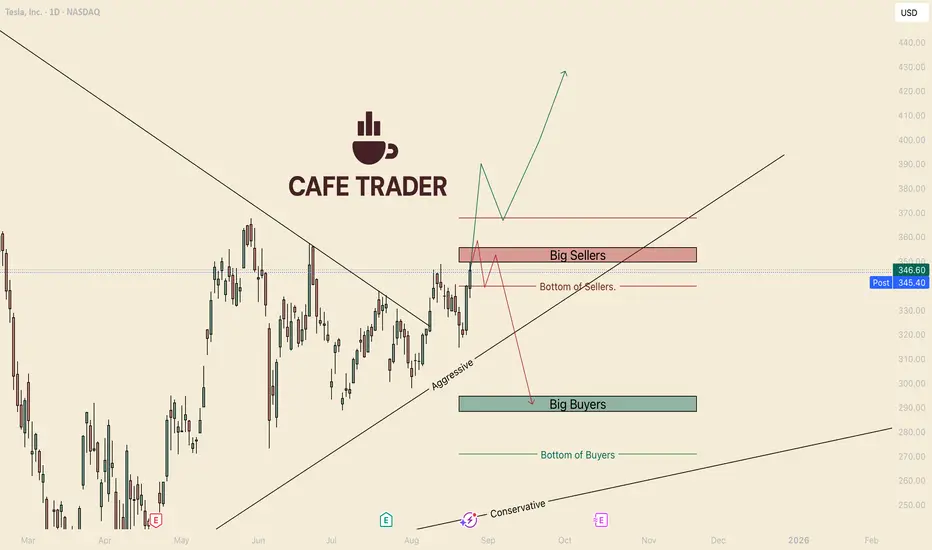
TESLA's Make it or Break it WeekHello I am the Cafe Trader.
Today we are taking another look at Tesla. Everyone knows what a beast this has been in the past, I am going to prep you on what to do when awakens.
As of today, we sit under the last strong seller before the 400's, breaking this and holding (a close above on a Friday) would make a strong case to test highs (minimum).
Overall, I still think there is a strong case for the downside, but this seller determines everything. This is due to the time we have been in the top of the range. So here are your two scenarios
Green Scenario
If Tesla can push through the strong seller zone (roughly 350–365) and actually close above it, then bulls would gain full control. That opens the door for a continuation move toward 400+.
If this happens, I will publish some trade ideas with a new chart.
Red Scenario
If This Seller continues to flush out these buyers, this could spark a large reaction to the downside. In that situation we would be looking for a move back into the big buyer zone around 290. A failure there could drag us all the way to the conservative trend line near 270.
Personally I lean short biased in the next 2-4 weeks, Very bullish over the next few years.
Hope you enjoyed, please DM or comment with questions or another stock you would like analyzed.
Happy Trading
@thecafetrader
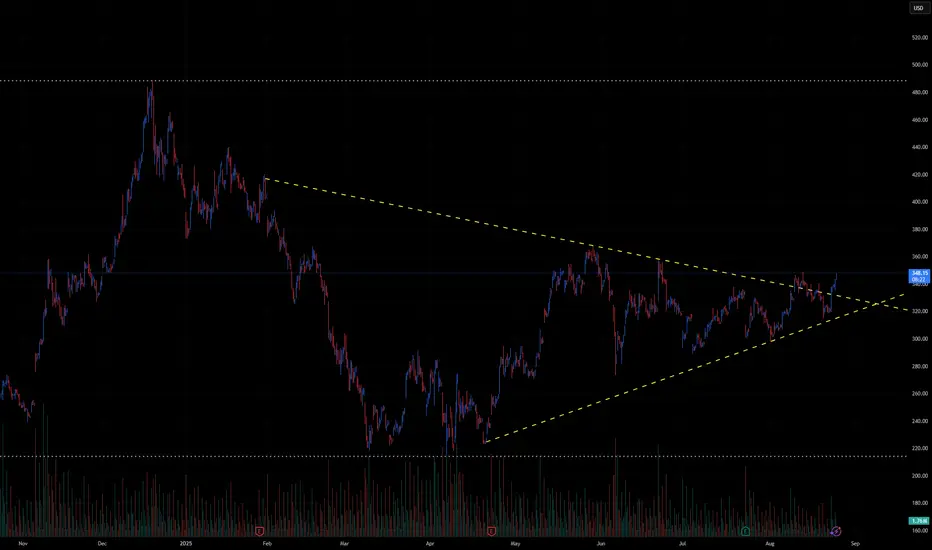
TSLA Technical Outlook – Symmetrical Triangle Breakout Watch🚗 TSLA Technical Outlook – Symmetrical Triangle Breakout Watch
Ticker: TSLA (Tesla, Inc.)
Timeframe: 30-minute candles
🔍 Current Setup
TSLA has been consolidating for months inside a large symmetrical triangle, marked by:
Descending resistance: from ~380 down to ~347.
Ascending support: from April lows near ~240, now rising toward ~320.
Current price: ~348, testing the upper boundary of the triangle.
This structure signals compression after a major downtrend, and the breakout direction will likely define TSLA’s next big move.
📊 Breakout Levels
🚀 Upside (Bullish Scenario)
Trigger: Break and close above 350–355.
Intermediate Targets:
370–380 → First resistance zone.
400–420 → Extension levels.
Measured Move Target: ~450+ (based on the triangle height projection).
🔻 Downside (Bearish Scenario)
Trigger: Failure at resistance and break below 320, confirmation under 310.
Intermediate Supports:
300 → Psychological level.
280–260 → Stronger support zone.
Measured Move Target: ~250 (triangle projection downward).
📈 Volume Analysis
Volume has been contracting steadily during the triangle’s formation.
A major volume spike will be key to confirming whichever direction TSLA chooses.
⚖️ Probability Bias
TSLA is at the make-or-break resistance zone (~350).
A breakout above 355 would strongly favor bulls, targeting 380 → 400+.
But a rejection here and break below 320 would shift momentum bearish, sending TSLA back toward 280–260.
✅ Takeaway
TSLA is at a critical inflection point inside a long-term triangle:
Bullish Break > 355: Targets 370 → 400 → 450+
Bearish Break < 320: Targets 300 → 280 → 250
Watch for volume-backed confirmation, as this move could define Tesla’s next multi-week trend.
Long way to go - BEARISHNASDAQ:TSLA still has a long runway before robotaxis deliver meaningful revenue or global car sales improve (if at all). Lower rates are a prerequisite and execution from Musk remains critical. Despite the chatter, this is not a bullish breakout. It’s a large symmetrical triangle forming as we enter seasonally weak months, with global EV sales slowing, robotaxi rollout lagging, and ongoing political overhang.

#TSLA "third big leg up"This is what I see as a logical continuation just by looking at the chart. I also think that Elon can make it happen. I don't like to read long explanations so I won't write one. Don't want to add to the noise. A picture is worth a thousand words.
Limiting beliefs anybody?

TSLA: AI + Technicals Meets Macro TailwindsAI Forecast (VolanX Protocol)
Current Price: $340.01
30-Day Target: $387.70 → +14.0% upside
Institutional Trade Plan:
Entry: $340.01
Stop Loss: $314.45
Targets: $346.81 / $387.70
Risk/Reward: 1.87:1
Model Agreement: 8/9 bullish
Technical Structure (4H Chart):
Broke above a triangular consolidation, now testing equilibrium from below.
Key support levels: $313.60 / $301.30 (discount zone).
Resistance / extension zones lined up at:
First: $368–$369
Extended: $400–$402 (1.618–2.618 fib levels).
Macro Catalysts & Market Context:
Fed Rate Sentiment Improving: Powell hinted at possible September rate cuts; markets rallied with Tesla leading, rising 6%.
Value Sense Blog
+6
Barron's
+6
Investors
+6
Investopedia
+1
EV Tax Credit Flexibility: New IRS guidance allows buyers to secure the $7,500 credit via contracts before Sept 30, potentially boosting demand.
Investors
+1
Mixed Q2 Fundamentals: Q2 saw declining deliveries & regulatory credits; Musk warned of “rough quarters” ahead, but emphasized AI & robotaxi growth.
Investors
+6
Investors
+6
New York Post
+6
Geopolitical Risks & Tariffs: Tariff pressure, fading EV credits, and sales underperformance in key regions keep long-term risks present. Analyst targets range widely.
Investopedia
MarketWatch
Value Sense Blog
Investors
Probabilistic Outcome Mix:
Base Case (50%) → $346–$368 (near-term resistance test aligned with AI target)
Bull Extension (25%) → $387–$402 if macro tailwinds persist and structure sustains breakout
Bear Risk (25%) → Breakdown below $340 could retest $313–$301
Trade Setup Breakdown:
Long Entry: $340
Stop: $315
Take Profit #1: $368
Take Profit #2: $388
Option: scale into $400s if breakout momentum holds
Why It Matters:
This setup represents AI-driven momentum meeting technical trend alignment and favorable macro catalysts. If Fed signals, EV policy flexibility, and optimism around Tesla’s AI/autonomy can power continued upside, $387–$400 becomes very plausible. However, macro risks and execution hurdles need monitoring.
The Anatomy of a TSLA Retracement TradeBased on a detailed analysis of Tesla's recent price action, a compelling bearish thesis suggests that the stock is poised for a significant retracement. The current market structure indicates that the recent rally may be unsustainable, necessitating a retest of a critical support level to re-establish a more stable foundation.
The Bearish Hypothesis: Retracement to Trendline Support
The core thesis is that the price is set to retrace and test the integrity of the ascending diagonal support trendline. This is not an indication of a full trend reversal, but rather a high-probability correction. T
This corrective phase will likely see the price descend to the lower boundary of the channel. A retest of this key support trendline is a common and healthy technical pattern.
Trade: A short position could be considered upon a clear rejection at the recent highs or upon a decisive breakdown of a minor support level, with the primary profit target being the ascending diagonal support trendline.

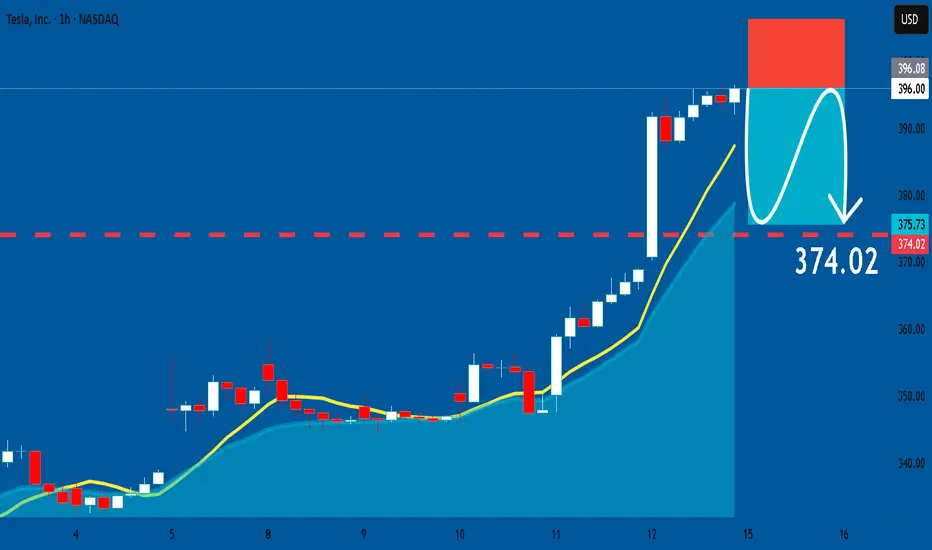
TESLA : Short Signal Explained
TESLA
- Classic bearish setup
- Our team expects bearish continuation
SUGGESTED TRADE:
Swing Trade
Short TESLA
Entry Point - 396.08
Stop Loss - 406.37
Take Profit - 374.02
Our Risk - 1%
Start protection of your profits from lower levels
Disclosure: I am part of Trade Nation's Influencer program and receive a monthly fee for using their TradingView charts in my analysis.
❤️ Please, support our work with like & comment! ❤️
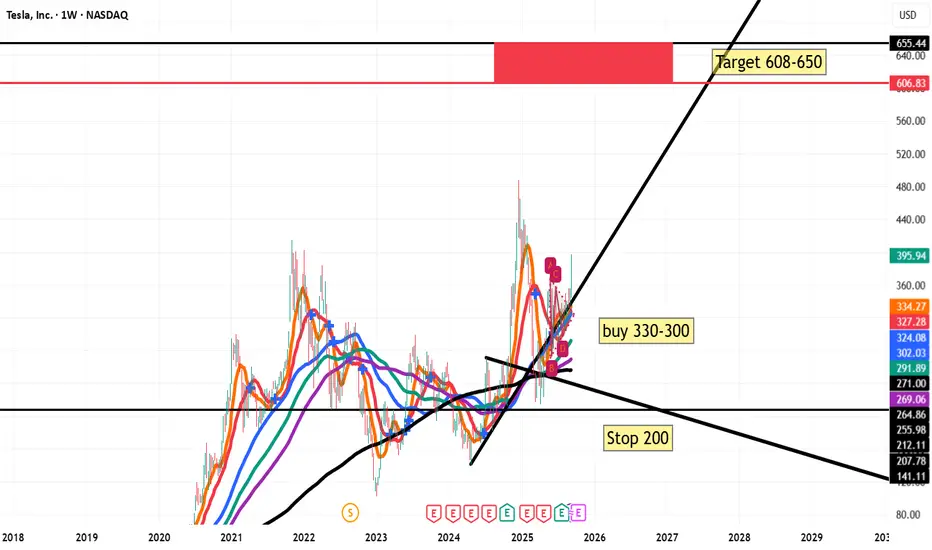
TSLATechnical Analysis (Weekly Chart – TSLA, NASDAQ):
Current Price: $395.94 (+12.85% in the latest session), showing strong bullish momentum.
Support Zone (Buy Area): The chart highlights an attractive buying range between $300–330, where multiple moving averages converge, acting as dynamic support.
Stop-Loss: Placed at $200, which sits well below the long-term trendline and previous key support. This ensures risk control in case of a major reversal.
Target Zone: The bullish projection is toward the $608–650 area, aligning with previous resistance levels and a strong supply zone from 2021–2022.
Trend & Structure:
The stock recently broke out of a consolidation pattern (A–B–C–D) with strength, supported by high volume and upward momentum.
Long-term moving averages (200-week shown in black) are flattening and turning up, signaling a potential multi-year bullish reversal.
If price sustains above $330, the bullish scenario remains valid with the probability of continuation toward $600+.
Outlook:
Short-term: Possible minor retracement to $330–350 before resuming the uptrend.
Medium- to Long-term: Bullish trend continuation toward $608–650.
Risk: A breakdown below $300 would weaken the bullish case, and a fall under $200 would invalidate it completely.
📌 Summary:
Tesla shows a strong bullish setup on the weekly chart. Entry zone is $300–330 with stop-loss at $200. The first major target is $608–650, offering an excellent risk–reward ratio for long-term investors.
Follow-through buying on TSLA?Following a one-sided 6.0% gain in Tesla’s share price on Thursday, this helped lift the S&P 500 and Nasdaq to fresh records. As shown in the chart below, the TSLA Stock rallied through a 6M resistance level of US$360.03 to a high of US$368.99, levels which have not been seen since earlier this year.
Further buying could now be seen for the Stock towards the resistance between US$389.72 and US$383.09. However, before reaching said area, a pullback may occur, retesting US$360.03 as support, with a dip into 1M support from US$343.88 possible.
Written by the FP Markets Research Team

My levels to chase $TSLA bull momentumInvestors are optimistic about potential Fed rate cuts and Tesla’s push into robotics and autonomous driving.
Tesla received a permit to begin testing autonomous vehicles on public roads in Nevada. This follows its limited robotaxi rollout in Austin and signals broader ambitions for nationwide autonomous ride-hailing services.
Elon Musk claims that “80% of Tesla’s value will be Optimus,” referring to its humanoid robot initiative. With EV growth slowing, Musk is pivoting Tesla’s narrative toward AI and robotics.
There are equal numbers of Tesla haters and lovers!
