TL0 trade ideas

$TSLA with three falling peaksNASDAQ:TSLA with three falling peaks and bearish “h” pattern while market is topping? No thanks

TSLA charted for 13Mar24TSLA looks like a solid move to the upside going into tomorrow. Keep in mind, TSLA has been getting wrecked for some time now. However, there is a ton of empty space up top and it only takes an ounce of good news for some tickers to move. We'll see if we can get an open above the top of the CB (cost basis) we're currently hanging around which is the bottom of an even bigger box.

TSLA: Short term target 186Thesis: TSLA sweeps the relative equal lows + Daily sell side liquidity at 173 and bounces off the Daily FVG at 172. Targeting 186 for a gap fill on the Daily chart.
Longer term still uncertain as 152 is a possible area if TSLA remains bearish

$TSLA LONG TERM $300 EOY 2024- Don't PANIC and BUY now!Long-term forecasts for Tesla's stock value in 2025 show analyst expectations ranging from just $550 per share to $1,100. These forecasts reflect a variety of factors, including Tesla's market performance, EBITDA margins and the expansion of the electric vehicle market.
If the NASDAQ:TSLA goes back into the uptrend line, Tesla's price will reach $291.73 by the end of 2024, reflecting continued investor confidence and market growth.
-The charts have been warning that the downward momentum may have already bottomed as of 03/12/2024.
-Developing profitable income sources through software and artificial intelligence features for its autonomous vehicles, which are unfortunately overshadowed by the underperformance in electric vehicle sales.
-By 2026, the Advanced Clean Cars II rule of the state mandates that zero-emission vehicles must account for 35% of new cars and light trucks in lots. This percentage is set to increase to 68% by 2030, ultimately reaching 100% by 2035.
NASDAQ:TSLA is still Tesla!

$TSLA back to $206 Price is at bottom trendline support of the broadening formation, taking out the lows prior, while RSI displays bullish divergence. If we can get over $178.79 tomorrow, price should see $182.87 taking out yesterday's high, as it took out lows today.

DOUBLE BOTTOM $TSLA GOING BACK TO $200A double bottom pattern is a well-known charting formation in technical analysis that signifies a significant shift in trend and a reversal of momentum from a previous downward movement in market trading
- Great Buying Opportunity!!!! The attempt will be made to reach $250 rather than proceeding to $150.
- The range of $176 is being securely maintained.
- Oversold (14): 33.80 as of 03/07/2024. We are in March 2023 price. NASDAQ:TSLA
- AMEX:ARKK purchased 61,073 shares, AMEX:ARKQ bought 5.684 TSLA shares, and AMEX:ARKW purchased 13,199 shares on 03/6/2024
- Tesla China is posting more job openings to increase its delivery team and staff in several fields

$TSLA Bottom, 177 or $144?If TSLA doesn't turn here,
Be prepared for a wicked turn at $144
I plan on buying calls very heavy once we get to $144. If we get to $144

TSLA - Are you Ready for the Ride?🚘Hello TradingView Family / Fellow Traders. This is Richard, also known as theSignalyst.
📈 TSLA has been overall bearish , trading within the falling channel in blue.
However, TSLA is currently approaching the lower bound of the channel acting as a non-horizontal support.
Moreover , it is retesting a strong demand zone at 150 - 165 marked in green.
🏹 Thus, the highlighted blue circle is a strong area to look for buy setups as it is the intersection of the green demand and lower blue trendline.
📚 As per my trading style:
As #TSLA is around the blue circle zone, I will be looking for bullish reversal setups (like a double bottom pattern, trendline break , and so on...)
📚 Always follow your trading plan regarding entry, risk management, and trade management.
Good luck!
All Strategies Are Good; If Managed Properly!
~Rich

TSLA charted for 12Mar TSLA made THE MOVE I was looking for it to make today but I didn't catch it since I was looking at other tickers. It will be one of the top tickers I'm paying attention to though, going into tomorrow. If we gap down to the top of the PotterBox we're currently below, I will go long again.

TESLA GREAT BUYING OPPURTUNITY!!!!!!!!Are the markets on fire who is skeptical about TESLA? CYBERTRUCK coming out soon!

long ideaAs it shows the stock starts to go up after finishing his correction wave and we have here a reversal H&SH pattern with a minimum target at 210 so
you can buy at 200
TP 1 : 210
TP 2 :220
TP 3 : 230
SL > 189

TSLA Approach with Caution Several major tech names are starting to show me confluence and trend patterns that may be signalling a bearish outlook going into the start of 2024.
Firstly, our Fibonacci levels are proving the golden pocket at the 0.618 to be a resistance zone several times for Tesla. We are seeing a push back towards this zone with the formation of a bearish wedge that is more likely to break to the down side than the upside.
Additionally, Tesla vehicles are becoming increasingly more affordable as they continue to slash prices on newer vehicles which may have a negative impact on the overall bottom line for Tesla.
The current yield curve is at the worst level in 40 years, which has historically been a strong indicator for the recession to begin with 12-18 months. We will be approaching that time frame towards the later part of the year which may have a drastic effect on risk assets.

Top of range for TSLAI would be short term short here, price action wise, but im a long term bull on this stock due to its potential to dominate market share in the next decade. santa rally could blow through all of this here though, i just need to update the look of my chart idea

Time for $TSLA to shine?From my point of view, NASDAQ:TSLA is at the bottom of both Horizontal and Channel support levels.
Might be a good time to buy some.
Targets:
🔴 SL $165
🟢 Initials out at $189.8568
🟢 TP (tbd)

TSLA bearish outlookIf you follow me then you know that we played the GAP fill on NASDAQ:TSLA with success and now we look to change our view and go bearish. Some have sized this up as a Bear Flag but i see a rising wedge formation that has broken down and we look to short $TSLA. I have given it room to move with such a massive move down but we should see continued weakness and a break of the recent bottom.
TSLAIt is completing wave c of X. After completing the corrective wave, I expect the price to increase.

TSLA looking like it may bounce this weekTSLA has a bit more room to leg down. But it is at the bottom of a daily trend channel, which could signal a bounce. However, Elon has been getting punched in the mouth lately so who knows how much further this could tick down. Entry to the upside is annotated in the video.

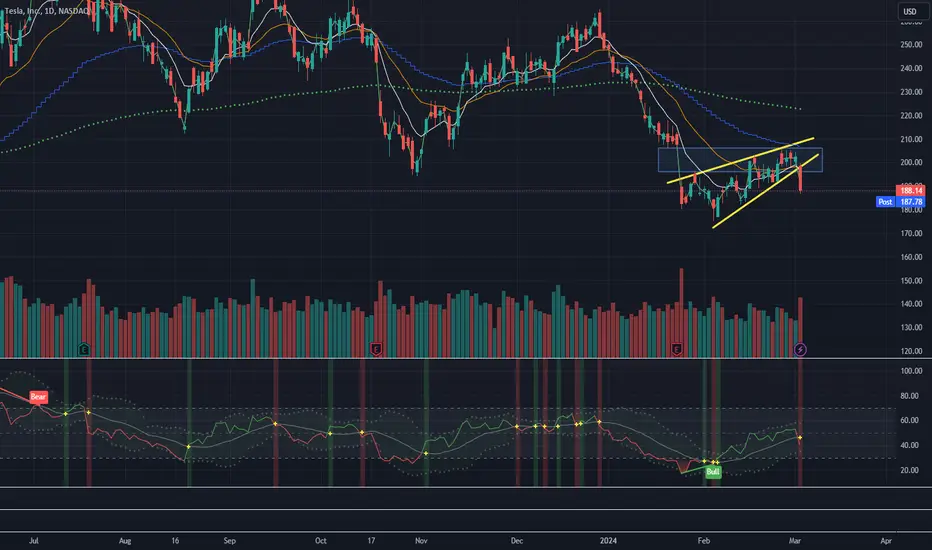
Tesla investment updateOkay so when we have a look at the chart we can see that the price has been dropping for some time now.
At this moment we are in a zone that could be interesting for us to trade/add to our long term investment.
That zone is the block we see in yellow. This zone was resistance in the past and could be going to be support this time. We do have to wait and see what the price does when we are at this zone and see what the volume will do.
If we do see a break below that level we could be going to the other yellow block below the first one but that is something we need to see and wait for.
We also see that we have a descending wedge. This is not a good sign that because for some good movement to the top we need to break that wedge aswel. And we can see in the past that it already did have some trouble with breaking this zone.
We also see on the chart that we have a ascending wedge that was valid already. We have a break of the wedge and then we saw a retest of that wedge and then we went all the way down. This is the price and zone that we are in now.
So if we want to keep this stock we need to see a break of the ascending wedge and a break of the descending wedge and a respect of the yellow zone.
So we have 3 things that we need to see before we can see a big pump again.
We also do have to mention that this is just only a technical analysis and that with companies like this we also need to have a look for the fundamental data and we need to see what the price is going to do when we have earnings reports.

TESLA: Long Trade Explained
TESLA
- Classic bullish setup
- Our team expects bullish continuation
SUGGESTED TRADE:
Swing Trade
Long TESLA
Entry Point - 175.34
Stop Loss - 168.70
Take Profit - 191.02
Our Risk - 1%
Start protection of your profits from lower levels
❤️ Please, support our work with like & comment! ❤️

TSLA WEEKLY CHART Question, Do buyers come in at his level? I personally don't know if they will but this will be something I'm watching this week.

Tesla My view on Tesla on the weekly time frame, it my retest the fibs levels at the FVG or it can still drop towards the imbalance

TSLA shortTSLA is overvalued compared to other car companies
short term bearish, with RSI trending below 50 and price drop and a swing low on the weekly. would touch this stock for another year or so I think
