Tesla Long to 225H&S NASDAQ:TSLA long to 225
Head and shoulder pattern indicates possible range up to 225-235 over 35 days approximately.
TL0 trade ideas

Tsla Long Term Levels!Hello Dear Traders..
Chart is too busy in short...
iam with longing Tsla from here..
Near Support 190
consider your Pivot point 204.96
Targeting 228
CLosing above 228 will signal more levels up
Crosess X X X usually reverse the Candle/wave before it.
Jinny Gann R Was used to create this chart..

TESLA: Extension of gain for the next week but be careful....For the next week we can expect at least another day to the upside as well as till 27.02 at most.
Be aware that we are at 35 days out of 44 of a monthly cycle.
After Monday 19.02 bear in mind that there can be a considerable retracement to allow the begin of a T+2i.
Enjoy the analysis!

Tesla at $200 and 200 EMATesla 100x have been important levels. If it crosses $200 (unless its a bull trap) we could see 300. For long term bulls a good entry point

Tesla is on course to short-term upsideTesla is on the course to form the sub-b wave of the Y-leg of the larger degree WXY wave. Volume shows steady increase in buying pressure.

TESLA Stock Chart Fibonacci Analysis 022624Trading Idea
1) Find a FIBO slingshot
2) Check FIBO 61.80% level
3) Entry Point > 199/61.80%
Chart time frame : B
A) 15 min(1W-3M)
B) 1 hr(3M-6M)
C) 4 hr(6M-1year)
D) 1 day(1-3years)
Stock progress : A
A) Keep rising over 61.80% resistance
B) 61.80% resistance
C) Hit the bottom
D) Hit the top
Stocks rise as they rise from support and fall from resistance. Our goal is to find a low support point and enter. It can be referred to as buying at the pullback point. The pullback point can be found with a Fibonacci extension of 61.80%. This is a step to find entry level. 1) Find a triangle (Fibonacci Speed Fan Line) that connects the high (resistance) and low (support) points of the stock in progress, where it is continuously expressed as a Slingshot, 2) and create a Fibonacci extension level for the first rising wave from the start point of slingshot pattern.
When the current price goes over 61.80% level , that can be a good entry point, especially if the SMA 100 and 200 curves are gathered together at 61.80%, it is a very good entry point.
As a great help, tradingview provide these Fibonacci speed fan lines and extension levels with ease. So if you use the Fibonacci fan line, the extension level, and the SMA 100/200 curve well, you can find an entry point for the stock market. At least you have to enter at this low point to avoid trading failure, and if you are skilled at entering this low point, with fibonacci6180 technique, your reading skill to chart will be greatly improved.
If you want to do day trading, please set the time frame to 5 minutes or 15 minutes, and you will see many of the low point of rising stocks.
If want to prefer long term range trading, you can set the time frame to 1 hr or 1 day.

TSLA still a BUY++++As I stated in my last posts TSLA was short term overbought and would test $190-195 again before breaching the $200 resistance. We should break through and it will become new short term support. First stop is $212 then $220 second target

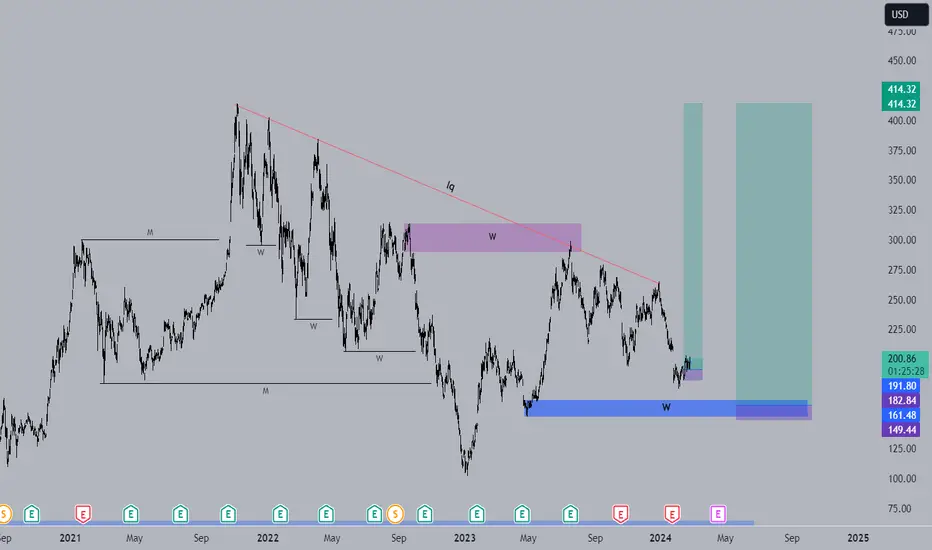
Long Term Idea for TeslaThis is an analysis for long-term investors interested in Tesla stock. Several analysts, employing the Elliott Wave Theory, have identified the range between $190 and $152 as the target zone for a potential sell-off. The sell-off occurred after weak quarterly earnings. Currently, Tesla appears to be stabilizing in the range between $190 and $180. This presents a good opportunity for a long-term entry with a target just below $300.
The idea offers a good risk-reward ratio of 2.5:1.

TSLA Investment biasI've been monitoring Tesla's decline in price over the past 2 months, but the current technical location could give evidence towards continuation within its descending channel.
An impulse move could provide the necessary bullish momentum to provide a breakout.
Are you a Tesla bull or bear?

Tesla - Go Long NowHello Traders, welcome to today's analysis of Tesla.
--------
Explanation of my video analysis:
After the massive triangle breakout in 2020 and a rally of +1.500%, Tesla has been moving sideways for over two years now. Tesla stock is currently creating a triangle formation as well as a flag pattern. I am personally waiting for a clearer setup on Tesla before I will take longs - either a triangle breakout or a retest of the lower support of the flag mentioned in the analysis.
--------
I will only take a trade if all the rules of my strategy are satisfied.
Let me know in the comment section below if you have any questions.
Keep your long term vision.


can TSLA crash alreadyI missed on 2008 crash, on Covid crash, now there's a new crash on the way supposedly and idc about not putting your eggs in one basket, my basket is gone be full of tsla puts because i feel like besides NVDIA, TSLA is a gem and i want all i can get because it will change my life anyway, this week i want my 5%, i swing and forget until i either hit my stop loss or reach my target. If TSLA dont bounce of 189 i dont see why not stop at 180 area. i will change bias at 198 area. Idk why i am sharing this but i keep buying June contracts solely because i feel like if market gone crash, it will be probably be before summer so I buy and hold leaps every time TSLA get under $196-193 and enjoy the ride whenever it makes a new low so ideally i want to sell all contracts at 166-150 and go enjoy my life and my long target is 233 but right now im am bearish on TSLA idk why but i want to listen to my intuition and based on the chart, i don't see nothing bullish

Tesla triple bottom.Resistance is very important.All eyes on Tesla stock.Tesla stock entered a very strong upward support zone.

TSLA moves yield volatility and trader profit LONGTSLA is shown here on a 15 minute chart with a set of anchored VWAP bands. A relative volume
indicator shows spiking volumes each and every morning and fades as the trading session wears
on. Overall, TSLA trends between the upper and higher VWAP bands and their counterparts
below the mean VWAP. Like most other stocks, TSLA has periods of ranging and other periods
where it trends. Day traders can capture intraday volatility while swing traders can sometimes
get a 10% move over 2-3 days. In the past month TSLA moved 5% up overall. However, in that
move price fluctuated widely which has been exploited by traders. The high trading volumes
keep spreads very low while the volatility makes options trading very challenging. Que sera,
sera.


Tesla Analysis: Testing Key Resistance and ScenariosTesla is testing a crucial resistance level, creating anticipation. A failed third attempt may result in a pullback towards the buying zone. Breaking the resistance, with a daily candle closing, could target Kaufman Moving Average levels, especially around 213.
WARNING: THIS ANALYSIS IS NOT INVESTMENT ADVICE. CONSIDER YOUR RISK TOLERANCE AND FINANCIAL SITUATION BEFORE MAKING DECISIONS. FUTURE PERFORMANCE IS NOT GUARANTEED; THIS IS MERELY AN OPINION. INVEST PRUDENTLY AND CONDUCT THOROUGH RESEARCH.

TSLA RARE INSIDE WEEK BREAKOUT WATCHMy PLAN
CALLS ABOVE 197.82
PUTS BELOW 185.66
DROP A LIKE and LETS DO THIS!
INSIDE WEEK looking for a massive breakout WITH FIBONACCI SUPPORT BELOW


Tesla to $65 ???????????No Tesla , really? Do you really wanna go down there?
Just my 2 cents. Not financial advice. But would be nice to buy at that level for the long term.

TSLA - Falling WedgeA nice reversal pattern with a confluence of bullish divergence is symbolizing Bullish Signs for TSLA.

Failed to move UPAfter getting pressured at 200 DMA on the 1H chart, Tesla rejected 2 times but closed above the 200 DMA line the first time in 2024 but that lasted only 3 hours. Friday came and went back down, more importantly, it broke below the trendline that gave support during the last 2 weeks.
Now that support is broken and failed to form a higher high, it's logical to test the last support area 182.50.
Even with AI's bullish market, Tesla is struggling to go up, unless the Board introduces a new package for Elon or the first-ever stock buyback program it is getting hard to move up.

$TSLATSLA Long! buy near 0.618 ($177) fib retracement. Target 1 at 0.786 fib ($347) target 2 at 1.618 ($607)
