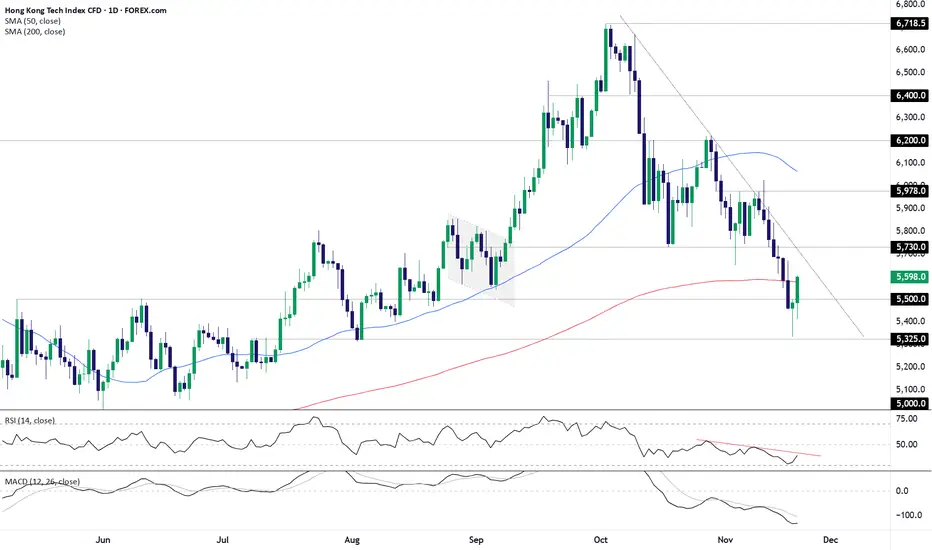
Hang Seng Tech eyes breakout as Alibaba takes the stage
Is the rout in Hang Seng Tech coming to an end? That’s the question traders should be pondering today following the rapid rebound of recent days, seeing the index recover from multi-month lows to trade above the important 200-day simple moving average. It will be important on Tuesday, providing a l
Related indices
Hang Seng Tech: Bulls and bears face off at key supportThe downside we were looking for in Hang Seng Tech has played out quickly, with the trade hitting its initial target in less than three days. Price is now sitting at a known support level, creating the opportunity to assess both bullish and bearish setups depending on how it closes the session.
If
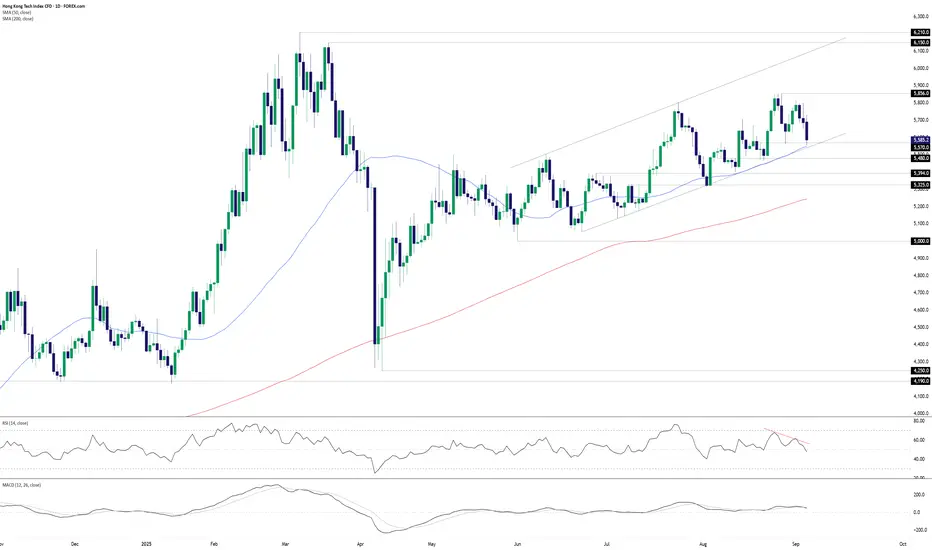
Hang Seng Tech: 5800 proves trickyHang Seng Tech continues to struggle above 5800, reversing lower after another failed probe above the level on Monday, mirroring price action seen earlier this year. While the broader trend is undeniably bullish, without a definitive break and close above 5856, near-term directional risks may be low
Hang Seng Tech Golden Pocket ResistancePotential 4 Bar Pattern setting up if unable to break 5000 today
Golden Pocket is Resistance as well as psych price Point.

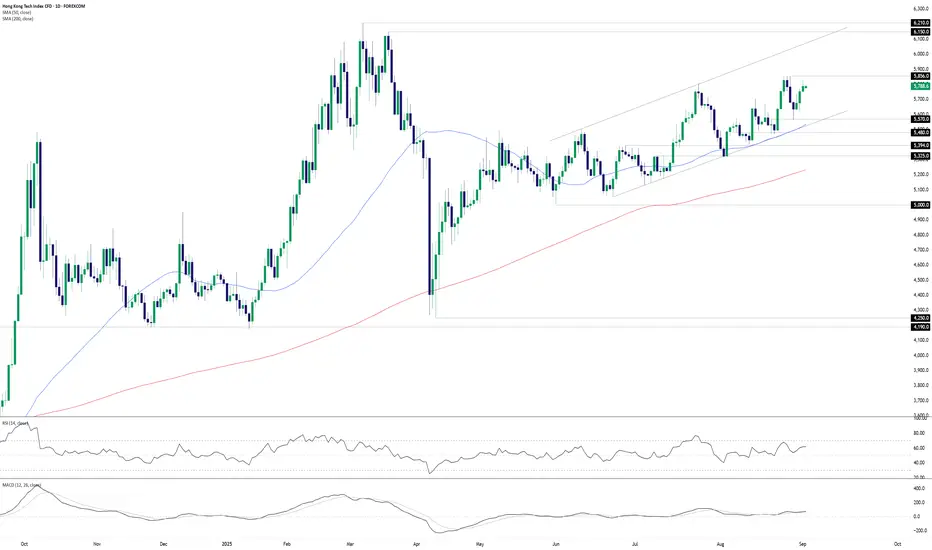
Hang Seng tech index breaks down Trend.Short term price action has formed higher highs and higher lows resulting in a breakout of the longer term downward channel,
This has been driven by recent gains off the lows of large cap stocks like Alibaba and JD. Com amongst others, may be beneficiaries if the index continues North.
Recent data o

Hang Seng Tech Monthly TradeHI Guys, To me it looks like on monthly timeframe Hang Seng tech is bottomed up, as you can clearly see on this chart there is a clear bullish divergence on a montlhy timeframe as well as alot of index constituents are also showing bottoming formations
Script Stock Name Percentage
KYG0171911

HSTECH low risk opportunityI will be going long on HSTECH. It has moved from 61.8% retracement with positive RSI divergence and closing marginally above 20 DMA and major resistance above 3750 area. More confirmation if closing above falling trendline. Will add above that.
Target will be swing high around 4300 and then 4800.

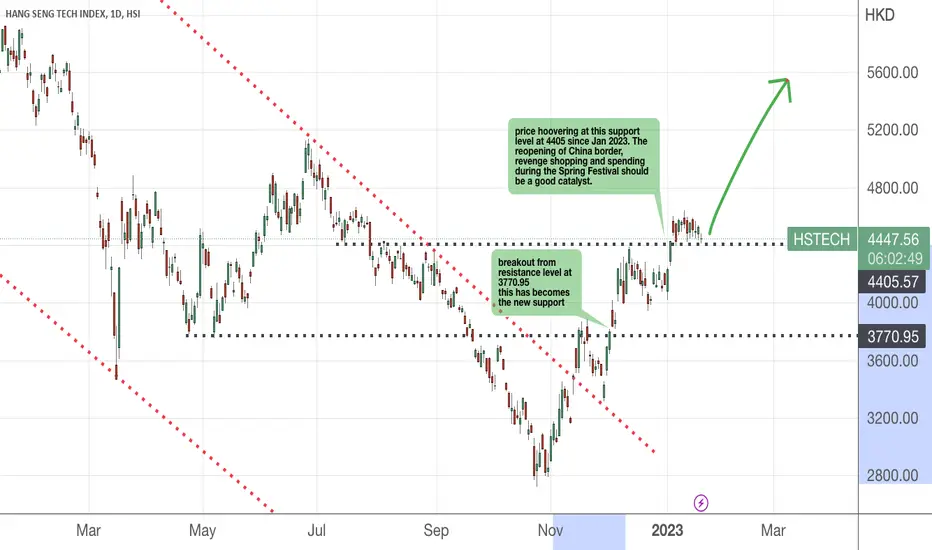
China Tech. Don't miss thisHang Seng Tech
Price broke out from a long-term down-sloping channel (since 2021).
the recent price advance since Oct 2022 shows a 5-wave impulsive move.
Therefore I believe the bottom is over.

3 days to Chinese New Year 2023!!!First thing first, I would like to take this opportunity to many of my followers who stayed by me all these years. You have given me the encouragement to continue writing my point of view over the last 5 years. Wow!!!
Looking back, it has been a roller coaster learning curve for me as well. For th
Bottom fishing HSTECHIt is tough to determine the bottom for this ETF as it lacks historical trend to back up. Using the heaviest weightage component of this ETF to benchmark , Tencent appears to have reach a double bottom.
Of course, we won't know how long this bottoming process will last, weeks, months or years.....

See all ideas
Summarizing what the indicators are suggesting.
Oscillators
Neutral
SellBuy
Strong sellStrong buy
Strong sellSellNeutralBuyStrong buy
Oscillators
Neutral
SellBuy
Strong sellStrong buy
Strong sellSellNeutralBuyStrong buy
Summary
Neutral
SellBuy
Strong sellStrong buy
Strong sellSellNeutralBuyStrong buy
Summary
Neutral
SellBuy
Strong sellStrong buy
Strong sellSellNeutralBuyStrong buy
Summary
Neutral
SellBuy
Strong sellStrong buy
Strong sellSellNeutralBuyStrong buy
Moving Averages
Neutral
SellBuy
Strong sellStrong buy
Strong sellSellNeutralBuyStrong buy
Moving Averages
Neutral
SellBuy
Strong sellStrong buy
Strong sellSellNeutralBuyStrong buy
Displays a symbol's price movements over previous years to identify recurring trends.