A Case Study : NaturalGas Probable price projectionMarket Participants play the role of
1. price discovery
2. shift in the trends and change of cycles
3. Value rotation among different asset classes
Market players like Yearly, Halfyearly, Quarterly, Monthly, weekly, Daily, Hourly, and Intraday participants who trade during certain time ranges.
Apart form these certain market makers who has ability to shift the entire market cycle. who participate during very crucial times.
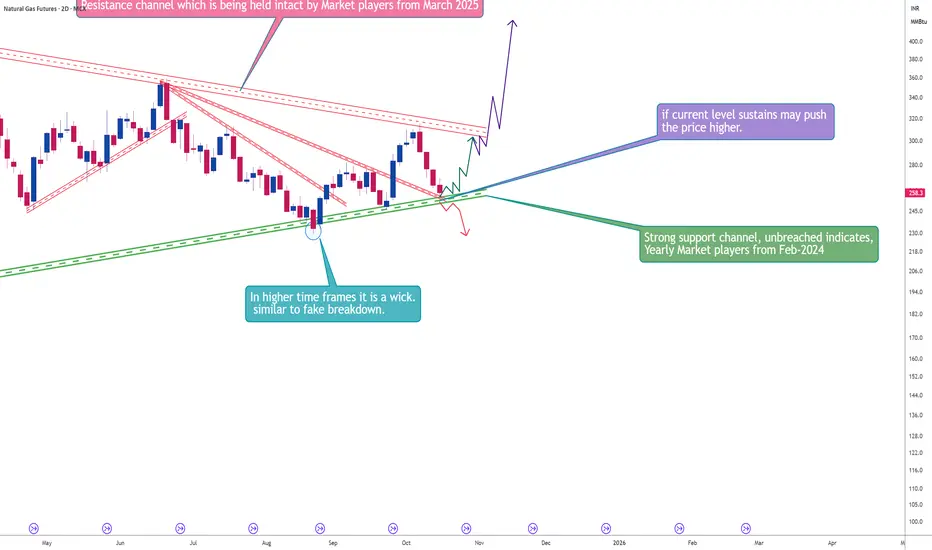
Coming to Natural gas Price movement
Case 1 :
it is very clear form the chart that a resistance channel which is held from march 2025 of this financial year ( Indicates presence of (may be Yearly), quarterly, halfyerly, or may be some other lower level weekly and daily participants).
to explain this 2day chart is considered where we can see a continuous 8 trading sessions of red candles appeared.
now if continues further for next couple of trading sessions it not a good sign for naturalgas.
Case 2 :
A strong green support channel is being held intact from feb-2024 which indicates presence of Mainly Yearly participants
if this channel is held intact around 260 levels for couple of days may push the price to much higher levels.
Looks like its a tight fight between different players. if green channel is respected then price moves to higher levels, else it goes down eventually. lets see which players are going to win.
Trade ideas
NATGAS CORRECTION AHEAD|SHORT|
✅NATGAS after rallying into a high-timeframe supply level, price shows signs of exhaustion and potential mitigation before retracement. Liquidity sits below the recent swing lows. Time Frame 5H.
SHORT🔥
✅Like and subscribe to never miss a new idea!✅

NG1!: Local Bearish Bias! Short!
My dear friends,
Today we will analyse NG1! together☺️
The market is at an inflection zone and price has now reached an area around 4.121 where previous reversals or breakouts have occurred.And a price reaction that we are seeing on multiple timeframes here could signal the next move down so we can enter on confirmation, and target the next key level of 4.051.Stop-loss is recommended beyond the inflection zone.
❤️Sending you lots of Love and Hugs❤️

Gold | Oil | Dollar | Silver | Natural Gas Price ForecastGold | Oil | Dollar | Silver | Natural Gas Price Forecast
NYMEX:NG1! COMEX:GC1! COMEX:SI1! AMEX:UNG

GASNatural Gas
- Double Top as an corrective pattern in Long Time Frame
- Change of Characteristics
- RSI - Divergence
- Resistance Level
- Symmetrical Triangle in Short Time Frame

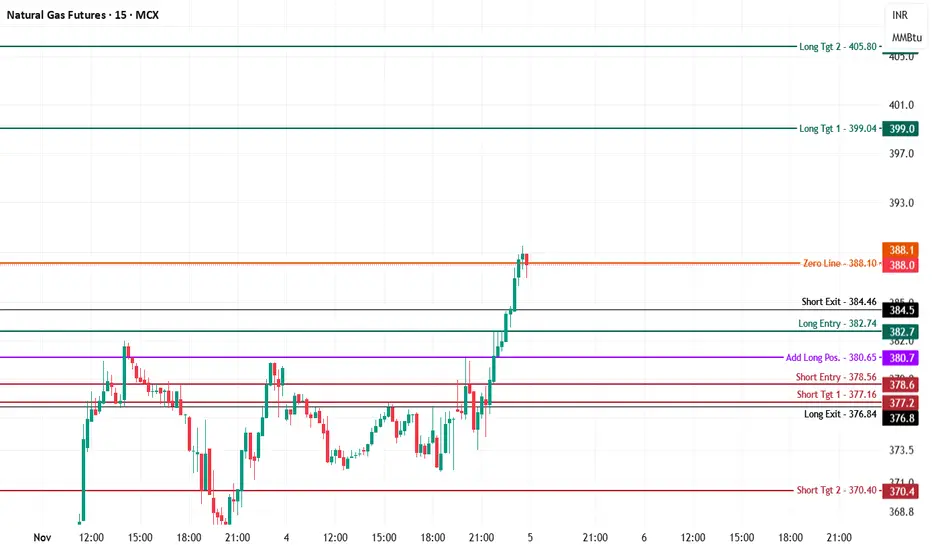
Natural Gas - Intraday Technical Analysis for 5th Nov., 25MCX:NATURALGAS1!
MCX Natural Gas Futures — Chart Pathik Insights | 5-Nov-25
Natural Gas launches into the new session trading at 388.0, now attempting to secure higher ground after a powerful upside rally that pushed price through multiple resistance clusters before meeting supply near the zero line (388.1). Volatility remains primed with the day's breakout highs being tested for strength.
Bullish Structure:
Long bias is active above 382.74, with conviction growing so long as price maintains above the zero line and confirms new footholds in higher levels.
Upside Levels:
399.0: Immediate resistance for booking or fast trades after a continuation move.
405.8: Ambitious stretch target for the most aggressive bulls.
Risk Management: Longs should now be protected by trailing stops near the add-long (380.7) or immediately beneath new swing structures if volatility resumes.
Bearish Structure:
Short opportunities emerge only if price slips below 378.56, reversing the intraday momentum and reclaiming lost support.
Downside Targets:
377.16: First target for counter-trend scalps or defensive shorts.
370.4: Full retracement extension for sustained bear attacks.
Risk Management: Shorts to be covered or reduced if price bounces strongly back above recent swing highs or reclaims 382.74.
Neutral/Turn Risk:
The 388.1 zero line is today's battleground. Expect hesitation and possible chop near this band—position sizing and patience are warranted while price digests the rally.
Use these levels to stay mapped for intraday clarity, balanced risk, and emotionless execution. If Chart Pathik analysis powers your trading edge, boost, comment, and share—community support keeps upgrades coming.
Follow for adaptive logic, battle-tested pivots, and resilient strategy focus in every market scenario.
Gold | Oil | Dollar | Silver | Natural Gas Price ForecastGold | Oil | Dollar | Silver | Natural Gas Price Forecast
AMEX:BOIL AMEX:KOLD NYMEX:CL1! COMEX:GC1!

NG1!: Next Move Is Up! Long!
My dear friends,
Today we will analyse NG1! together☺️
The market is at an inflection zone and price has now reached an area around 3.348 where previous reversals or breakouts have occurred.And a price reaction that we are seeing on multiple timeframes here could signal the next move up so we can enter on confirmation, and target the next key level of 3.408.Stop-loss is recommended beyond the inflection zone.
❤️Sending you lots of Love and Hugs❤️
NATGAS: Short Trade Explained
NATGAS
- Classic bearish formation
- Our team expects pullback
SUGGESTED TRADE:
Swing Trade
Short NATGAS
Entry - 3.337
Sl - 3.372
Tp - 3.272
Our Risk - 1%
Start protection of your profits from lower levels
Disclosure: I am part of Trade Nation's Influencer program and receive a monthly fee for using their TradingView charts in my analysis.
❤️ Please, support our work with like & comment! ❤️

Natural Gas MCX Future - Intraday Analysis - 24th Oct., 25$MCX:NATGAS — Chart Pathik Insights | 24-Oct-25
Natural Gas is trading at 295.7 after a volatile session, testing the lower end of its range just beneath the zero line at 296.7. Market participants are reacting to failed retests near the add-long and short-entry zones, indicating a pivot towards range expansion or a deeper leg down if the pressure continues.
Bearish Setup:
Short bias remains valid below 299.57, especially if price fails to reclaim the 301.20 add-long zone and loses momentum at intermediate pivots.
Downside Levels:
288.17: First support for quick profit-taking or scalp covers.
282.90: Full extension if the market unwinds further.
Risk Control: Shorts are best managed below 298.23; cover positions if swift reversals target 301.20 or above.
Bullish Setup:
Long ideas come into play above 302.83, especially with strong closes above 304.17 and sustained movement through the upper resistance targets.
Upside Levels:
305.23: First resistance and logical booking level.
310.50: Major extension if bullish momentum accelerates.
Risk Control: Long positions should be protected using 301.20 or 299.57 as tactical stops based on entry and volatility.
Neutral Range Logic:
The 296.7 zero line acts as the key session balance point—sideways price action is likely while traders jockey for a fresh directional break.
Use these mapped zones for disciplined intraday trading, smart entries, and adaptive exits.
If this approach empowers your analysis, boost, comment, and share—your feedback energizes the Chart Pathik community.
Follow for persistent, practical insights and consistently logical trading plans.

NaturalGas Probable price movement
1. price is taking support at parallel.
2. if price sustains here may reach higher levels

NATGAS Will Keep Growing! Buy!
Hello,Traders!
NATGAS Price has broken out above the horizontal demand area with strong momentum, confirming bullish order flow. A clean displacement shows potential continuation toward the 4.50$ target zone. Time Frame 5H.
Buy!
Comment and subscribe to help us grow!
Check out other forecasts below too!
Disclosure: I am part of Trade Nation's Influencer program and receive a monthly fee for using their TradingView charts in my analysis.

NATGAS - LONG LONG TERM targetNATGAS - LONG LONG TERM target
This is my evaluation about NatGas for the next week with a long term vision for this winter.
So I think we are in final 5° wave and probably we can break resistence area in 4$ zone

Long Term - Long. Henry Hub Natural Gas (NG1) 1W"With the macro bias bullish and the current momentum confirmed by the block test at 3.0, a 'Long-Term Long' scenario is highly likely.
I expect any pullbacks to be corrective.
Then the next logical 'magnet' for price is the Liquidity Withdrawal (BSL) at the local high around ~4.90. If this level is broken, it opens the way to testing the next supply zones and ultimately to ATX."
This is not investment advice!!! Keep your risks low!!! Happy trading!

NATGAS Short From Supply Area! Sell!
b]Hello,Traders!
NATGAS is approaching a major horizontal supply area, where strong selling pressure may reappear. A rejection from this zone could trigger a short-term correction toward lower liquidity pools. Time Frame 5H.
Sell!
Comment and subscribe to help us grow!
Check out other forecasts below too!
Disclosure: I am part of Trade Nation's Influencer program and receive a monthly fee for using their TradingView charts in my analysis.

Gold | Oil | Dollar | Natural Gas | Silver Price ForecastGold | Oil | Dollar | Natural Gas | Silver Price Forecast
NYMEX:NG1! NYMEX:CL1! COMEX:SI1! COMEX:GC1!

NATGAS: Short Trading Opportunity
NATGAS
- Classic bearish formation
- Our team expects pullback
SUGGESTED TRADE:
Swing Trade
Short NATGAS
Entry - 3.000
Sl - 3.027
Tp - 2.949
Our Risk - 1%
Start protection of your profits from lower levels
Disclosure: I am part of Trade Nation's Influencer program and receive a monthly fee for using their TradingView charts in my analysis.
❤️ Please, support our work with like & comment! ❤️

NG1!: Will Go Up! Long!
My dear friends,
Today we will analyse NG1! together☺️
The market is at an inflection zone and price has now reached an area around 3.022 where previous reversals or breakouts have occurred.And a price reaction that we are seeing on multiple timeframes here could signal the next move up so we can enter on confirmation, and target the next key level of 3.062.Stop-loss is recommended beyond the inflection zone.
❤️Sending you lots of Love and Hugs❤️

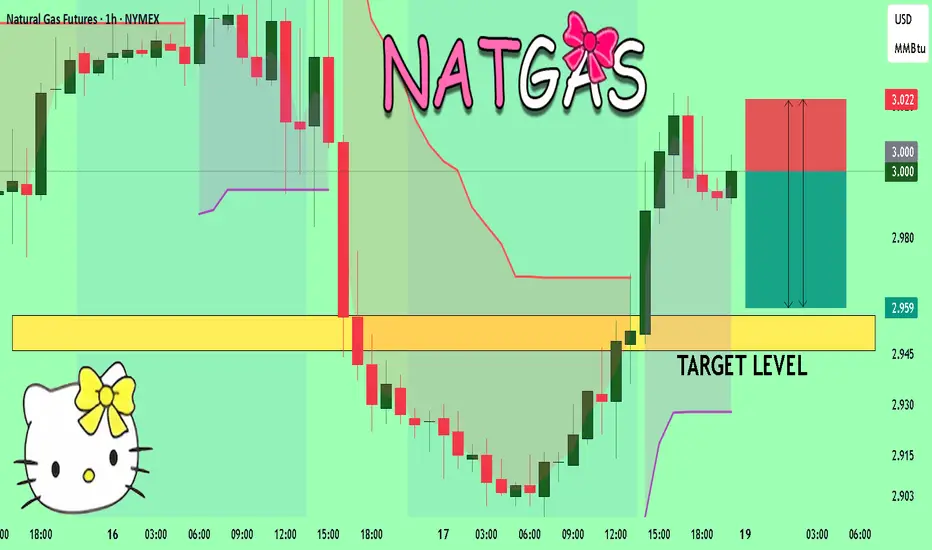
NATGAS Technical Analysis! SELL!
My dear subscribers,
This is my opinion on the NATGAS next move:
The instrument tests an important psychological level 3.000
Bias - Bearish
Technical Indicators: Supper Trend gives a precise Bearish signal, while Pivot Point HL predicts price changes and potential reversals in the market.
Target -2.957
My Stop Loss - 3.022
About Used Indicators:
On the subsequent day, trading above the pivot point is thought to indicate ongoing bullish sentiment, while trading below the pivot point indicates bearish sentiment.
Disclosure: I am part of Trade Nation's Influencer program and receive a monthly fee for using their TradingView charts in my analysis.
———————————
WISH YOU ALL LUCK
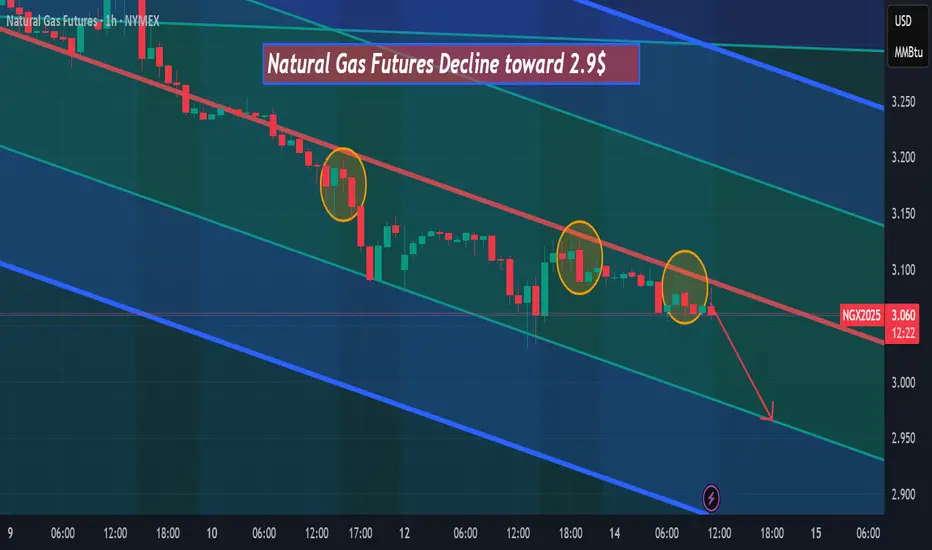
Natural gas futures are declining toward $2.90 Natural gas futures are declining toward $2.90 after three pullbacks on the bearish red trendline, according to my analysis on the 1-hour timeframe.
Sellers continue to dominate after the recent failure to hold above the bearish red trendline, increasing the probability of a move toward the $2.90 support zone
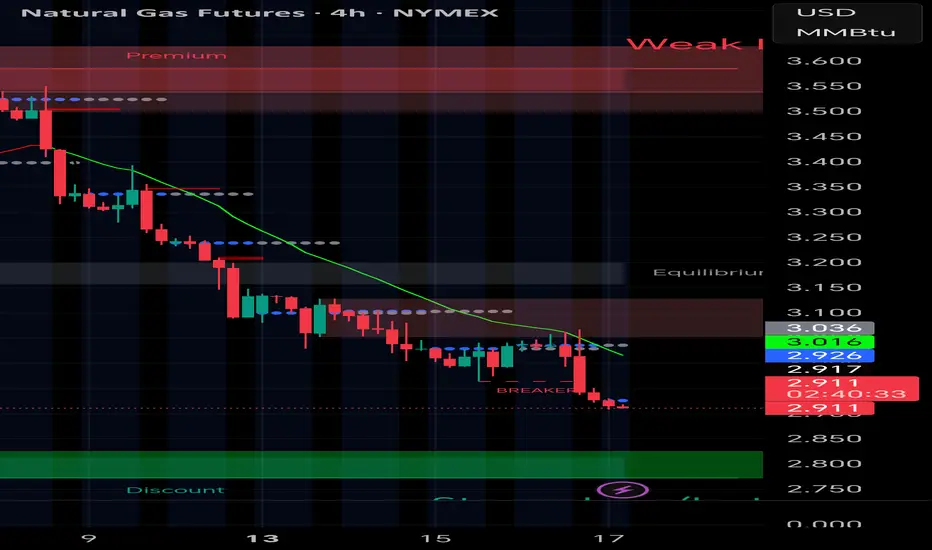
NATGAS (NYMEX): Entering Strong buy Zone – Upside Potential! 💰 Current Price: 2.912
📉 Accumulation Zone: 2.800 – 2.900
Natural Gas has entered a deep accumulation phase after a long consolidation.
The lower band at 2.800 makes it a high-probability buy zone for traders eyeing the next leg up.
---
🎯 Upside Targets
⚡ 3.200 → First resistance
🚀 3.400 – 3.500 → Short-term zone
🌕 4.000+ → Positional extension target
---
🧭 Trading Plan
✅ Buy Zone: 2.800 – 2.900
⛔ Stoploss: Below 2.760 (daily close)
🎯 Targets: 3.200 / 3.400 / 3.500 / 4.000
📈 Bias: Bullish (short–medium term)
🌍 Market View
While Gold and Bitcoin are stuck in indecisive structures,
Natural Gas is quietly building strength within a clear range.
The chart reflects smart money accumulation — hinting at a potential volume-led breakout in the coming sessions.
⚠️ Disclaimer
This post is for educational purposes only and not financial advice.
Always manage your risk and trade with proper position sizing.
#NATGAS #NaturalGas #Commodities #TradingView #NYMEX #SwingTrade #PriceAction #CommodityTrading #TechnicalAnalysis #AccumulationZone #EnergyMarkets #Heraxia
Naturalgas Probable price projection - pivot and trendlineCase 1:
If price takes support around 265-270 levels and sustains above pivot . Then price can move upside may be upto R1 .
Case 2:
If price sustaind below pivot and breaks the support may reach S1 .
