Us30 Bearish forminglets see if Us30 resists our recent low.. After all its thr third day US Goverment shutdown.
Trade ideas

Us30 Trade Set Up Oct 13 2025Overall price is still bearish but today i can see price sweeping SSL, touching 50% of the 1h Gap and targeting the 4h FVG before continuing its bearish trend

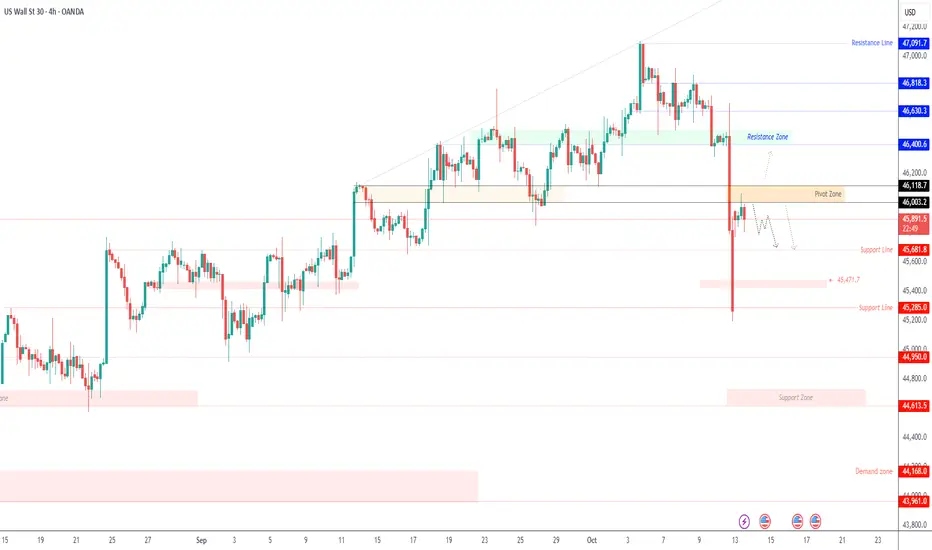
US30 - Futures Rebound as Trump Calms U.S.–China Trade TensionsUS30 – Overview | Futures Rise as Trump Softens Tone on China
U.S. stock index futures advanced Monday, recovering from Friday’s pullback, as investors shifted back to risk assets following President Donald Trump’s softer stance on China.
Trump signaled a more measured approach, easing concerns over trade escalation after previously announcing steep tariffs and export restrictions tied to rare earth controls.
Market sentiment improved modestly, though caution remains as investors await further clarity on policy direction and upcoming U.S. data.
Technical Outlook
The Dow Jones maintains a bearish bias while trading below the pivot zone at 46,000.
As long as the price holds under this level, momentum favors downside toward 45,680 → 45,470, with increased pressure if a 1H candle closes below 45,680.
A 1H close above 46,120 would shift sentiment to bullish, targeting 46,400 → 46,630, potentially confirming a short-term reversal.
Pivot Line: 45,920
Resistance: 46,120 · 46,400 · 46,630
Support: 45,680 · 45,500 · 45,285
Summary:
US30 remains bearish below 46,000, with a possible retest of key supports at 45,680–45,470.
A break above 46,120 would invalidate the bearish view and open the way for a recovery toward 46,400.
US 30 POETENTIAL BULLISH RUNAfter setting a strong low on Friday, Dow Jones Industrial Average is likely to correct close to the rejection thus cueing for long entries. be on the lookout for those buys at around 45300. Buy stops at the current weekly high.

There is initial projected support for Monday at 45362 and 45154This channel is not providing individualized trading or investment advice, nor is it a banking service, brokerage service, trading service, investment service or money management service

US30The Dow Jones (US30) has experienced a strong bearish move, breaking below recent consolidation levels. Currently, price is testing a key demand zone around 45,263 – 45,206, where a potential short-term reversal may occur if buyers step in.
Key Reversal Zones:
🔹 45,686.9 – Possible first reaction zone / intraday support.
🔹 46,178.6 – First bullish target if a rebound occurs.
🔹 46,769.8 – 46,996.3 – Major resistance / key reversal area to watch for rejection or continuation.
As long as the price holds above 45,200, we could see a relief rally toward the upper resistance zones. A breakdown below this level could open the way to deeper bearish continuation.
📈 Bias: Short-term bullish correction within a larger bearish structure.
🕓 Timeframe: 4H

Us30US30 have had a drop last week due to tariff news, if we don't open with the gap then we will push up otherwise further drop can happen.
Disclosure: We are part of Trade Nation's Influencer program and receive a monthly fee for using their TradingView charts in our analysis.

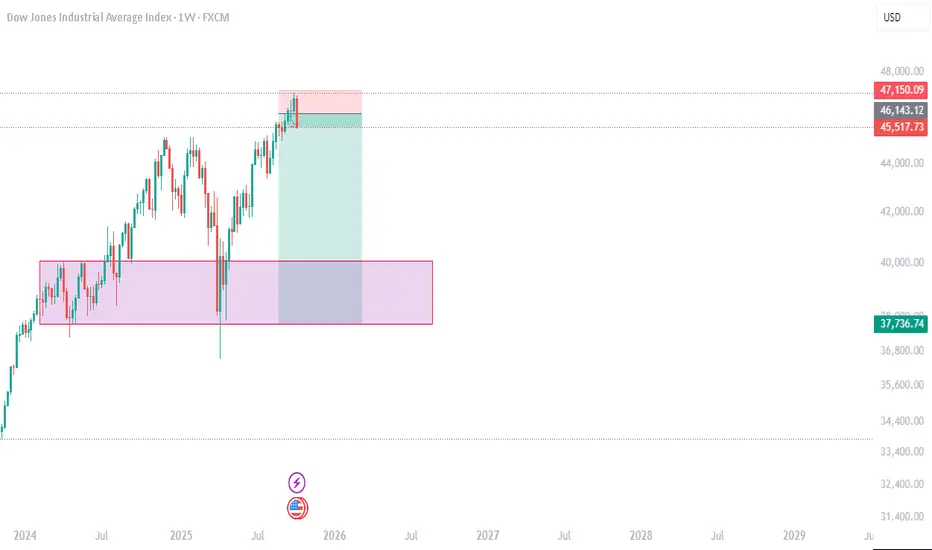
DOW JONES LONE WITH MOTHLY DEMNADDOW JONES – MTF Trade Setup (Long)
Trend Overview
All MTF & ITF aligned UP → Strong bullish structure.
Confluence Zones: Quarterly & Monthly demand.
Current Levels: Standing on Weekly & Daily MIPs.
Secondary Entry: Weekly MIP 42,711 (if price dips).
Key Levels
Timeframe Trend Demand Logic Avg / Key Level
HTF Avg (Yearly/Half/Qtr) UP Support 36,682
MTF Avg (Monthly/Weekly/Daily) UP DMIP / BUFL 42,580
ITF Avg (240M/180M/60M) UP DMIP / BUFL 109,230
Trade Plan
Parameter Value
Entry-1 44,500
Stop Loss (SL) 43,318
Target 54,000
Risk 1,182 (3%)
Reward 9,500 (21%)
Risk-Reward Ratio 8.04
Net RR 6.63
Capital & Profit
Parameter Value
Qty to Buy 1
Total Buy Value 44,500
Brokerage & Taxes 218
Net Profit (Target Hit) 9,282
Net Loss (Stop Hit) 1,400
Real ROI (4 Months) 21%
Gann Points
High (Uptrend) → 104,985
Low (Downtrend) → 93,395
Summary: Strong bullish trend across all timeframes. Key entry at 44,500 with secondary support at 42,711. Risk-Reward favorable; target achievable in ~4 months.

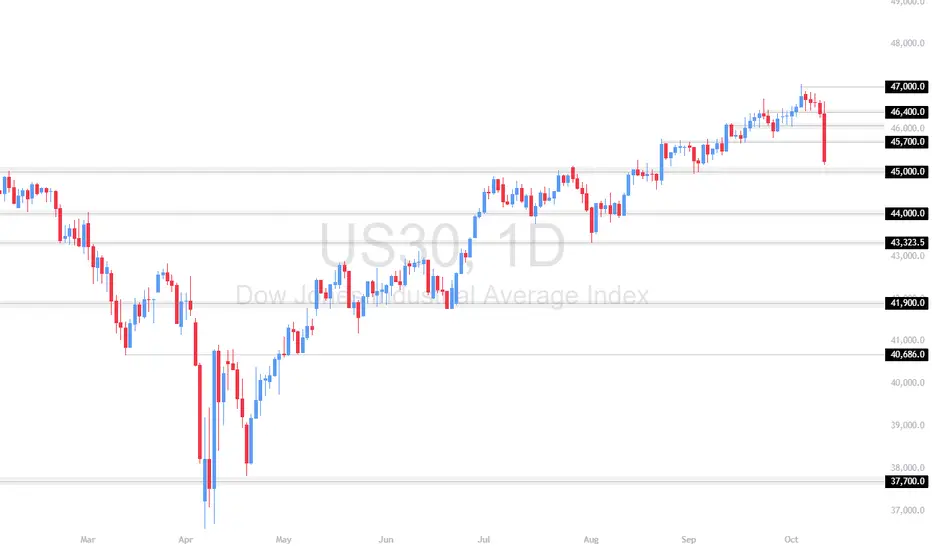
US30 – 45,000.00 Level Under Pressure: Wait or Act?After the sharp selloff that followed the tariff announcement shock, US30 broke below 46,400.00 and 45,700.00, plunging toward the key 45,000.00 psychological zone.
This level coincides with prior demand from mid-August and could act as the first real test of buyers’ strength after the October breakdown.
Support at : 45,000.00 🔽 44,000.00 🔽 43,323.50 🔽
Resistance at : 45,700.00 🔼 46,400.00 🔼 47,000.00 🔼
🔎 Bias:
🔼 Bullish: Only if 45,000.00 holds and price reclaims 45,700.00 — showing that buyers are defending the zone despite tariff fears.
🔽 Bearish: If price closes below 45,000.00 daily, momentum could accelerate toward 44,000.00 and 43,323.50 before November’s policy deadline.
📊 Fundamental Note:
Markets are hypersensitive to trade news. The tariff agreement between Trump and China (deadline Nov 1) is likely to dictate direction. Until clarity comes, volatility and uncertainty will dominate — meaning patience could be wiser than premature entries.
📛 Disclaimer: This is not financial advice. Trade at your own risk.
US30 Analysis (Short Bias)Market structure continues to respect the bearish outlook. After multiple rejections near the upper resistance zone, momentum has clearly shifted in favor of sellers. I’ve been anticipating this short move for a while, and it’s finally playing out as expected.
Last week’s price action toyed with my analysis, showing temporary bullish strength, but this week is confirming the setup for a deeper correction. The short is finally coming true after a long wait and has almost reached the target. The prediction was right.
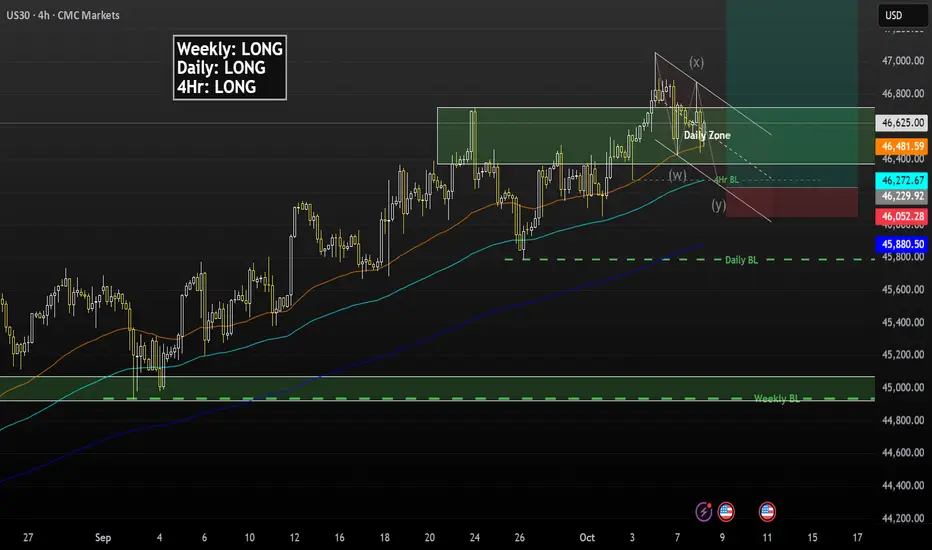
US30 4H🔹 Overall Outlook and Potential Price Movements
In the charts above, we have outlined the overall outlook and possible price movement paths.
As shown, each analysis highlights a key support or resistance zone near the current market price. The market’s reaction to these zones — whether a breakout or rejection — will likely determine the next direction of the price toward the specified levels.
⚠️ Important Note:
The purpose of these trading perspectives is to identify key upcoming price levels and assess potential market reactions. The provided analyses are not trading signals in any way.
✅ Recommendation for Use:
To make effective use of these analyses, it is advised to manually draw the marked zones on your chart. Then, on the 5-minute time frame, monitor the candlestick behavior and look for valid entry triggers before making any trading decisions.

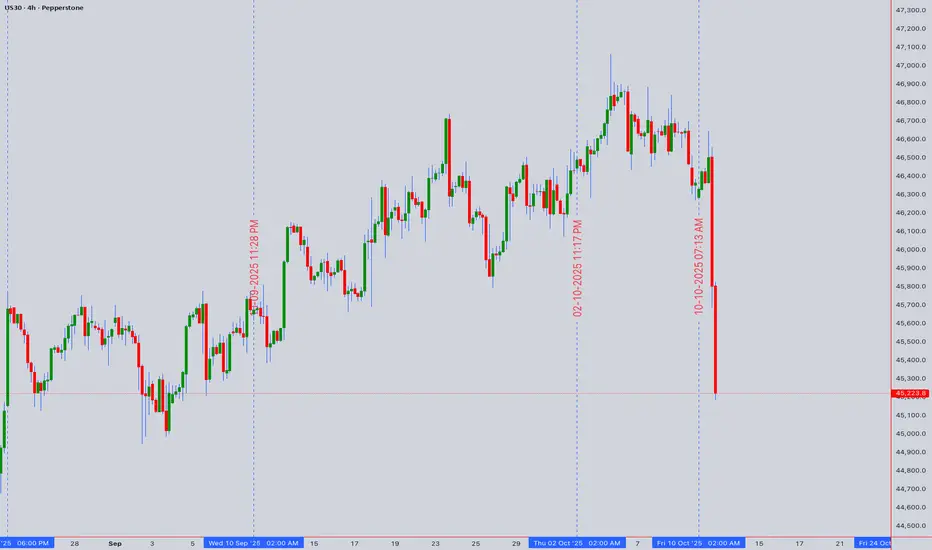
US30 (DOW30) At a Critical Juncture Amid Distribution Signs
The US30 consolidates near its all-time high of 45,223.8, showing early signs of exhaustion. Our multi-faceted analysis suggests a pivotal moment is at hand, with a bearish bias for the short term. The key level to watch is the recent high at 45,250, which is acting as a formidable resistance.
Intraday Trading Strategy (5M - 4H Charts)
Bearish Scenario: A rejection from the 45,150 - 45,250 resistance zone, confirmed by a bearish candlestick pattern (like a bearish engulfing) on the 1H chart, signals a short opportunity. Initial target is the 44,900 support (recent swing low), followed by 44,750. Use a tight stop above 45,300. The 1H RSI showing divergence and price action below the VWAP support this move.
Bullish Scenario: A decisive 4H close above 45,250 invalidates the immediate bearish outlook and could trigger a momentum buy. The target would then be an uncharted rally towards 45,500. However, low volume on any breakout would signal a potential bull trap.
Swing Trading Outlook (4H - Daily Charts)
The larger picture reveals a market potentially in a Wyckoff distribution phase. The failure to sustain new highs, coupled with rising volume on downswings, points to smart money distributing shares. An Elliott Wave count suggests we may be in a final Wave 5 extension or have completed it, priming for a larger corrective (ABC) pullback.
Swing Sell: A daily close below the key support at 44,500 would confirm a shift in medium-term momentum, opening targets down to 43,800 (50-day EMA and a significant psychological level).
Swing Buy: A sustained hold above 45,250, supported by strong volume and a bullish RSI crossover on the daily chart, would delay the bearish count and target new highs.
Key Technical Rationale:
RSI Divergence: The daily RSI is forming a bearish divergence against the higher price highs, indicating weakening momentum.
VWAP & Volume: Anchored VWAP from the last significant low shows price is extended. Recent up-moves appear on weaker volume, characteristic of a weak bullish trend.
Gann & Ichimoku: Price is trading at the upper range of a Gann square, suggesting a potential reversal zone. The Ichimoku Cloud on the 4H is thin, offering little dynamic support below 44,800.
Market Context: Geopolitical tensions and political uncertainty are injectting volatility, making risk assets like the DJI susceptible to sharp pullbacks. Traders should remain agile.
Disclaimer: This is technical analysis, not financial advice. Always use stop-losses and manage your risk accordingly.

Us30 analysis I believe the market is symmetrical; this symmetry occurs at all levels and is fractal in nature.
Given that the bullish cycle has not yet completed and we are in the third leg of the ascent, the best area for buying, with a margin of 300-400 points, is right at this point.
This is a long-term bullish swing.

US30 SENDS CLEAR BULLISH SIGNALS|LONG
US30 SIGNAL
Trade Direction: long
Entry Level: 45,553.8
Target Level: 46,661.5
Stop Loss: 44,818.8
RISK PROFILE
Risk level: medium
Suggested risk: 1%
Timeframe: 1D
Disclosure: I am part of Trade Nation's Influencer program and receive a monthly fee for using their TradingView charts in my analysis.
✅LIKE AND COMMENT MY IDEAS✅

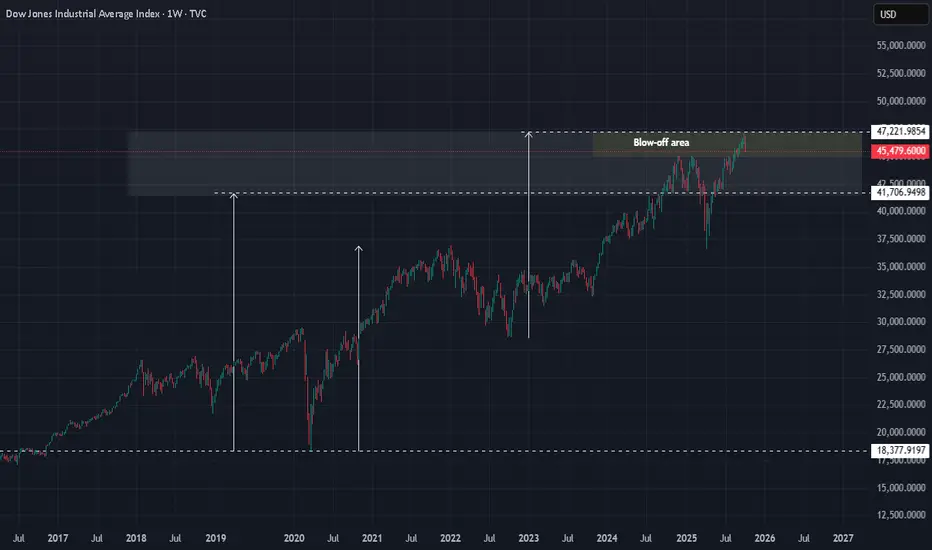
DJI : The ENDAll good things must come to an END.
Enjoy it while you can.
The same goes for Bitcoin.
In the end, all that matters is CASH in the pocket.
Good luck.

DJI : Remember what I wrote on 26/11/2024Long ago, I put up this chart.
Thanks to Trump, it is finally a reality.
Price has nowhere else to go but DOWN.
This is the kind of MONEY you can make by being patient.
Good luck.
SELLER'S WIN-MARKET TOOK A DEEP DIVE-US30Today was total domination by the Seller's. FVG's on higher timeframes were in totally in sync. 4hr,1hr,30min,15min,3min,1min.

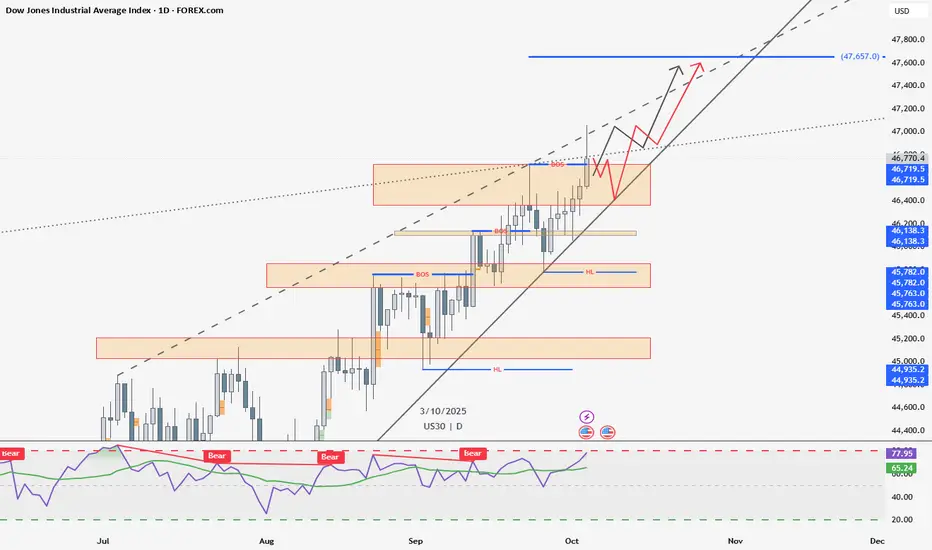
Dow Jones - US30 My Love — US30 💕
On the daily timeframe , the last daily candle closed slightly above the previous Higher High (46719.5) , creating a Break of Structure (BOS) — but it’s still below the trendline resistance (dotted line).
For next week, price could go either way :
Bullish scenario: Break the trendline resistance and continue higher, forming a new Higher High (HH) — possible target around 47,657.
Bearish retrace: Pull back to retest the lower trendline support before attempting another push to create a new HH.
Always fun watching how US30 reacts to trendlines 😄📈
FOREXCOM:US30
US30 - Potential LongHi Traders,
US30 has been in an UPTREND for a long time and looking for buy trades is only logical.
What now?
Wait for a retracement or a pull back
Look for lower time frame buy.
Good Luck
US30US30 – H4 Chart Analysis
Price action currently forming Higher Highs and Higher Lows, confirming a bullish structure.
After the recent Higher High, price retraced back to the zone where it had previously formed a Higher Low.
📍 From this Higher Low to Higher High, a Fibonacci Retracement was applied.
✅ Entry taken from the 0.5 Fibonacci level, aligning with a potential bullish continuation.
🛑 Stop Loss (SL) placed just below the previous Higher Low for structure-based invalidation.
🎯 Risk to Reward: 1:1
Structure: Bullish
Strategy: Pullback Entry in Uptrend
Timeframe: H4
Tool: Fibonacci Retracement

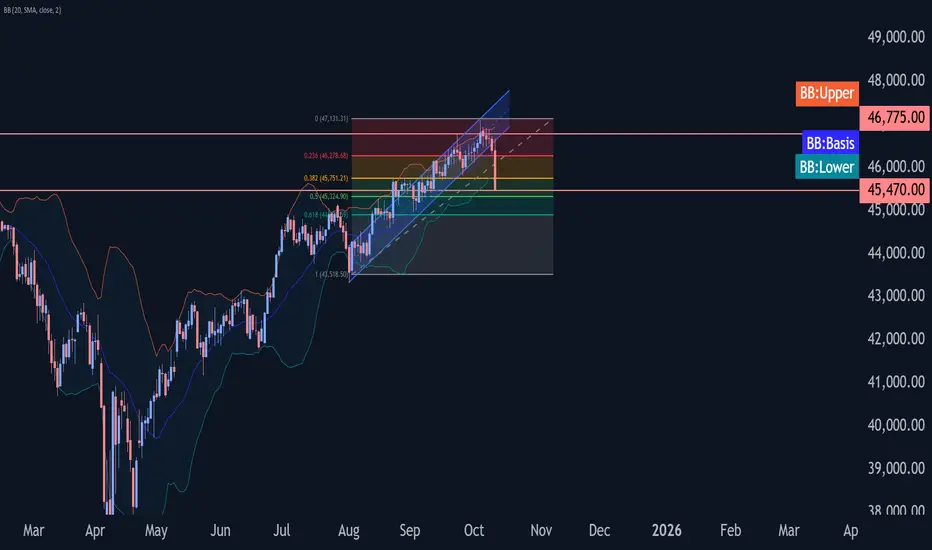
Dow Jones index Wave Analysis – 10 October 2025- Dow Jones index broke daily up channel from
- Likely to fall to support level 45470.00
Dow Jones index recently broke the daily up channel from end of July – which was preceded by the downward reversal from the key resistance level 46775.00 (former monthly high from last month).
The breakout of this up channel from accelerated the active short-term downward correction ii from the start of October from resistance level 46775.00.
Given the strength of the resistance level 46775.00 and the bearish divergence on the daily Stochastic indicator, Dow Jones index can be expected to fall to the next support level 45470.00 (target price for the completion of the active correction (ii)).
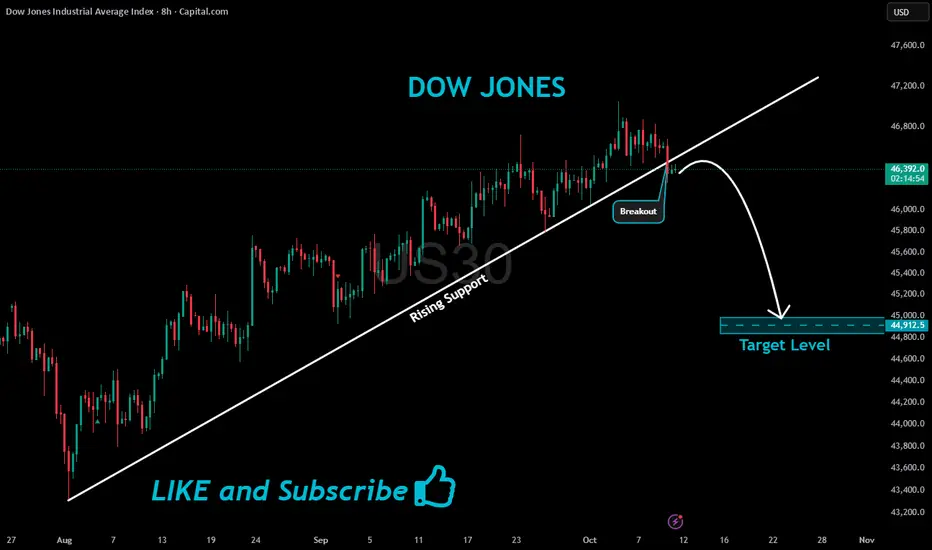
US30 Bearish Breakout!
HI,Traders !
#US30 made a bearish
Breakout of the rising support
Line and we are bearish biased
So we will be expecting a
Further bearish move down !
Comment and subscribe to help us grow !