IOTAUSDT: Will Bulls Break Free or Bears Take Full Control?Yello, Paradisers are you prepared for what could be the most decisive moment for #IOTAUSDT this quarter? Price action is tightening and the pressure is building, but only one side will win this battle. The question is: will it be the bulls or the bears?
💎For weeks, #IOTA has been respecting a bro

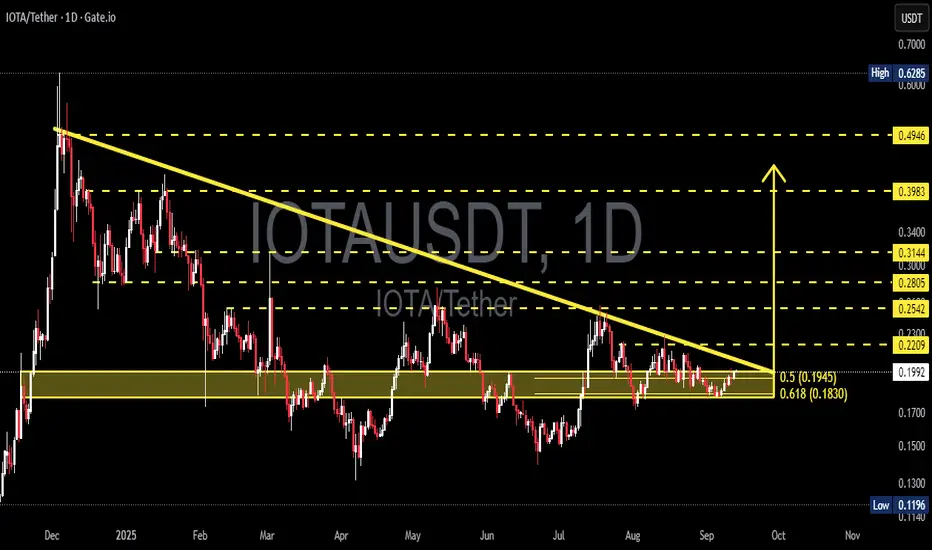
IOTA/USDT — the Crossroads: Major Breakout or Deeper Breakdown?
📌 Overview
The daily chart of IOTA is reaching a critical decision point. After months of being pressured by a long-term descending trendline, the price still manages to hold above the demand zone at 0.183 – 0.195 USDT (a confluence of the 0.618 & 0.5 Fibonacci retracements).
This structure has f
IOTA Market Update📉 FWB:IOTA Market Update
FWB:IOTA has broken the blue support level 🔵❌
This signals further downside risk, with price potentially moving toward the green support zone 🟢
The potential play:
🔹 If price reaches the green support zone, watch closely — this is where buyers previously accumulated st

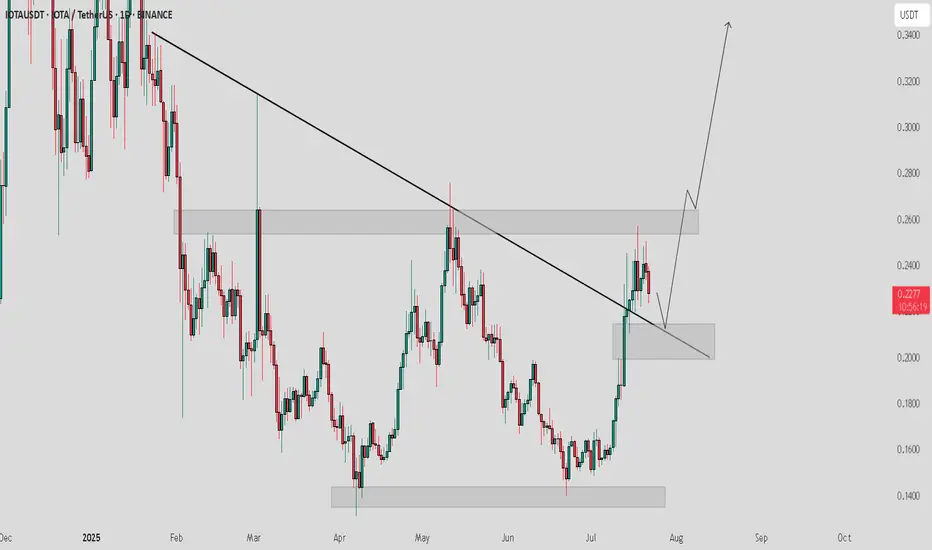
IOTA/USDT – Major Breakout from Long-Term Downtrend!📊 Chart Overview
After spending several months under pressure within a long-term descending trendline since December 2024, IOTA has finally shown a highly promising technical signal. The recent breakout didn’t just pierce the trendline — it was confirmed by a successful retest of the golden Fibonac

#IOTA/USDT T looking good to buy #IOTA
The price is moving within a descending channel on the 1-hour frame and is expected to break and continue upward.
We have a trend to stabilize above the 100 moving average once again.
We have a downtrend on the RSI indicator that supports the upward break.
We have a support area at the low

IOTA / USDT looking good to buy at the price of $0.2100IOTA/USDT faced rejection from local horizontal resistance and is now heading for a retest of the lower support zone. If market conditions remain stable, the $0.2100 area looks like a solid buy zone. The structure suggests a healthy pullback before a potential strong bounce.
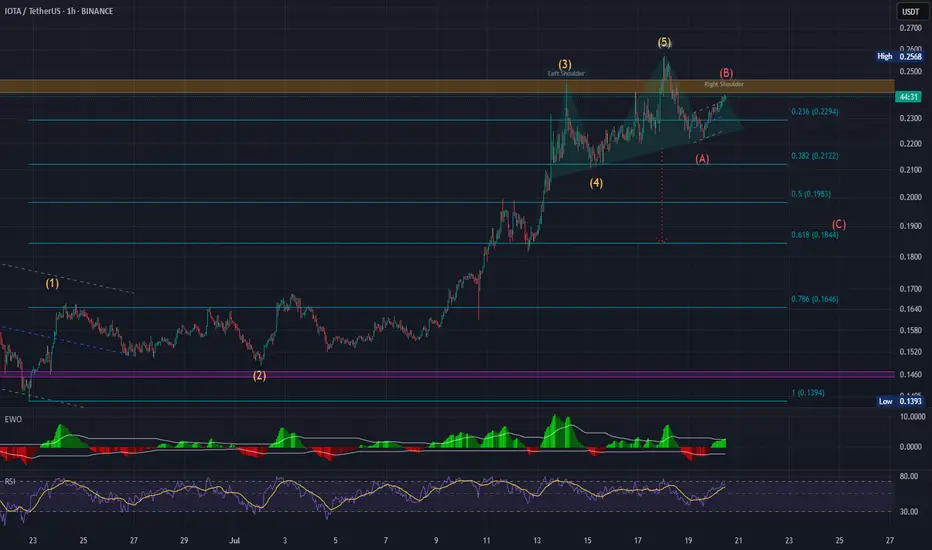
IOTA potential H&S reversalOn 1H IOTA forming right shoulder of H&S formation which may lead to a downside correction movement at 0.185 level

IOTA?
Hi,
Last move.. IT took 30 days blooming into a fantastic beast.
Don't expect a short-term vaganza.
I wish all the best.
Below 0.145 is a No NO.. if you understand
Not a guru.

IOTA/USDT Weekly Analysis – Critical Support Retest
📊 Pattern & Price Structure:
The chart indicates that IOTA is currently retesting a major historical demand zone in the range of $0.110 – $0.160, which has served as a strong support since 2020. The price has bounced off this area multiple times in the past, reinforcing it as a solid accumulation

See all ideas
Summarizing what the indicators are suggesting.
Oscillators
Neutral
SellBuy
Strong sellStrong buy
Strong sellSellNeutralBuyStrong buy
Oscillators
Neutral
SellBuy
Strong sellStrong buy
Strong sellSellNeutralBuyStrong buy
Summary
Neutral
SellBuy
Strong sellStrong buy
Strong sellSellNeutralBuyStrong buy
Summary
Neutral
SellBuy
Strong sellStrong buy
Strong sellSellNeutralBuyStrong buy
Summary
Neutral
SellBuy
Strong sellStrong buy
Strong sellSellNeutralBuyStrong buy
Moving Averages
Neutral
SellBuy
Strong sellStrong buy
Strong sellSellNeutralBuyStrong buy
Moving Averages
Neutral
SellBuy
Strong sellStrong buy
Strong sellSellNeutralBuyStrong buy
Displays a symbol's price movements over previous years to identify recurring trends.
Curated watchlists where IOTAUSDT.P is featured.

Gen 2: Crypto is here to stay - and it's brought some friends…
19 No. of Symbols

Smart contracts: Make the smart decision
36 No. of Symbols
See all sparks