Heating Up: Momentum Continuation in Italgas?Italgas S.p.A. (ORK1) has been a standout performer, registering an impressive 96% gain over the last year. As a key player in European energy infrastructure, Italgas manages an extensive natural gas distribution network, focusing on safety, digitization, and sustainable energy transition across
TG Holding SPA
No trades
Next report date
—
Report period
—
EPS estimate
—
Revenue estimate
—
495.72 M USD
2.57 B USD
671.05 M
About Italgas SpA
Sector
Industry
CEO
Paolo Gallo
Website
Headquarters
Milan
Founded
1837
IPO date
Nov 7, 2016
Identifiers
2
ISIN IT0005211237
Italgas SpA engages in the distribution of natural gas. Its services include meter operation, information security, service improvement, and plant management. It operates through the following segments: Gas Distribution, Energy Efficiency, and Corporate and Other Sectors. The Gas Distribution segment refers to gas distribution and metering activities carried out in Italy and Greece. The Energy Efficiency segment offers and implements energy efficiency measures for its customers in the residential and industrial sectors. The Corporate and Other Sectors segment includes services performed for third parties by the parent company Italgas, together with the activities of the water business. The Company was founded on September 12, 1837 and is headquartered in Milan, Italy.
Related stocks

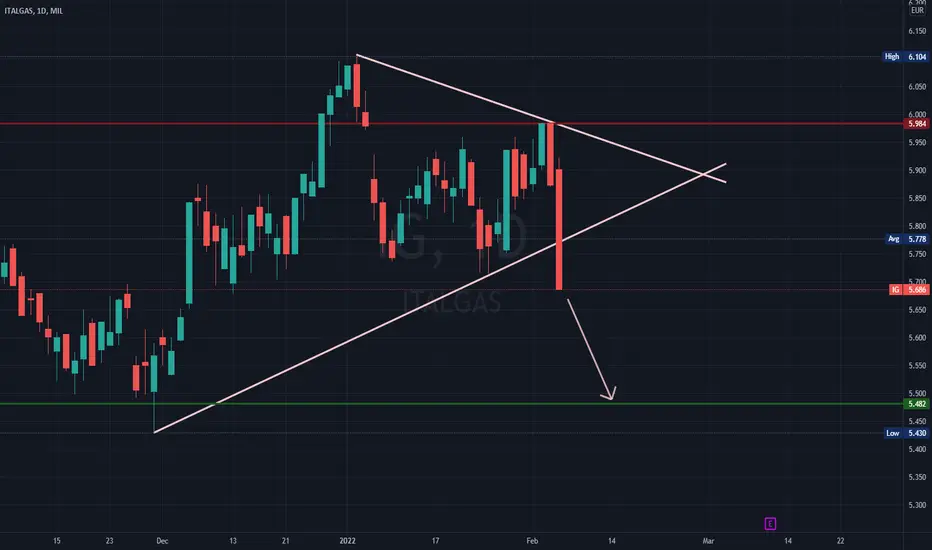
Italgas (IG.mi) bearish scenario:The technical figure Triangle can be found in the Italian company Italgas S.p.A. (IG.mi) at daily chart. Italgas S.p.A. is an Italian company specialised in the distribution of natural gas. It is listed on the Milan Stock Exchange and included in the FTSE MIB index. The Triangle has broken through t

See all ideas
Summarizing what the indicators are suggesting.
Neutral
SellBuy
Strong sellStrong buy
Strong sellSellNeutralBuyStrong buy
Neutral
SellBuy
Strong sellStrong buy
Strong sellSellNeutralBuyStrong buy
Neutral
SellBuy
Strong sellStrong buy
Strong sellSellNeutralBuyStrong buy
An aggregate view of professional's ratings.
Neutral
SellBuy
Strong sellStrong buy
Strong sellSellNeutralBuyStrong buy
Neutral
SellBuy
Strong sellStrong buy
Strong sellSellNeutralBuyStrong buy
Neutral
SellBuy
Strong sellStrong buy
Strong sellSellNeutralBuyStrong buy
Displays a symbol's price movements over previous years to identify recurring trends.
Frequently Asked Questions
The current price of ITGGF is 12.37 USD — it has decreased by −2.61% in the past 24 hours. Watch TG Holding SPA stock price performance more closely on the chart.
Depending on the exchange, the stock ticker may vary. For instance, on OTC exchange TG Holding SPA stocks are traded under the ticker ITGGF.
ITGGF stock has risen by 2.66% compared to the previous week, the month change is a 14.59% rise, over the last year TG Holding SPA has showed a 100.81% increase.
We've gathered analysts' opinions on TG Holding SPA future price: according to them, ITGGF price has a max estimate of 13.03 USD and a min estimate of 10.90 USD. Watch ITGGF chart and read a more detailed TG Holding SPA stock forecast: see what analysts think of TG Holding SPA and suggest that you do with its stocks.
ITGGF reached its all-time high on Jan 20, 2026 with the price of 12.05 USD, and its all-time low was 5.01 USD and was reached on Dec 7, 2023. View more price dynamics on ITGGF chart.
See other stocks reaching their highest and lowest prices.
See other stocks reaching their highest and lowest prices.
ITGGF stock is 2.68% volatile and has beta coefficient of 0.26. Track TG Holding SPA stock price on the chart and check out the list of the most volatile stocks — is TG Holding SPA there?
Today TG Holding SPA has the market capitalization of 12.96 B, it has increased by 4.52% over the last week.
Yes, you can track TG Holding SPA financials in yearly and quarterly reports right on TradingView.
TG Holding SPA is going to release the next earnings report on Mar 4, 2026. Keep track of upcoming events with our Earnings Calendar.
ITGGF earnings for the last quarter are 0.21 USD per share, whereas the estimation was 0.18 USD resulting in a 11.51% surprise. The estimated earnings for the next quarter are 0.20 USD per share. See more details about TG Holding SPA earnings.
TG Holding SPA revenue for the last quarter amounts to 790.66 M USD, despite the estimated figure of 781.62 M USD. In the next quarter, revenue is expected to reach 831.11 M USD.
ITGGF net income for the last quarter is 207.46 M USD, while the quarter before that showed 199.45 M USD of net income which accounts for 4.02% change. Track more TG Holding SPA financial stats to get the full picture.
Yes, ITGGF dividends are paid annually. The last dividend per share was 0.46 USD. As of today, Dividend Yield (TTM)% is 3.55%. Tracking TG Holding SPA dividends might help you take more informed decisions.
TG Holding SPA dividend yield was 7.50% in 2024, and payout ratio reached 68.78%. The year before the numbers were 6.80% and 64.93% correspondingly. See high-dividend stocks and find more opportunities for your portfolio.
As of Feb 14, 2026, the company has 4.34 K employees. See our rating of the largest employees — is TG Holding SPA on this list?
Like other stocks, ITGGF shares are traded on stock exchanges, e.g. Nasdaq, Nyse, Euronext, and the easiest way to buy them is through an online stock broker. To do this, you need to open an account and follow a broker's procedures, then start trading. You can trade TG Holding SPA stock right from TradingView charts — choose your broker and connect to your account.
Investing in stocks requires a comprehensive research: you should carefully study all the available data, e.g. company's financials, related news, and its technical analysis. So TG Holding SPA technincal analysis shows the buy rating today, and its 1 week rating is buy. Since market conditions are prone to changes, it's worth looking a bit further into the future — according to the 1 month rating TG Holding SPA stock shows the buy signal. See more of TG Holding SPA technicals for a more comprehensive analysis.
If you're still not sure, try looking for inspiration in our curated watchlists.
If you're still not sure, try looking for inspiration in our curated watchlists.