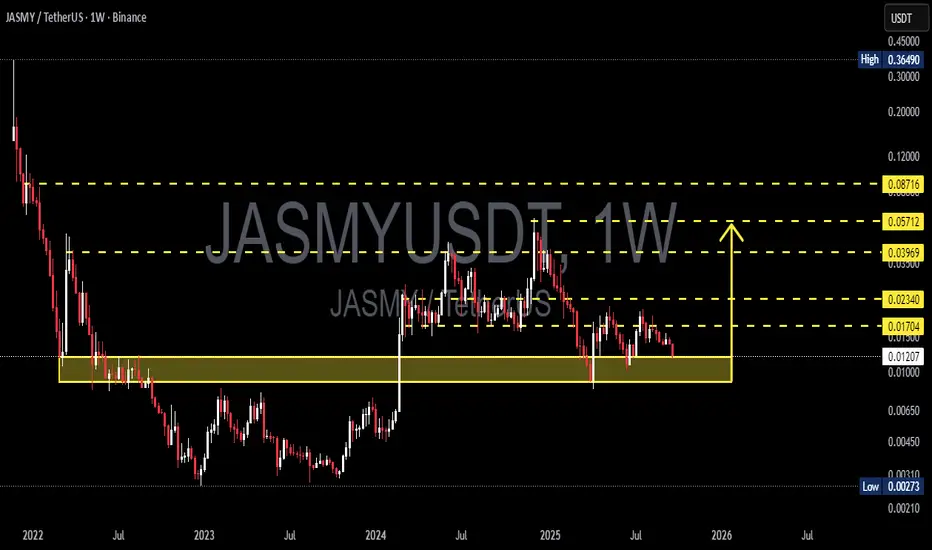
JASMY/USDT — Demand Zone: Bounce or Breakdown to Historical Low?Overview
The weekly chart of JASMY/USDT is currently at a crucial point. Price is sitting right inside the long-term demand zone around 0.010 – 0.013 USDT, which has repeatedly acted as a structural floor since 2022. This zone is the “last line of defense” before a potential move back toward the hi
Related pairs
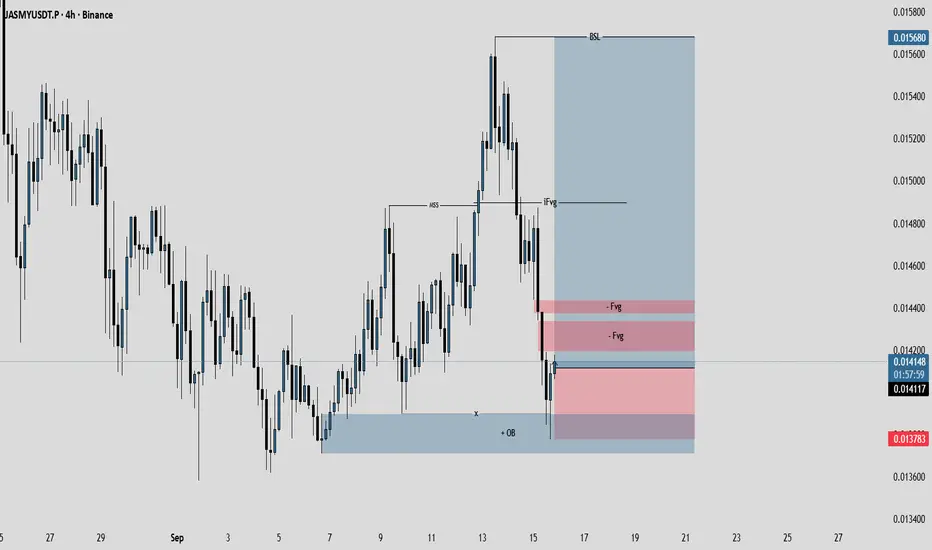
JASMY/USDT Perpetual (JASMYUSDT.P) 4H Timeframe AnalysisJASMYUSDT.P shows a short-term bearish correction within a broader neutral-to-bullish structure. The price has declined from a local high near $0.017 in late August to recent lows around $0.014, forming a descending channel with lower highs and lows. Volume appears moderate during the pullback, sugg
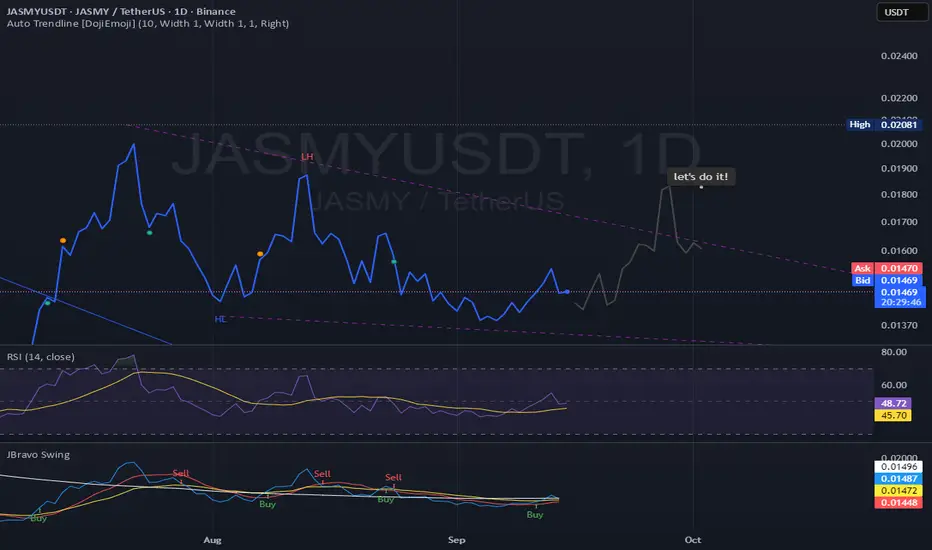
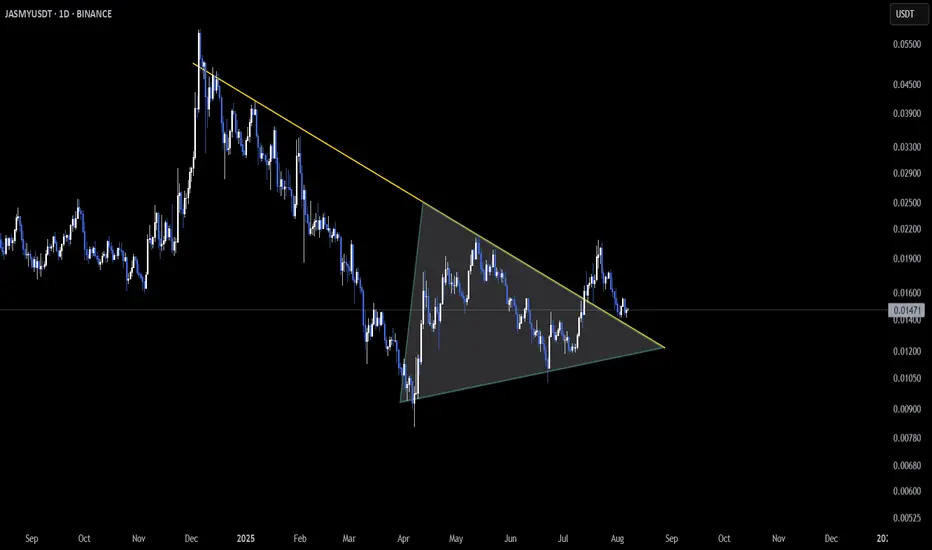
$JASMY #breakout, tekchkFalling wedge patten on the daily, check - then a older bar pattern copy and predict.
let's see if it pans out!
Thanks again, i am learning alot!
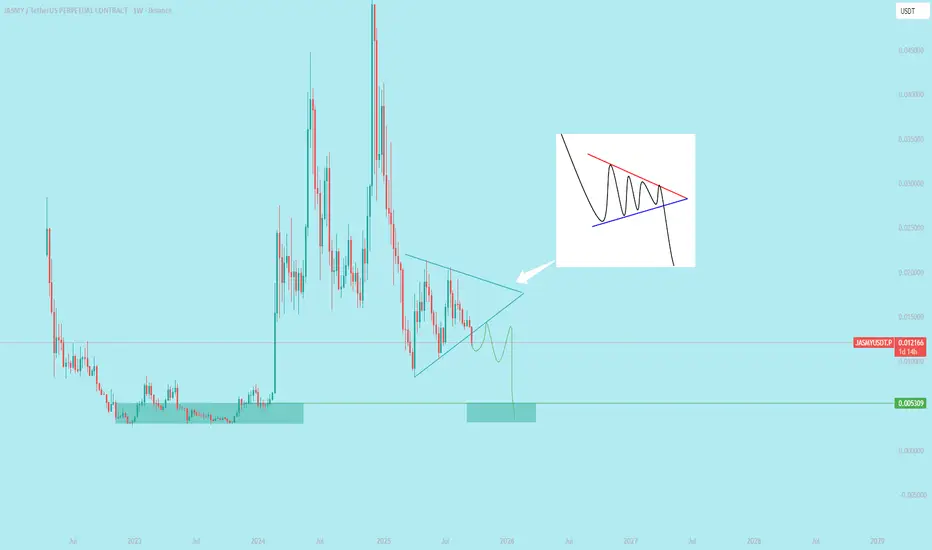
$JASMY Breakdown Bearish Symmetrical Triangle in 1W
`A bearish symmetrical triangle is a continuation pattern in technical analysis that forms during a downtrend. It signals a period of market consolidation where neither buyers nor sellers have a clear advantage, suggesting a potential continuation of the prevailing downward trend once the pattern i
Jasmy in accumulation phase. JASMY is consolidating and creating a potential order block. However, considering bullish momentum and bearish responses could result in a swing failure, giving us the perfect opportunity to hunt trendline liquidity. Acumulation is the plan.

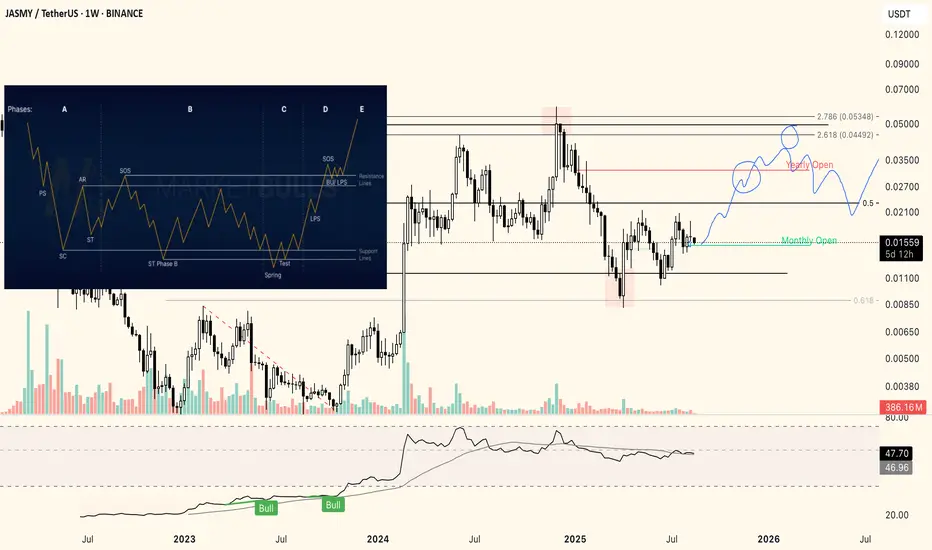
JASMY possibly finishing an accumulation scheme hereAs said in the title, current PA looks like we are now finishing the Spring & Spring-test phase of a wyckoff accumulation cycle. Blue squiggly line is type of PA I expect, not an exact representation. DYOR.

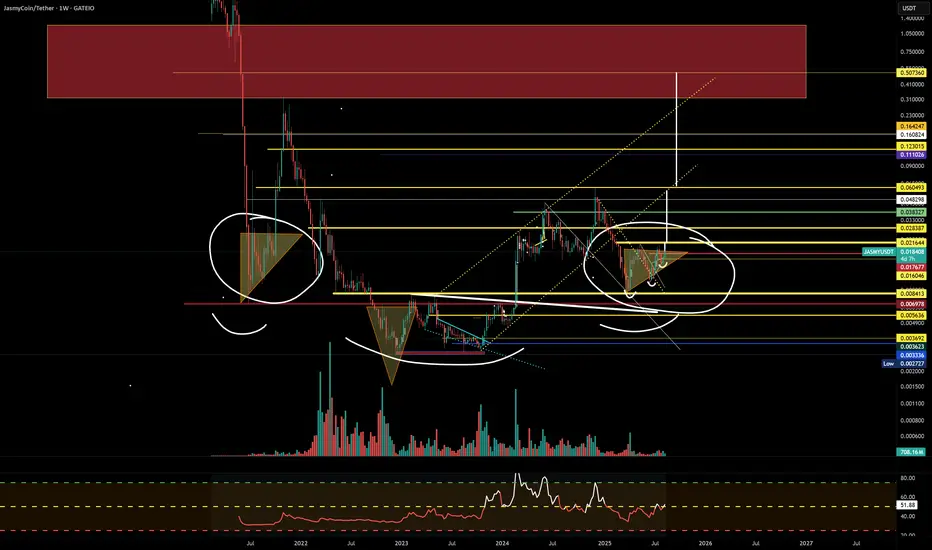
INVERSE HS MACROBeen following JASMY for a couple years now...took it from the lows and sold waiting for the macro right shoulder to form. No coincidence that it is putting in the same macro weekly ascending triangle on the right shoulder that it did on the left shoulder from 2021. It held the other day while the
JASMY – Retest After Triangle Breakout📆 On the Daily timeframe, SEED_DONKEYDAN_MARKET_CAP:JASMY has broken out of a symmetrical triangle and recently retested the breakout zone successfully ✅. It’s now hovering near the same support, making this a critical level to monitor.
This kind of post-breakout retest is often seen before conti
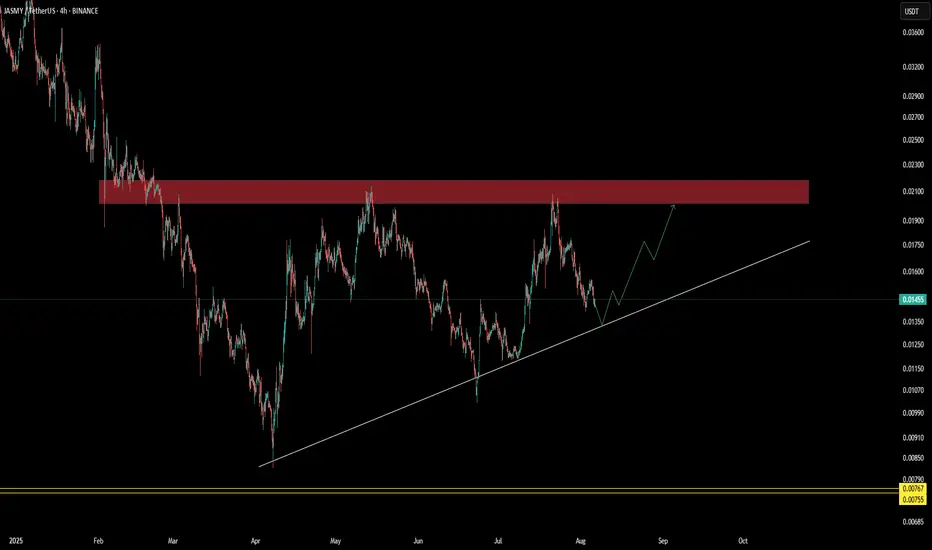
$JASMY ascending triangle patternSEED_DONKEYDAN_MARKET_CAP:JASMY price is hovering near the support trendline, and the chart is forming a bullish structure with consistent higher lows.
If the price manages to hold, this could be a good buy zone near support IMO.
See all ideas
Summarizing what the indicators are suggesting.
Oscillators
Neutral
SellBuy
Strong sellStrong buy
Strong sellSellNeutralBuyStrong buy
Oscillators
Neutral
SellBuy
Strong sellStrong buy
Strong sellSellNeutralBuyStrong buy
Summary
Neutral
SellBuy
Strong sellStrong buy
Strong sellSellNeutralBuyStrong buy
Summary
Neutral
SellBuy
Strong sellStrong buy
Strong sellSellNeutralBuyStrong buy
Summary
Neutral
SellBuy
Strong sellStrong buy
Strong sellSellNeutralBuyStrong buy
Moving Averages
Neutral
SellBuy
Strong sellStrong buy
Strong sellSellNeutralBuyStrong buy
Moving Averages
Neutral
SellBuy
Strong sellStrong buy
Strong sellSellNeutralBuyStrong buy
Displays a symbol's price movements over previous years to identify recurring trends.
Frequently Asked Questions
The current price of JasmyCoin / Tether SPOT (JASMY) is 0.01226 USDT — it has risen 1.39% in the past 24 hours. Try placing this info into the context by checking out what coins are also gaining and losing at the moment and seeing JASMY price chart.
JasmyCoin / Tether SPOT price has fallen by −12.81% over the last week, its month performance shows a −18.86% decrease, and as for the last year, JasmyCoin / Tether SPOT has decreased by −48.85%. See more dynamics on JASMY price chart.
Keep track of coins' changes with our Crypto Coins Heatmap.
Keep track of coins' changes with our Crypto Coins Heatmap.
JasmyCoin / Tether SPOT (JASMY) reached its highest price on Dec 6, 2024 — it amounted to 0.05909 USDT. Find more insights on the JASMY price chart.
See the list of crypto gainers and choose what best fits your strategy.
See the list of crypto gainers and choose what best fits your strategy.
JasmyCoin / Tether SPOT (JASMY) reached the lowest price of 0.00289 USDT on Aug 17, 2023. View more JasmyCoin / Tether SPOT dynamics on the price chart.
See the list of crypto losers to find unexpected opportunities.
See the list of crypto losers to find unexpected opportunities.
The safest choice when buying JASMY is to go to a well-known crypto exchange. Some of the popular names are Binance, Coinbase, Kraken. But you'll have to find a reliable broker and create an account first. You can trade JASMY right from TradingView charts — just choose a broker and connect to your account.
Crypto markets are famous for their volatility, so one should study all the available stats before adding crypto assets to their portfolio. Very often it's technical analysis that comes in handy. We prepared technical ratings for JasmyCoin / Tether SPOT (JASMY): today its technical analysis shows the sell signal, and according to the 1 week rating JASMY shows the sell signal. And you'd better dig deeper and study 1 month rating too — it's sell. Find inspiration in JasmyCoin / Tether SPOT trading ideas and keep track of what's moving crypto markets with our crypto news feed.
JasmyCoin / Tether SPOT (JASMY) is just as reliable as any other crypto asset — this corner of the world market is highly volatile. Today, for instance, JasmyCoin / Tether SPOT is estimated as 2.23% volatile. The only thing it means is that you must prepare and examine all available information before making a decision. And if you're not sure about JasmyCoin / Tether SPOT, you can find more inspiration in our curated watchlists.
You can discuss JasmyCoin / Tether SPOT (JASMY) with other users in our public chats, Minds or in the comments to Ideas.