Sell Stop Break above 109.600 signals bullish continuation, while 108.000 break down indicates retracement within the same yen flow.
JPYCAD trade ideas

Buy StopBreak above 109.600 signals bullish continuation, while 108.000 break down indicates retracement within the same yen flow.


CADJPY 4H shortI started already selling CADJPY at 107.704, because the the price gap is huge and also makes the trend super extended and oversold on the 1H. Price gaps tend to fill often.
The first resistance level is at 107.998, the second resistance level is at 108.937.
I believe on of the two levels will trigger the selloff big time to the gap possibly.
So in between I'm happy to sell.
I placed 4 sell limit orders with 30 pips difference each see the chart.
There is also high impact news for JPY and CAD so let's see if that can fuel the party.
Combined with my rules it looks like a good story that is coming togheter:
Rules:
extended trend
no pullbacks / consillidation
support or resistance zone
rsi oversold or overbought
PS: CADJPY is simmilar as USDJPY btw but I like CADJPY more because there are more resistance levels visible on the 4H chart.

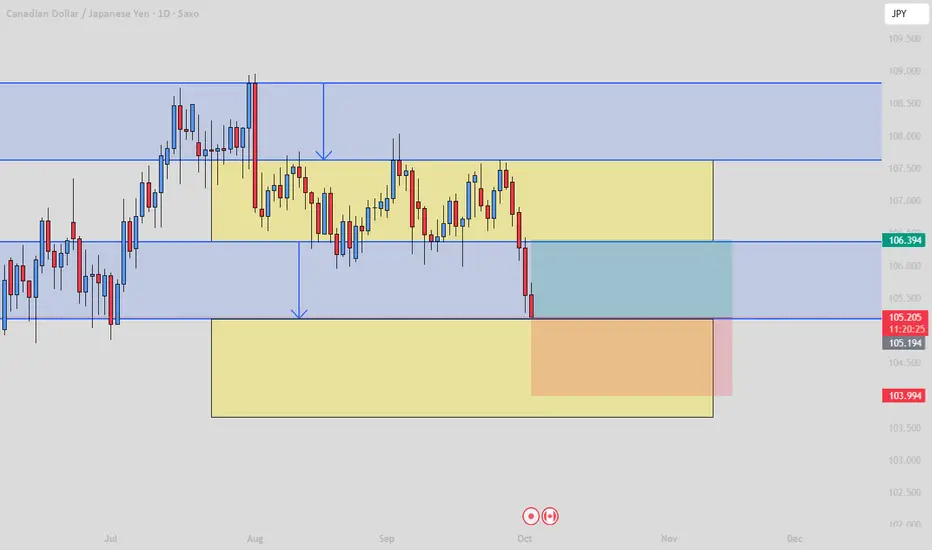
Range Theory - Daily Chart - CADJPYTrading via ranges through daily chart.
Looking for a fall/rise at price, checking the consolidation area which defines the stop levels as chart shows.
CADJPY Long
Entry 106.251
SL 105.836
TP 106.663
The asset is testing a key effective daily demand zone, and it is undervalued versus Yen.

CADJPY Will Go Lower From Resistance! Sell!
Here is our detailed technical review for CADJPY.
Time Frame: 1D
Current Trend: Bearish
Sentiment: Overbought (based on 7-period RSI)
Forecast: Bearish
The market is testing a major horizontal structure 107.266.
Taking into consideration the structure & trend analysis, I believe that the market will reach 106.211 level soon.
P.S
Please, note that an oversold/overbought condition can last for a long time, and therefore being oversold/overbought doesn't mean a price rally will come soon, or at all.
Like and subscribe and comment my ideas if you enjoy them!


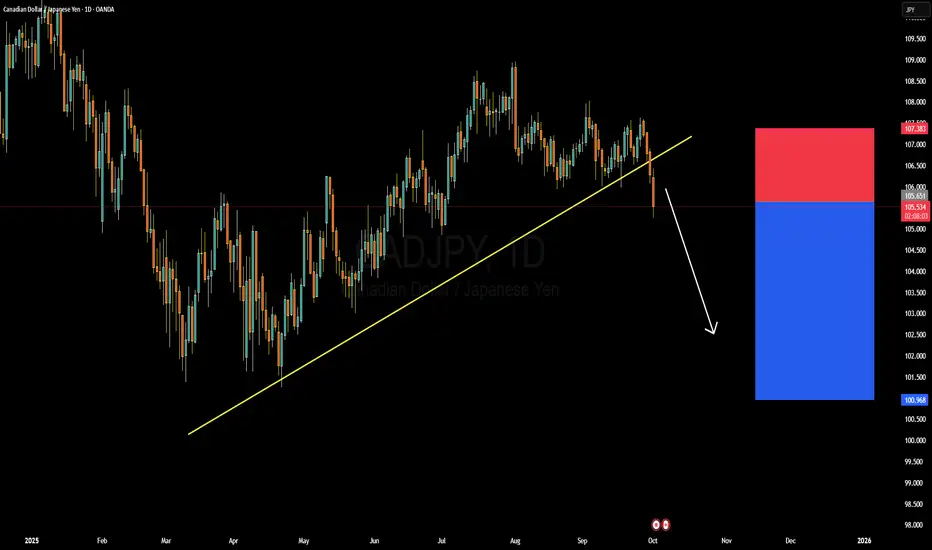
CADJPY Forming Ascending TrendlineCADJPY is currently trading around 105.50 after breaking below its long-term ascending trendline on the daily chart. This bearish breakdown signals potential continuation toward lower levels, with sellers gaining momentum after several failed attempts to sustain above 107.00. The rejection at higher levels indicates exhaustion from buyers, leaving room for the pair to retrace deeper toward the 102.00–101.00 support zone in the coming weeks.
From a fundamental angle, the Canadian dollar is under pressure as oil prices face renewed volatility due to uncertain global demand and fluctuating supply dynamics. At the same time, the Japanese yen is drawing safe-haven demand, especially as global investors remain cautious ahead of central bank guidance. With the Bank of Japan signaling a gradual shift from ultra-loose policy and the Bank of Canada holding a cautious stance due to softer economic data, the yen has an edge in the current risk environment.
Technically, the clean break of the ascending trendline confirms a potential trend reversal, and the bearish momentum is expected to strengthen if the pair stays below 106.00. Sellers will be eyeing the 103.50 and 101.00 zones as profit targets, while any pullback toward 106.80–107.30 is likely to attract fresh supply.
Traders should remain alert to upcoming Canadian employment and inflation data, as well as BOJ policy remarks, which could bring sharp volatility. For now, downside setups remain favorable while price action holds below the broken trendline, offering solid profit opportunities toward key support levels.
CAD/JPY SELLS? Easy Sell spot throughout today. Hope am not tripping lol
B Setup. Retracement to OB targeting OB and Lows.
Continue holding trade if price breaks TP with huge volume targeting lows.
Manage Risk efficiently

CADJPY — 4H watchSimilar read to CHFJPY: after the drop, momentum is sitting under 50 and hinting at divergence. I won’t chase the first bounce—want to see a hammer candle at my zone and strong volume (≥75) to confirm structure. If VMS lines up, I’ll take the A-grade. If not, I’ll protect the bankroll and move on. Process over prediction.
Educational only. Not financial advice.
#CADJPY #ForexTrading #AlignedExecution #APlusOnly #VMS

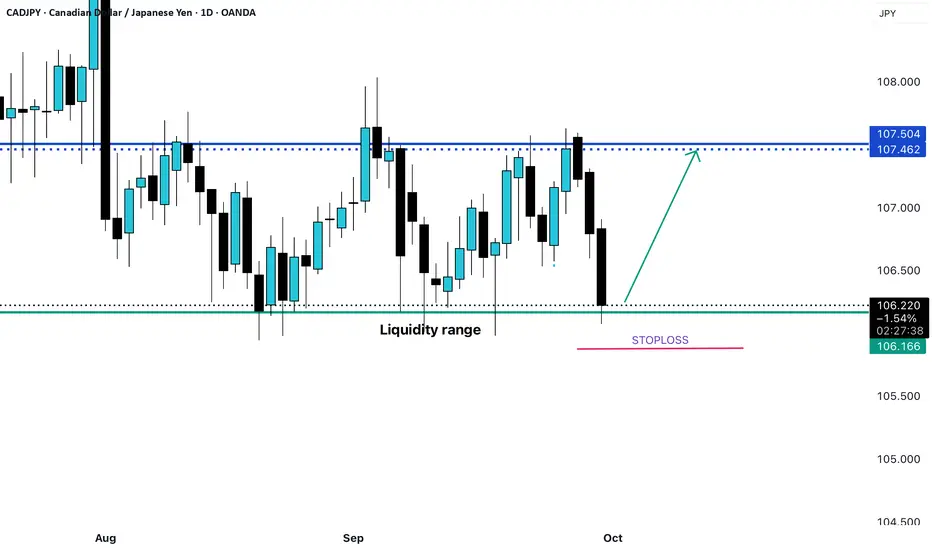
CADJPY another swing cycle ? Risky longCADJPY is trading in box range has now reached the support level .. can pull back up again
Going UP!- CADJPYPending: Buy Limit
Entry: 106.938-107.341
SL: 106.342
TP: 107.636- 108.037
TP: 110.240-110.340
TP: 111.635-112.042
TP: 116.140
FinalTP: 118.935
Please refer to my Trade Analysis Overbought NO where in sight for supporting reasoning.

CADJPY On The Rise! BUY!
My dear subscribers,
This is my opinion on the CADJPY next move:
The instrument tests an important psychological level 107.22
Bias - Bullish
Technical Indicators: Supper Trend gives a precise Bullish signal, while Pivot Point HL predicts price changes and potential reversals in the market.
Target - 107.37
My Stop Loss - 107.13
About Used Indicators:
On the subsequent day, trading above the pivot point is thought to indicate ongoing bullish sentiment, while trading below the pivot point indicates bearish sentiment.
Disclosure: I am part of Trade Nation's Influencer program and receive a monthly fee for using their TradingView charts in my analysis.
———————————
WISH YOU ALL LUCK

[CADJPY] Trade ideaSecond wave short on this one. The higher timeframe looks to be changing the tendency so warning in case of upside continuation.
Great Trade !

CAD-JPY Free Signal! Sell!
Hello,Traders!
CADJPY rejects a horizontal supply area after a fakeout sweep, signaling SMC distribution. Bears aim to drive price lower into liquidity resting near 107.27. Time Frame 2H.
-------------------
Stop Loss: 107.616
Take Profit: 107.271
Entry: 107.435
Time Frame: 2H
-------------------
Sell!
Comment and subscribe to help us grow!
Check out other forecasts below too!
Disclosure: I am part of Trade Nation's Influencer program and receive a monthly fee for using their TradingView charts in my analysis.

CADJPY: Bearish Forecast & Outlook
The price of CADJPY will most likely collapse soon enough, due to the supply beginning to exceed demand which we can see by looking at the chart of the pair.
Disclosure: I am part of Trade Nation's Influencer program and receive a monthly fee for using their TradingView charts in my analysis.
❤️ Please, support our work with like & comment! ❤️

23-09-2025 CADJPYAs shown in the figure: 15M Bullish Cypher
The market is not always chaotic and disorderly, and there is a precise geometric beauty hidden in price fluctuations. The harmonic form long strategy is a powerful tool for accurately identifying potential market reversal points based on the Fibonacci ratio. When the form forms perfectly at the key support level, it often indicates the depletion of bearish momentum and the initiation of bullish trends.

CADJPY higher bullish for expect
OANDA:CADJPY nice construction we have, PA is breaked, currently price is break and zone which is placed above top PA line, from here having higher bullish expectations.
SUP zone: 106.800
RES zone: 108.000, 108.300

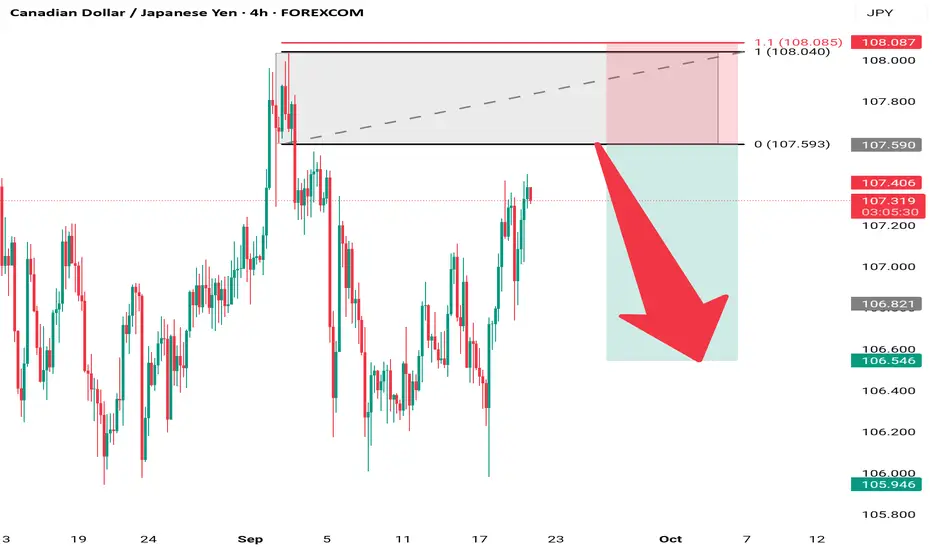
Cadjpy shortEntry Zone (Supply Area):
Around 107.59 – 108.08 (highlighted grey box).
Price is expected to react bearish from this resistance zone.
Stop Loss:
Just above 108.08 (top of the supply zone).
This protects against a breakout continuation.
Target Zone:
Around 106.00 – 105.95 (lower green box).
This is the projected support area.
📉 Trade Idea
Bias: Bearish (short).
The red arrow suggests that price may reject from the supply zone and head lower.
Risk-to-reward (RRR) looks favorable, roughly 1:2.
🧠 Technical Rationale
1. Supply Zone Rejection:
Price is retesting a prior resistance zone where sellers have stepped in before.
2. Trend Structure:
On the 4H chart, CAD/JPY is in a corrective rally after a bearish move — this could be a retracement before continuation down.
3. Candlestick Behavior:
If bearish rejection candles (e.g., wicks, engulfing) form near 107.80 – 108.00, it strengthens the short bias.
CADJPY Breakdown Incoming? Specs Selling CAD, Buying JPY1. Retail Sentiment
68% long vs 32% short → The majority of retail traders are positioned long.
From a contrarian perspective, this increases the risk of a downside move to flush out these long positions.
2. Seasonality
JPY (September): historically tends to appreciate from mid-month onward.
CAD (September): historically weak, with flat to negative performance.
Seasonal Bias: favors strong JPY / weak CAD → bearish CADJPY outlook.
3. Commitment of Traders (COT)
CAD (Sept 16, 2025):
Non-commercials: still heavily net short (128k short vs 21k long).
Commercials: strong long exposure (218k), but speculative flows remain bearish.
Bias: CAD continues to be sold by speculators → bearish pressure.
JPY (Sept 16, 2025):
Non-commercials: net long (161k long vs 100k short).
Commercials: strong shorts (163k), as usual for hedging.
Bias: speculators are accumulating JPY longs, reinforcing strength.
👉 COT View = Weak CAD, Strong JPY → Bearish confirmation for CADJPY.
4. Technical Analysis
Current price: 106.77, trading inside the daily demand zone (106.50–106.00).
Structure:
Well-defined descending channel.
Multiple bounces in the 106.00–106.20 area → key support zone.
RSI neutral, not yet oversold.
Scenarios:
Scenario A (probable): break below 106.20 → extension towards 105.50, then 104.80 (swing low zone).
Scenario B (alternative): technical bounce from demand (106.20–106.00) → recovery towards 107.80/108.00 (weekly supply).
✅ Conclusion: CADJPY shows a bearish setup supported by COT, seasonality, and contrarian sentiment. The technicals highlight a descending channel with potential breakdown below 106.00. Best setups: short on pullbacks with targets at 105.50–105.00.

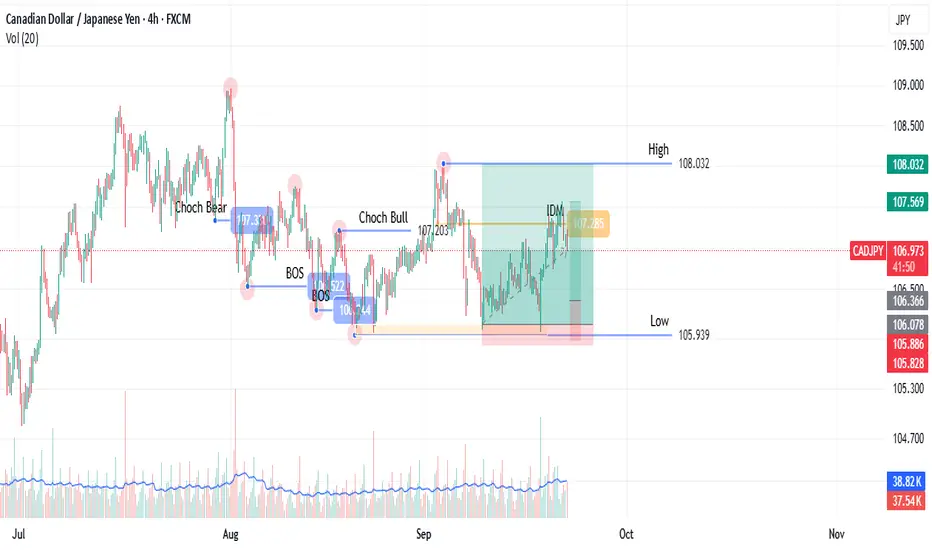
SMC Concept: Defining the Trading Range (Step 1) On CADJPYCAD/JPY, 4H Timeframe (as demonstrated)
This post outlines the first step in a methodology focused on identifying key market structure levels. The goal is to objectively define a trading range, using CAD/JPY as the example.
The Process: Of a bullish Structure
Identify the range Low: Locate the last retracement from the previous high, the low is deepest price level retraced to.
Find the Inducement: Mark the low of the most recent pullback (retracement) before the price made a new high.
Wait for Confirmation: The high is only confirmed once price returns to hit this inducement level. This validates the high as an official range boundary.
A break of the confirmed high is a break of structure (BOS). A break of the confirmed low suggests a change of character (CHoCH), shifting sentiment.
This is the foundational step for identifying future points of interest. The next step involves plotting POIs based on this confirmed range.
This methodology is based on one that I learned from someone else on Youtube, but I have changed many details to suit my style. As a thank you note, I have referred to this person on other paltforms, but unfortunately, I don't think I can do this here as I might be violating this platform's rules.
I will be posting the next steps that would lead to deciding on a trading position on step by step basis.
I am already making videos but I might be using this platforms video option for later posts.