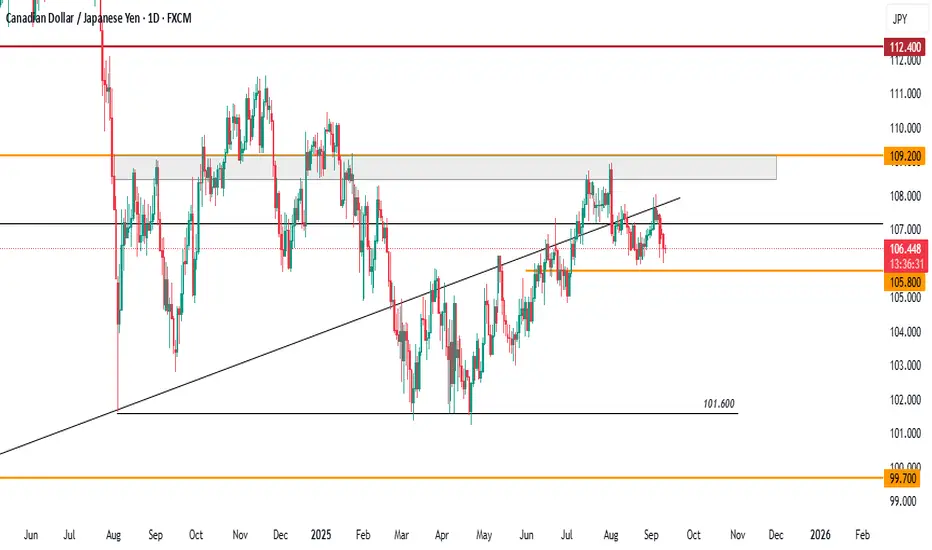
CAD/JPY Daily AnalysisIn April 2025, we saw buyers finally take control after sellers couldn't break the 101.50 barrier.
Is the most recent price action just a correction or is it a change in sentiment though?
Look for a bounce or a breakout and then a trade that meets your strategy rules.
JPYCAD trade ideas

CADJPY Sellers Target Key Support as Momentum FadesCADJPY has slipped after failing to sustain momentum above the 107 handle, and the price action now leans toward renewed downside pressure. The chart structure shows repeated rejections and lower highs forming, which opens the door for a deeper pullback. With oil prices struggling to hold gains and JPY catching periodic safe-haven bids, this cross looks vulnerable to further declines.
Current Bias
Bearish – CADJPY is showing weakness with sellers eyeing lower support levels.
Key Fundamental Drivers
CAD: Weak Canadian labor market data and rising BoC rate cut expectations pressure CAD. Oil prices remain soft, removing an important support pillar.
JPY: The yen continues to benefit from safe-haven demand, especially during global risk-off waves and BoJ’s gradual steps toward yield control adjustments.
Yield spreads: Narrowing spreads between CAD and JPY rates reduce CADJPY’s carry appeal.
Macro Context
Interest rates: The BoC is leaning dovish after weak jobs and growth numbers, while the BoJ’s cautious shift away from ultra-loose policy provides structural support to the yen.
Growth trends: Canada faces slowing growth amid weaker domestic demand, while Japan’s growth remains modest but steady.
Commodities: Oil weakness weighs on CAD.
Geopolitical: Risk-off events (tariff disputes, Middle East tensions) tend to favor JPY strength, amplifying CADJPY downside.
Primary Risk to the Trend
A sharp recovery in oil prices or a stronger-than-expected Canadian economic release could lift CAD and cap downside momentum in this pair.
Most Critical Upcoming News/Event
Canada CPI and retail sales for confirmation of BoC’s dovish outlook.
BoJ policy commentary for clarity on yield control and inflation stance.
Leader/Lagger Dynamics
CADJPY tends to act as a lagger, often following broader risk sentiment and oil price movements. It also reacts to USDJPY moves, meaning JPY flows largely set the pace.
Key Levels
Support Levels: 105.95, 104.98
Resistance Levels: 106.93, 107.54
Stop Loss (SL): 107.54 (above resistance zone)
Take Profit (TP): 104.98 (major support)
Summary: Bias and Watchpoints
CADJPY bias is bearish, with SL set at 107.54 and TP aimed at 104.98. Oil weakness, dovish BoC expectations, and resilient JPY flows all lean in favor of further downside. The key watchpoints are Canada’s CPI/retail sales and BoJ commentary. Unless oil rebounds strongly, sellers are likely to stay in control, with price action favoring a test of 105.95 and potentially 104.98.

Will Japanese Yen get stronger?CAD/JPY - The performance of the pair the last week is -2.53% last month -3.60% and the last three months -5.12%. 12.2.2025 - 13.2.2025 price hit at SMA 30 CLOSE and fall more than 3% in range. On Friday 21.2.2025 price close bellow our last demand zone. We can expect Japanese Yen get stronger the next days and price fall to the demand zone of 13.9.2024 - 18.9.2024 and even lower at the lowest of 5.8.2024

CADJPY Take it or Leave itCADJPY - This week 16 - 21/03/2025 both players has high impact news . Yen is stronger and we want to follow the trend if the news will give us the change. Very interesting pair to watch this week.

CADJPY BUY - Take it or Leave itThe price break the bearish trend line it is already react on the last supply zone. It is possible to see the price climb on the strong supply zone of 8 - 12/8/2025.

CADJPYLong Calll
D. Bottom Structure Bouncig from support
Bullish .DIV
Manage risk Book profits timely

CADJPYThis is my opinion for today! I think there’s a high chance, as two FVGs have already formed on the H1
exit point 106.748

CAD/JPY BEARS ARE STRONG HERE|SHORT
Hello, Friends!
CAD/JPY is making a bullish rebound on the 12H TF and is nearing the resistance line above while we are generally bearish biased on the pair due to our previous 1W candle analysis, thus making a trend-following short a good option for us with the target being the 106.590 level.
Disclosure: I am part of Trade Nation's Influencer program and receive a monthly fee for using their TradingView charts in my analysis.
✅LIKE AND COMMENT MY IDEAS✅


CADJPY Short
Entry 106.712
SL 106.904
TP 106.422
This asset is currently overvalued against Gold. I expect a drop I price soon.

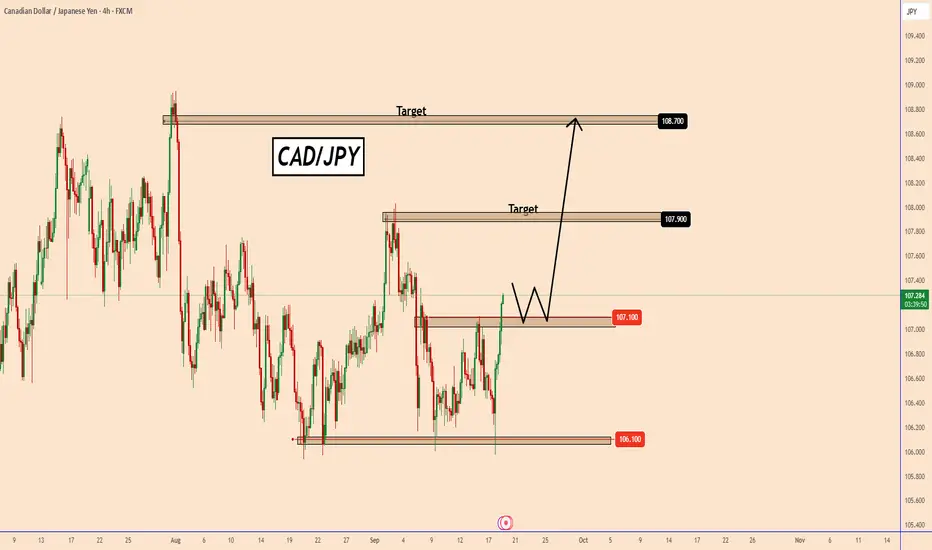
CADJPY: Simple Trading IdeaCADJPY: Simple Trading Idea
Price is currently moving up and just broke through a strong support zone near 107.10
A possible pullback may happen near 107.10, where the price might form a bullish continuation pattern.
CADJPY could continue toward the first target at 107.90 and then toward the second target at 108.71.
Key Levels:
Support Zone: Around 107.10
First Target: 107.92
Second Target: 108.71
You may find more details in the chart!
Thank you and Good Luck!
❤️PS: Please support with a like or comment if you find this analysis useful for your trading day❤️
CADJPY: Will Keep Falling! Here is Why:
Balance of buyers and sellers on the CADJPY pair, that is best felt when all the timeframes are analyzed properly is shifting in favor of the sellers, therefore is it only natural that we go short on the pair.
Disclosure: I am part of Trade Nation's Influencer program and receive a monthly fee for using their TradingView charts in my analysis.
❤️ Please, support our work with like & comment! ❤️

CADJPY--SHORT--Bearish bias
--second leg down of head and shoulder
--tp and entry levels are as shown on chart


CADJPYthe price respected it and formed sweep then choch and engulfing candle
which indicate uptrend wave
Exit point is 107.340

CADJPY Will Grow! Long!
Please, check our technical outlook for CADJPY.
Time Frame: 12h
Current Trend: Bullish
Sentiment: Oversold (based on 7-period RSI)
Forecast: Bullish
The market is approaching a significant support area 106.659.
The underlined horizontal cluster clearly indicates a highly probable bullish movement with target 107.622 level.
P.S
We determine oversold/overbought condition with RSI indicator.
When it drops below 30 - the market is considered to be oversold.
When it bounces above 70 - the market is considered to be overbought.
Disclosure: I am part of Trade Nation's Influencer program and receive a monthly fee for using their TradingView charts in my analysis.
Like and subscribe and comment my ideas if you enjoy them!

CAD/JPY bullishApologies for the short description. CAD/JPY appears to show signs of a bullish trend.

CADJPY-bias long Bullish indications:
Bullish divergence in 5 min
IHS formation in 5 min
trend line resistance broken
Bullish wedge formation.
Fib level 0.618 from 106.310
Inverted hammer candle in daily
Hammer candle in 1 hr .
Major support respected.
Trade plan bias long @ 106.592
SL:106.489
TP1:106.711
TP2:106.813

CADJPY: Forecast & Trading Plan
The recent price action on the CADJPY pair was keeping me on the fence, however, my bias is slowly but surely changing into the bearish one and I think we will see the price go down.
Disclosure: I am part of Trade Nation's Influencer program and receive a monthly fee for using their TradingView charts in my analysis.
❤️ Please, support our work with like & comment! ❤️

retail trading strategies **review**Intro :
Over the past two decades retail forex traders have gathered around a handful of trading methods, some taught by personalities, other emerging from various trading online communities. These strategies range from rules-based technical systems to conceptual frameworks and mostly try to explain large institutional behavior. Most of these strategies are the ones that i have come across in my trading journey.
What this is not : a promise of riches, holy grail system, It's a technical and practical review so you can evaluate, backtest, and adapt.
1) Beat the Market Maker — Steve Mauro
(i) Overview: Popularized by Steve Mauro, this approach claims that major institutions (market makers) manipulate retail orderflow to generate liquidity. The method focuses on identifying accumulation/distribution phases and the ensuing directional move.
Core ideas & rules:
Identify periods of consolidation where "market makers" are believed to be accumulating.
Look for shakeouts (false-breaks) designed to hit stop clusters, then trade the ensuing impulse move.
Use support/resistance, liquidity pools (highs/lows), and structure breaks as confirmation.
Key tools: structure (swing highs/lows), volume spikes (if using a data feed that shows volume), and range breakout fails.
Strengths: Provides a narrative for why false breakouts occur and where liquidity sits.
2) ICT (Inner Circle Trader) Concepts — Michael Huddleston
Overview: ICT is a comprehensive set of market concepts and tactics covering market structure, institutional orderflow, liquidity, and time-of-day edges (e.g., London Open, New York Open). It mixes SMC ideas with very specific rules (split tests, fair value gaps, breaker blocks). It also important to know it's always evolving.
Core elements:
Market structure shifts (MSH/MSL)
Fair Value Gaps (FVG) — price imbalances to be filled
Order blocks — candles/areas where institutions allegedly placed big orders
Optimal trade entry (OTE) using Fibonacci retracements, often 61.8–79%
Time-based edges and correlation analysis
Strengths: Detailed playbook with clear confluence rules — useful for disciplined traders.
3) Smart Money Concepts (SMC)
Overview: SMC is an umbrella term (overlapping heavily with ICT) used to describe approaches that try to model institutional behaviour: liquidity grabs, order blocks, fair value gaps, and structure breaks.
Typical rules:
Wait for liquidity sweeps (wick hunts) that break obvious swing highs/lows.
Identify the return to an order block or imbalance as a high-probability entry.
Only take trades in the direction of higher timeframe structure.
Strengths: Emphasizes risk management and trading with institutional flow.
4) Supply and Demand Trading ( my personal favorite)
Overview: Basically this is the imbalance between buyers and sellers, the greater the imbalance, the greater the move. A widely used retail approach that focuses on identifying institutional footprints. The idea is that price tends to revisit these levels because unfilled orders remain.
Core ideas:
Supply zones: areas where heavy selling originated, typically sharp moves away from consolidation.
Demand zones: areas where aggressive buying originated.
Trade the first return to these zones with stop-loss beyond the zone, with the entry being the proximal price and stop loss just a few pips from the distal price.
Strengths: Provides clear areas of interest for entries/exits, often aligning with institutional footprints.
5) Price Action (Naked Trading) & Candlestick Patterns
Overview: Pure price action traders use raw price and candle formations (pin bars, inside bars, engulfing patterns) rather than indicators.
Core ideas:
Read support/resistance structure
Use rejected wicks/pin bars as entry signals
Combine with orderflow context (higher timeframe structure)
Strengths: Lightweight, transferable across markets, robust if rules are clear.
6) Wyckoff Method
Overview: A classic institutional-style framework (dating earlier than 20 years but widely revived) focusing on accumulation, markup, distribution, and markdown phases.
Core ideas:
Identify phases (A–E) and spring/spring failures
Volume and price structure show the footprints of large operators
Strengths: Provides a stage-based map of market cycles; excellent for swing traders.
7) Order Flow / Volume Profile (Footprint-style thinking)
Overview: Order-flow traders analyze where traded volume clusters and how price reacts to those clusters. In spot forex, exact volume data is limited, traders use tick volume or correlated markets.
Core ideas:
Volume Profile shows value areas, POC (point of control), and high-volume nodes
Rejections from value areas often lead to directional moves
Strengths: Gives a textured read of where supply/demand imbalance exists.
8) Trend-following & Moving Average Systems
Overview: Simple, time-tested approach using moving averages, breakouts, and momentum to ride sustained trends.
Core ideas:
EMA crossovers (e.g., 8/21/55) or price above/below a long MA
Use ADX or RSI to confirm trend strength
Strengths: Low subjectivity, easy to automate, works well in trending markets.
9) Grid & Martingale (Controversial retail staples)
Overview: Grid and martingale methods place multiple orders at fixed intervals or double down after losses.
Core ideas:
Grid: place buy/sell orders at intervals to capture mean reversion.
Martingale: increase position size after losses to recover.
Strengths: Can generate small, steady returns in low-volatility ranges.
10) Fibonacci & Harmonic Trading
Overview: Fibonacci retracement/extension levels and harmonic patterns (Gartley, Bat, Butterfly) are price geometry approaches used for precision entries.
Core ideas:
Use Fibonacci retracement for pullback entries (38.2 / 50 / 61.8)
Harmonic patterns require precise ratios to qualify, the same fib levels.
Strengths: Clear entry/target geometry; widely taught, backed by math gods (hahaha)
nerdy advice:
Backtest before you believe. Use TradingView’s strategy tester or export historical bars for offline testing.
Define objective rules. Ambiguity kills consistency; translate concepts (e.g., "order block" or "demand zone") into a reproducible rule set.
Risk management is king. Use fixed fractional sizing, stop-loss placement based on structure, and stress-test for tail events.
Simplicity beats complexity. Too many overlapping rules reduce clarity and make optimization fragile.
Document setups. Save your @TradingView ideas with full annotation so you can later audit winners and losers.
put together by : Pako Phutietsile as @currencynerd
*** i also like supply and demand because most these strategies use supply and demand but under different titles, for example an ict trader calls supply and deand CP,s order blocks..

CADJPY Rejection at Key Supply Zone – Bearish Move Ahead?Hello Traders! 👋
CADJPY is showing signs of weakness after testing the 107.478 – 108.504 supply zone. Price broke below the ascending trendline and is now retesting it as resistance. If this rejection holds, we could see strong bearish momentum pushing price toward the 104.644 support zone.
🔑 Key Levels to Watch:
Resistance Zone: 107.478 – 108.504
Current Price: 106.85
Next Bearish Target: 104.644
⚡ Bias: Bearish if rejection holds below 107.478. A clean close above 108.504 would invalidate this setup.
📌 Technical Confluence:
Trendline break ✅
Supply zone retest ✅
Lower highs forming ✅
What do you think? Will CADJPY respect this supply zone and drop, or will the bulls reclaim control?
💬 Drop your thoughts below & let’s discuss!
👍 Don’t forget to like, share, and follow for more setups. ❤️

CAD/JPYafter nfp we see a big breakout for a bearish mode, lets have some little retracement on 15 tm and go for sell till to our support, GL...
