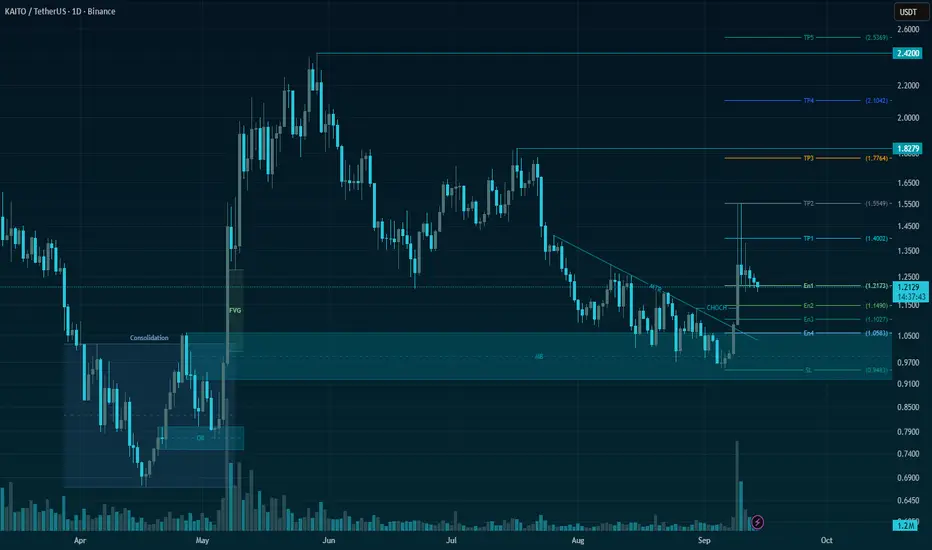
KAITO/USDT | Low-Risk Setup with 125%+ Upside Potential🚀 Trade Setup Details:
🕯 #KAITO/USDT 🔼 Buy | Long 🔼
⌛️ TimeFrame: 1D
--------------------
🛡 Risk Management (Example):
🛡 Based on $10,000 Balance
🛡 Loss-Limit: 1% (Conservative)
🛡 The Signal Margin: $634.52
--------------------
☄️ En1: 1.2173 (Amount: $63.45)
☄️ En2: 1.149 (Amount: $222.08)
☄️ En3
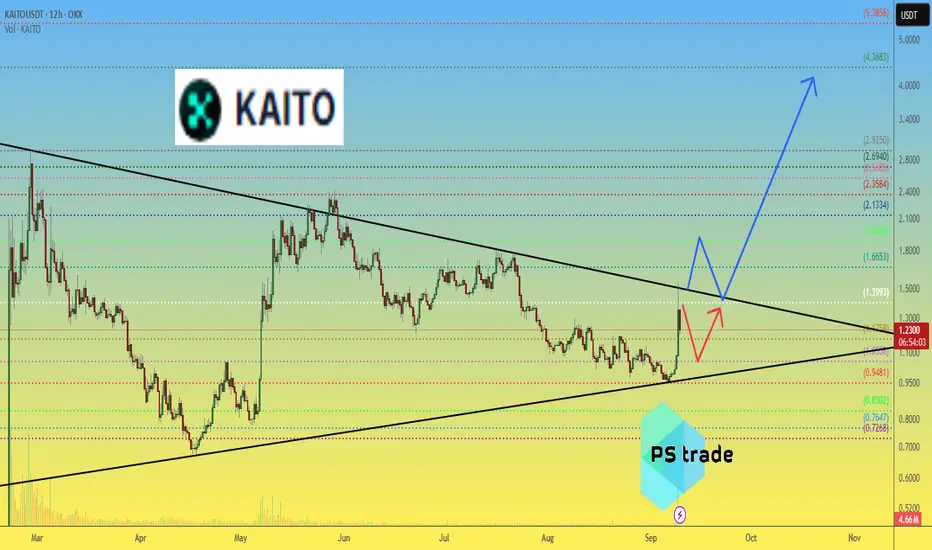
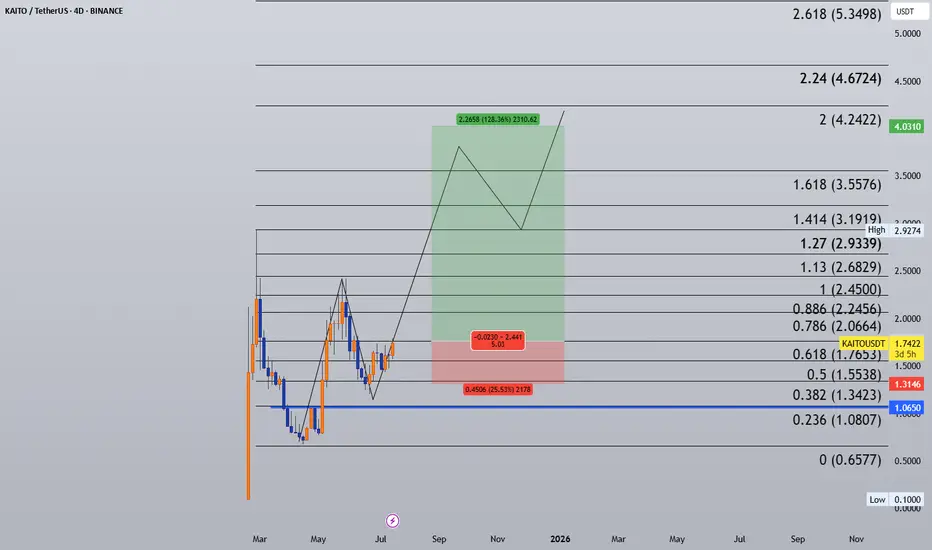
KAITO price analysis📊 The chart of OKX:KAITOUSDT suggests consolidation is coming to an end.
Historically, such phases often precede a strong breakout move 🚀
Key question for traders:
▪️ Would you take profits at ❤ $2 🔥 $3 👍 $5 or hold for a much higher target?
Your insights matter — share your view in the comment
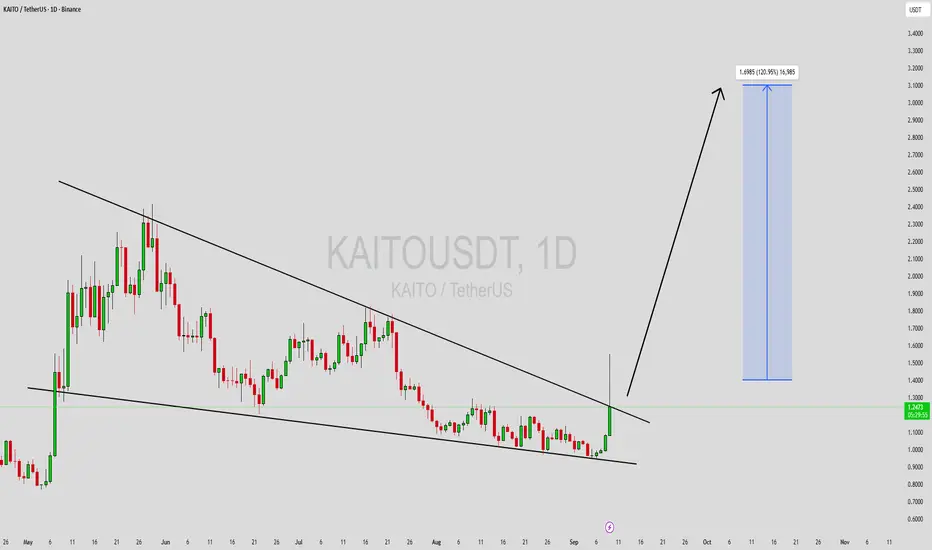
KAITOUSDT Forming Falling WedgeKAITOUSDT is currently forming a falling wedge pattern, which is widely recognized as a bullish reversal signal in technical analysis. The narrowing range of price action reflects declining selling pressure, while strong buying interest is gradually emerging. With trading volume showing healthy acti
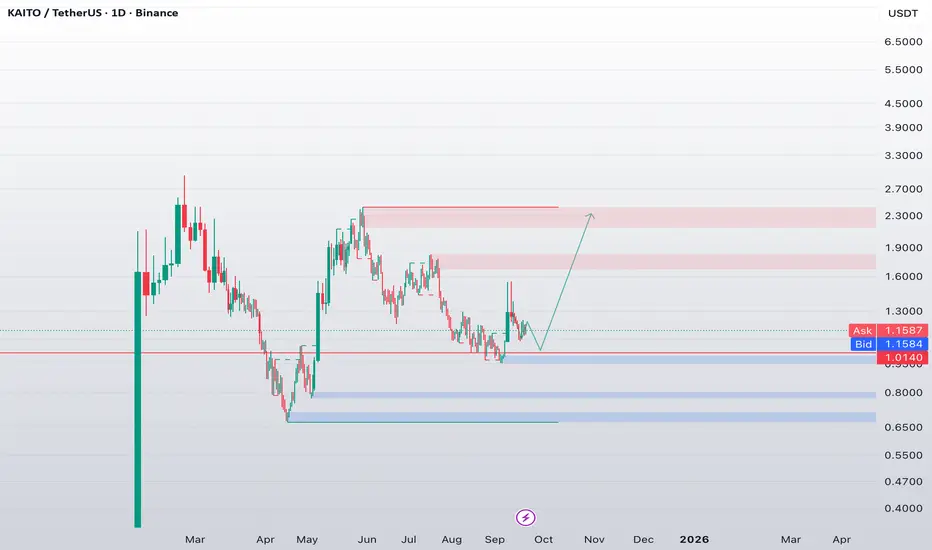
KAITO/USDT – Strong Structure + Community Trend LeaderKAITO continues to form a clean and technically sound structure. After a solid rebound from the ~$0.70 zone and several successful retests, we might be witnessing the beginning of a larger accumulation-to-expansion phase.
🔍 Technical Highlights:
Price is holding above the key support zone ($1.00–$1
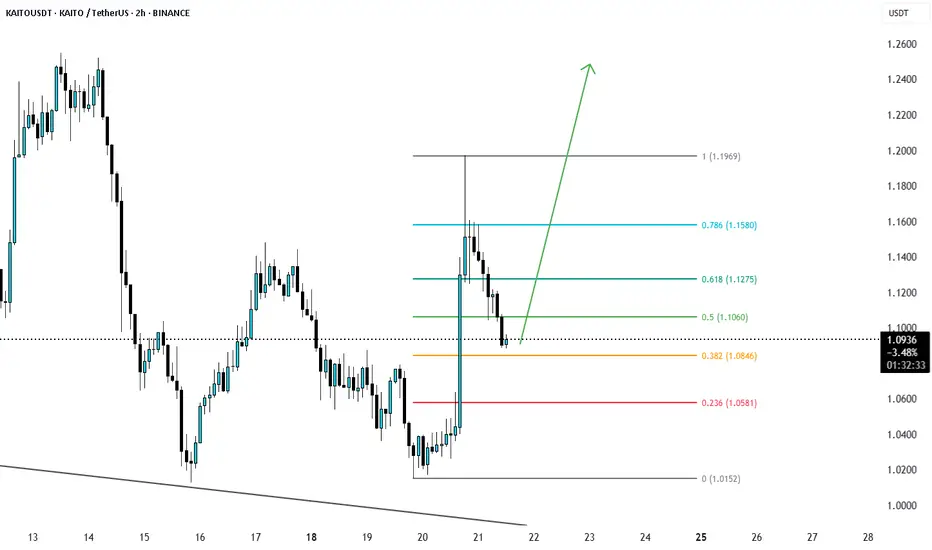
KAITOUSD Eyes Continuation Toward $1.26 After Fib RetestKAITOUSD recently enjoyed a strong bullish run before entering a period of consolidation. The price has now reached the 0.385 Fibonacci retracement level, a key support zone often watched for bullish continuation.
If buyers defend this Fib level, the price may soon resume its upward momentum, with
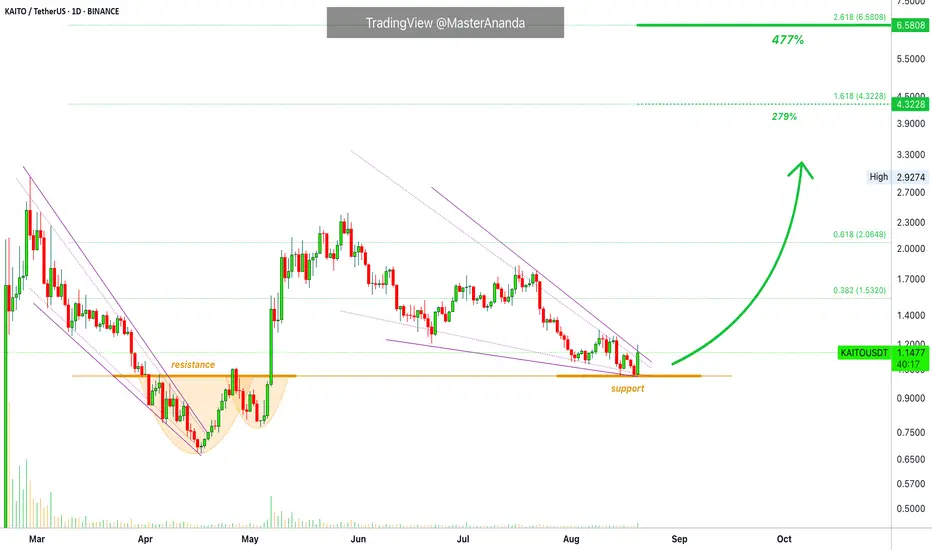
Kaito Technical Analysis & 477% Higher High TargetThe previous cup and handle reversal pattern neckline, resistance, is now working as support producing a higher low for KAITOUSDT.
Will the current move end as a higher low or is KAITO set to move lower?
To answer this question we can look at the volume indicator. Notice how trading volume has bee
KAITO/USDT: High-Reward Long Setup from BIG BANG THEORYFirstly, our Algo-based indicators are used to create this analysis. Follow me so you don't miss, Boost and leave your comments if you profited with our posts, so we may continue:
This 9-hour chart for KAITO/USDT highlights a compelling long trade setup originating from a critical support level
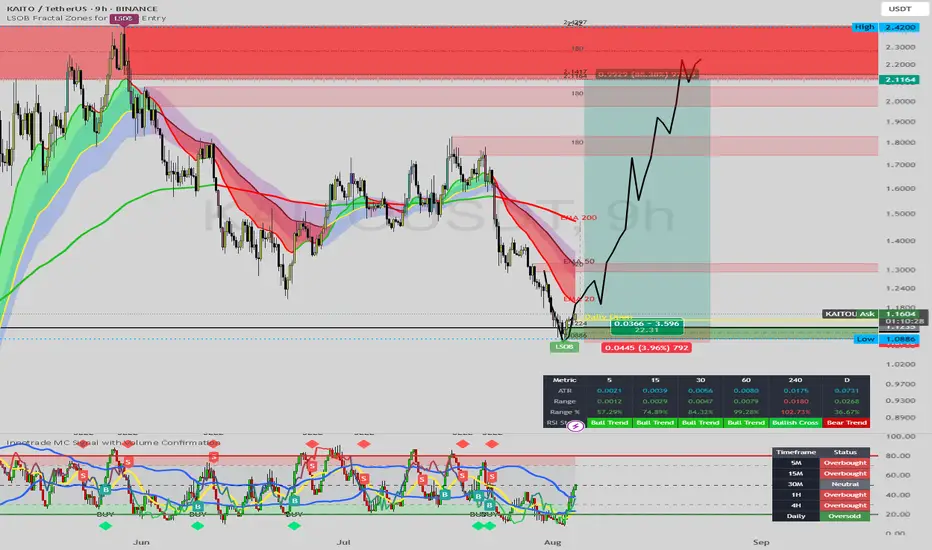
#KAITOUSDT Trade Setup
📌 Coin: KAITO (Kaito AI)
💰 Buy Levels:
✅ Accumulation Zone: $1.6178 – $1.7490
🧠 Fundamental Analysis (FA) – In Short
*️⃣ Sector: Artificial Intelligence / Web3 Search Engine
*️⃣ Use Case: Kaito is building an AI-powered search engine for Web3 data, aiming to index blockchain content (tweets, rese
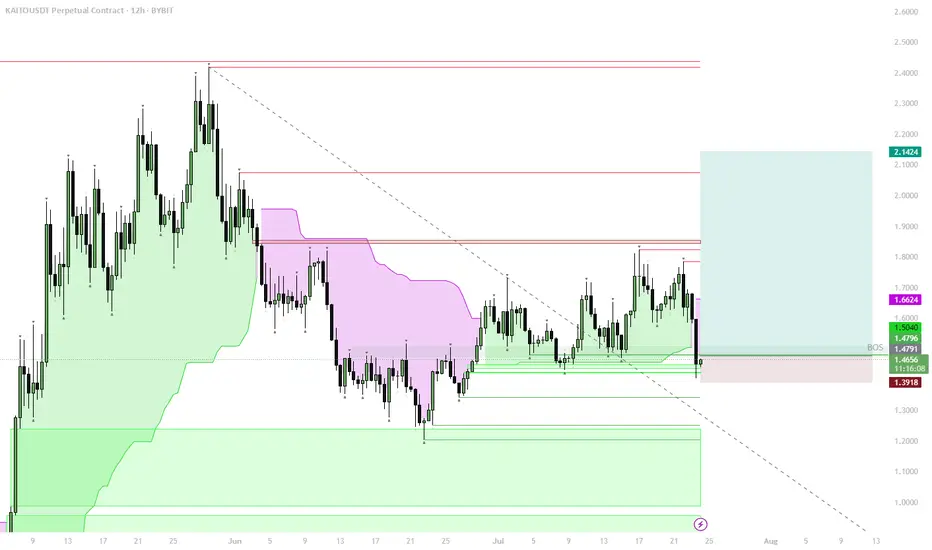
KAITO – Structural Flip, Bullish Accumulation ZoneStructural Shift:
Price reclaimed the key 1D S/R + BOS (Break of Structure) level, signaling a major trend change from bearish to bullish.
Trend Confirmation:
The move above $1.48–$1.50 zone confirms a bullish market structure. This level is now strong support.
Accumulation Opportunity:
The area b
#Kaito Yapping for kaito here. Daily TF looks alright, if we start pushing hard here we might push for more!!!
On weekly it's trading inside a ascending triangle & with the way market is have feeling we might push up BUT risking only 3% here ;)

See all ideas
Summarizing what the indicators are suggesting.
Oscillators
Neutral
SellBuy
Strong sellStrong buy
Strong sellSellNeutralBuyStrong buy
Oscillators
Neutral
SellBuy
Strong sellStrong buy
Strong sellSellNeutralBuyStrong buy
Summary
Neutral
SellBuy
Strong sellStrong buy
Strong sellSellNeutralBuyStrong buy
Summary
Neutral
SellBuy
Strong sellStrong buy
Strong sellSellNeutralBuyStrong buy
Summary
Neutral
SellBuy
Strong sellStrong buy
Strong sellSellNeutralBuyStrong buy
Moving Averages
Neutral
SellBuy
Strong sellStrong buy
Strong sellSellNeutralBuyStrong buy
Moving Averages
Neutral
SellBuy
Strong sellStrong buy
Strong sellSellNeutralBuyStrong buy