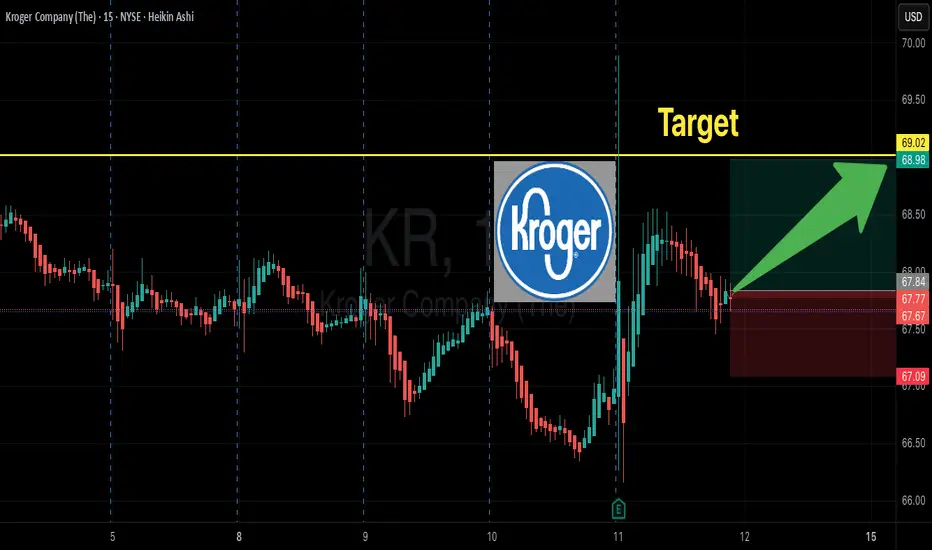
KR LongDemand Zone
Long entry 61.5
Stop 60
Target 70, 74
Risk management is much more important than a good entry point.
I am not a PRO trader.
In my trading plan, the Max Risk of each short term trade should be less than 1% of an account.
Kroger Co.
No trades
Next report date
—
Report period
—
EPS estimate
—
Revenue estimate
—
1.2 USD
2.65 B USD
147.12 B USD
627.10 M
About Kroger Company (The)
Sector
Industry
CEO
Ronald L. Sargent
Website
Headquarters
Cincinnati
Founded
1883
IPO date
Jan 26, 1928
Identifiers
3
ISIN US5010441013
The Kroger Co. engages in the retail grocery business with added convenience to retail pharmacies and fuel centers. Its main focus is on growing households and increasing customer loyalty by delivering great value and convenience, and investing in four strategic pillars: Fresh, Brands, Data & Personalization and Seamless. Its brands include Big K, Smart Way, Heritage Farm, Simple Truth, and Simple Truth Organic. The company was founded by Barney Kroger in 1883 and is headquartered in Cincinnati, OH.
Related stocks

KR eyes on $62: Major Support zone could mark a/the BOTTOMKR got a significant dip upon last earnings report.
Trying to hold major support zone at $61.84-62.16
Long entries here with stop loss just below the zone.

Kroger May Be CrumblingKroger hasn’t made a new high since August, and some traders may think the grocery chain is starting a downtrend.
The first pattern on today’s chart is the September 11 candle after quarterly results. KR tried to rally but couldn’t hold the gains. Two weeks ago, it stalled near that session’s high

KR price is showing signs of strength; now it just needs volumeKroger (KR) has moved into an uptrend on the daily chart, forming a higher trough followed by a higher peak. Upside momentum is improving, confirmed by a break of the downsloping trendline, while the RSI has risen above 50 — a positive sign for near-term strength.
The longer RSI holds above 50, the

$KR Retest shows great trade entryWith great news surrounding NYSE:KR with the rise of dividends, Kroger and DoorDash announced a major expansion of their partnership to offer nationwide grocery delivery from nearly 2,700 Kroger stores, providing customers access to the full grocery assortment, including deals and loyalty program

KR Earnings Jackpot: 68C Could Explode Post-Print”
🚀 **KR Earnings Play: \$68 Calls Loaded!**
📅 **Expiry:** 2025-09-12 (Weekly)
💵 **Entry:** \$0.70 (Ask)
🎯 **Profit Target:** \$2.10 → 300%+ potential
🛑 **Stop Loss:** \$0.35 → risk \$70 per contract
📈 **Confidence:** 74% (Moderate Bullish)
⏰ **Entry Timing:** Pre-earnings close (2025-09-11)
💡 **Set
Kroger have returned to the upside The Kroger NYSE:KR uptrend has remained intact, and the recent brief break above the 73.73 resistance level has confirmed the corrective downtrend channel (Bullish flag), which indicates potential bullish continuation.
Long-term MACD remains flat but is looking to wake up soon. Stochastic Oscill

Kroger to Retest High back to $74 IF 2nd Entry Long is Confirmed
KR is showing a solid pullback to the 21Day key Entry point on a daily timeframe which is prime for a quick scalp while also offering a 2-1 Risk vs Reward ratio.
The previous week is showcasing a bull flag and has ended on a very bullish candle. NYSE:KR
If Monday's candle ticks higher than t

Kroger Company (The) (KR) Grows Grocery Market ShareKroger Company (The) (KR) is one of the largest grocery retailers in the U.S., operating supermarkets, multi-department stores, and online grocery services. Known for its strong private label brands and fresh food offerings, Kroger meets everyday shopping needs for millions. The company’s growth is

Pendulum pick for KR - short tgt 44I have many tens of thousands of dollars worth of home renovations to do, so why not ask my dowsing/spirit team to help find me a stock that can help PAY for these expenses and then some?
I'm a dowser, btw, so all my ideas & levels come from this form of information gathering. So woo woo ;)
The pic

See all ideas
Summarizing what the indicators are suggesting.
Neutral
SellBuy
Strong sellStrong buy
Strong sellSellNeutralBuyStrong buy
Neutral
SellBuy
Strong sellStrong buy
Strong sellSellNeutralBuyStrong buy
Neutral
SellBuy
Strong sellStrong buy
Strong sellSellNeutralBuyStrong buy
An aggregate view of professional's ratings.
Neutral
SellBuy
Strong sellStrong buy
Strong sellSellNeutralBuyStrong buy
Neutral
SellBuy
Strong sellStrong buy
Strong sellSellNeutralBuyStrong buy
Neutral
SellBuy
Strong sellStrong buy
Strong sellSellNeutralBuyStrong buy
Displays a symbol's price movements over previous years to identify recurring trends.
KR5877308
Kroger Co. 5.65% 15-SEP-2064Yield to maturity
5.94%
Maturity date
Sep 15, 2064
KR5877307
Kroger Co. 5.5% 15-SEP-2054Yield to maturity
5.81%
Maturity date
Sep 15, 2054
US501044DM0
Kroger Co. 5.4% 15-JAN-2049Yield to maturity
5.77%
Maturity date
Jan 15, 2049
US501044DG3
Kroger Co. 4.45% 01-FEB-2047Yield to maturity
5.76%
Maturity date
Feb 1, 2047
KOGE
Kroger Co. 4.65% 15-JAN-2048Yield to maturity
5.75%
Maturity date
Jan 15, 2048
KR4933101
Kroger Co. 3.95% 15-JAN-2050Yield to maturity
5.74%
Maturity date
Jan 15, 2050
KOGJ
Kroger Co. 3.875% 15-OCT-2046Yield to maturity
5.74%
Maturity date
Oct 15, 2046
KR4030994
Kroger Co. 5.15% 01-AUG-2043Yield to maturity
5.65%
Maturity date
Aug 1, 2043
KR3842776
Kroger Co. 5.0% 15-APR-2042Yield to maturity
5.58%
Maturity date
Apr 15, 2042
KR.TB
Kroger Co. 5.4% 15-JUL-2040Yield to maturity
5.35%
Maturity date
Jul 15, 2040
KR.SX
Kroger Co. 6.9% 15-APR-2038Yield to maturity
5.27%
Maturity date
Apr 15, 2038
See all 0JS2 bonds
Frequently Asked Questions
The current price of 0JS2 is 65.8 USD — it has decreased by −2.13% in the past 24 hours. Watch Kroger Co. stock price performance more closely on the chart.
Depending on the exchange, the stock ticker may vary. For instance, on LSE exchange Kroger Co. stocks are traded under the ticker 0JS2.
0JS2 stock has risen by 6.08% compared to the previous week, the month change is a 6.56% rise, over the last year Kroger Co. has showed a 1.22% increase.
We've gathered analysts' opinions on Kroger Co. future price: according to them, 0JS2 price has a max estimate of 85.00 USD and a min estimate of 52.00 USD. Watch 0JS2 chart and read a more detailed Kroger Co. stock forecast: see what analysts think of Kroger Co. and suggest that you do with its stocks.
0JS2 reached its all-time high on Aug 11, 2025 with the price of 74.8 USD, and its all-time low was 21.4 USD and was reached on Jul 29, 2019. View more price dynamics on 0JS2 chart.
See other stocks reaching their highest and lowest prices.
See other stocks reaching their highest and lowest prices.
0JS2 stock is 2.89% volatile and has beta coefficient of −0.22. Track Kroger Co. stock price on the chart and check out the list of the most volatile stocks — is Kroger Co. there?
Today Kroger Co. has the market capitalization of 42.27 B, it has decreased by −1.32% over the last week.
Yes, you can track Kroger Co. financials in yearly and quarterly reports right on TradingView.
Kroger Co. is going to release the next earnings report on Mar 5, 2026. Keep track of upcoming events with our Earnings Calendar.
0JS2 earnings for the last quarter are 1.05 USD per share, whereas the estimation was 1.03 USD resulting in a 1.83% surprise. The estimated earnings for the next quarter are 1.20 USD per share. See more details about Kroger Co. earnings.
Kroger Co. revenue for the last quarter amounts to 33.86 B USD, despite the estimated figure of 34.19 B USD. In the next quarter, revenue is expected to reach 35.00 B USD.
0JS2 net income for the last quarter is −1.32 B USD, while the quarter before that showed 604.00 M USD of net income which accounts for −318.71% change. Track more Kroger Co. financial stats to get the full picture.
Yes, 0JS2 dividends are paid quarterly. The last dividend per share was 0.35 USD. As of today, Dividend Yield (TTM)% is 2.01%. Tracking Kroger Co. dividends might help you take more informed decisions.
Kroger Co. dividend yield was 2.03% in 2024, and payout ratio reached 34.03%. The year before the numbers were 2.45% and 38.18% correspondingly. See high-dividend stocks and find more opportunities for your portfolio.
As of Feb 6, 2026, the company has 409 K employees. See our rating of the largest employees — is Kroger Co. on this list?
EBITDA measures a company's operating performance, its growth signifies an improvement in the efficiency of a company. Kroger Co. EBITDA is 8.67 B USD, and current EBITDA margin is 5.77%. See more stats in Kroger Co. financial statements.
Like other stocks, 0JS2 shares are traded on stock exchanges, e.g. Nasdaq, Nyse, Euronext, and the easiest way to buy them is through an online stock broker. To do this, you need to open an account and follow a broker's procedures, then start trading. You can trade Kroger Co. stock right from TradingView charts — choose your broker and connect to your account.
Investing in stocks requires a comprehensive research: you should carefully study all the available data, e.g. company's financials, related news, and its technical analysis. So Kroger Co. technincal analysis shows the buy rating today, and its 1 week rating is buy. Since market conditions are prone to changes, it's worth looking a bit further into the future — according to the 1 month rating Kroger Co. stock shows the buy signal. See more of Kroger Co. technicals for a more comprehensive analysis.
If you're still not sure, try looking for inspiration in our curated watchlists.
If you're still not sure, try looking for inspiration in our curated watchlists.