Bullish correction in simon proA recent breaking channel has set this stock in a oversell scenario. The bullish pattern confirms the future upward movement.
0L6P trade ideas

Big Breakout Level On Watch For $SPGInvestors should be watching the price action on Simon Property Group Inc (NYSE:SPG). Any stock trading close above $188.25 triggers a dual trend line breakout. That is when investors should buy. Take a look at the stock chart below. Simon Property Group Inc has been chopping sideways for the last three months. Multiple times it has tested the $188.25 level, each time falling back down. The fact that this price point has been tested multiple times, signals that it is a major level. Once it breaks, there is significant upside to $200.00 within days, further after that.
View every trade I take right here: verifiedinvesting.com

Playing the RangeTrade not active yet. Just looking to see how we close today but will most likely take the trade into the close or tomorrow morning at the open.


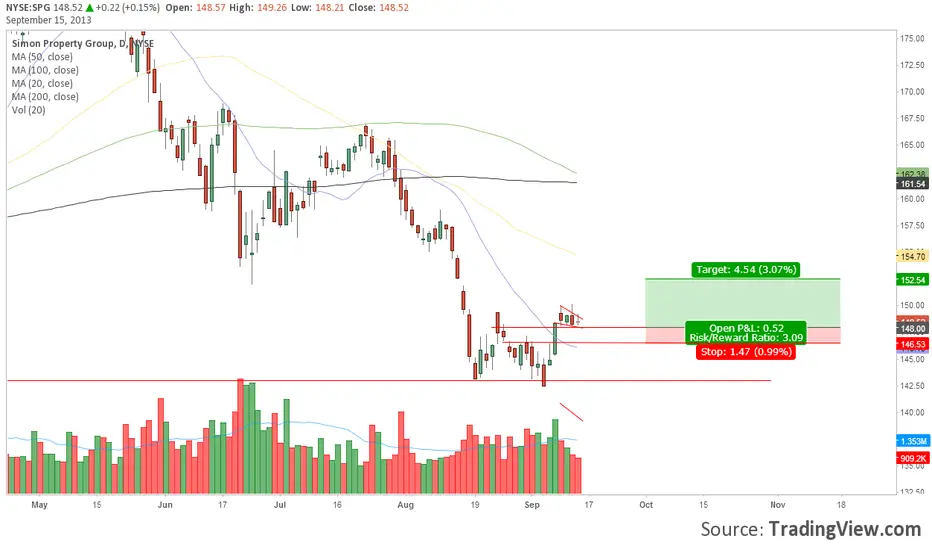
SPG- Possible second entry, looking for $180 April putsWe had a very good option trade with SPG & now it seems getting ready for another fall. It is breaking down from longer term upward channel & the target could be as low as 153
To trade this we would consider $180 April puts currently $11.85
You can check our detailed analysis on SPG in the trading room/ Executive summary link here-
www.youtube.com
Time Span: 5:45"
Trade Status: Pending

SPG - Short from current price to 182 SPG breaking down a upward channel & could not show upward strength recently. Also a lot of insider selling in the Retail REIT sector.
We think it will break down now & our target is $182
On the option side we are looking for Jan2017 $210 put which trading for $10
You can check our detailed analysis on SPG in the trading room/ Executive summary link here-
www.youtube.com
Time Span: 16:45"
Trade Status: Pending


SPGAB+CD should get price to the 3.82 area - see weekly chart. Then, we see if there's more downside in store.

SPG closes just above $200SPG caught my eye yesterday morning with 14th January's bullish bar on the breakout (and with higher volume). But it was trading below $200 so I passed it by.
However, during the day price traded just above $200 ($200.42) so there could be continued strength to the upside. This is supported by the cup and handle pattern which formed below the May 2013 pivot high. And the subsequent breakout retested this resistance-turned-support with a bullish flag and price continued higher.
As $200 can be a strong psychological resistance I would want another retest/pullback before considering a long position on this stock. With earnings due 30th January this may not take place with a enough time to benefit from the current move. But SPG can definitely go on the watchtlist.