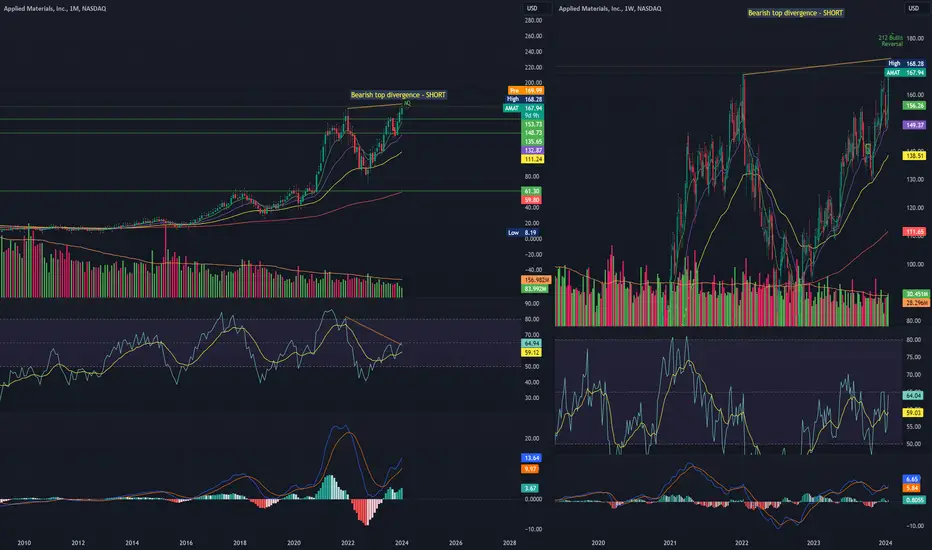
AMAT smooth slide from hereAMAT is in C-wave now.
Short anywhere here
Target #1 180
Target #2 170
Stop loss 207
Next report date
Report period
Q2 2024
EPS estimate
1.99USD
Revenue estimate
6.54 BUSD
8.55USD
6.86 BUSD
26.45 BUSD
827.82 M
About Applied Materials, Inc.
Sector
Industry
CEO
Gary E. Dickerson
Website
Headquarters
Santa Clara
Employees (FY)
34 K
Founded
1967
FIGI
BBG00QG0YD99
Applied Materials, Inc. provides manufacturing equipment, services and software to the semiconductor, display and related industries. It operates through the following segments: Semiconductor Systems, Applied Global Services, and Display & Adjacent Markets. The Semiconductor Systems segment includes semiconductor capital equipment for etch, rapid thermal processing, deposition, chemical mechanical planarization, metrology and inspection, wafer packaging, and ion implantation. The Applied Global Services segment provides solutions to optimize equipment, performance, and productivity. The Display & Adjacent Markets segment offers products for manufacturing liquid crystal displays, organic light-emitting diodes, equipment upgrades, and other display technologies for TVs, monitors, laptops, personal computers, smart phones, and other consumer-oriented devices. The company was founded on November 10, 1967 and is headquartered in Santa Clara, CA.

WILL AMAT CONTINUE ITS MARK UP?Trading range formed, im bias to Re-Accumulation
And, price contracting, seems supply drying up
Entry as attached
Pure Wyckoff

AMAT - BullishAMAT is ready to launch and move up to 226. My entry is here after it just broke the 213 resistance.
Good luck
Not financial advice

$AMAT: WORTH TO TAKE IT?AMAT can be interesting here, as well, only for those who wants to play a bit.
On the 4H: MM50 touched soon
On the D: MM20 touched
I would be shocked if we bounce a bit but could potentially continue to go down to touch the MM50 D in case of a bad macro

Waiting for these buy-zonesHoping to get a shot on these buy-zones.
Around 140 is my first fib retracement zone and will be my first entry when it gets there.
When it hits the second fib retracement zone at around 120 I will buy some more.
Will be a longterm hold, just want to get it at a good price.

Applied Materials Surges on Upbeat AI-Boosted ForecastApplied Materials Inc. (NASDAQ: NASDAQ:AMAT ) is emerging as a frontrunner, riding high on a wave of optimism following its recent forecast announcement. The company's shares surged an impressive 13% in premarket trading on Friday, fueled by a promising outlook fueled by robust demand for AI-enabled

AMAT rocketed out of earnings Short then LongAMAT on the 15 minute chart jumped 13 % from earnings and is now in the $212 range. The 0.5
fib level is 202.65. I have 3 call options striking $190 for July purchased only a day ago.
Trade plan. I will sell two calls and collect profit. I am buying a put option striking $204
expiring on 2/23

AMAT Ascending channel breakoutReasons for bullish bias:
- Price moving in ascending channel
- Entry is at 0.382 fib retracement
- Safe entry will be above 179.35(HH breakout)
- TP till projection
Entry Level(buy limit): 167.47
Stop Loss Level: 146.92
Take Profit Level 1: 188.02
Take Profit Level 2: 200.57

$AMAT Bull trap takes days to realise.NASDAQ:AMAT alerted a few days ago based on monthly time frame Vs RSI peaks divergence. Now coming through. Things are fluid so keep an eye.😁👍 Happy trading.

$AMAT bearish divergence NASDAQ:AMAT has a good run and looking extended with RSI and price showing divergent pattern. Bearish! SHORT!
See all ideas
Trade directly on the supercharts through our supported, fully-verified and user-reviewed brokers.


Curated watchlists where 0R1A is featured.


Frequently Asked Questions
The current price of 0R1A is 195.00 USD — it has increased by 0.12% in the past 24 hours. Watch APPLIED MATERIALS INC COM STK USD0.01 stock price performance more closely on the chart.
Depending on the exchange, the stock ticker may vary. For instance, on LSIN exchange APPLIED MATERIALS INC COM STK USD0.01 stocks are traded under the ticker 0R1A.
APPLIED MATERIALS INC COM STK USD0.01 is going to release the next earnings report on May 16, 2024. Keep track of upcoming events with our Earnings Calendar.
0R1A stock is 2.21% volatile and has beta coefficient of 1.66. Track APPLIED MATERIALS INC COM STK USD0.01 stock price on the chart and check out the list of the most volatile stocks — is APPLIED MATERIALS INC COM STK USD0.01 there?
0R1A earnings for the last quarter are 2.12 USD per share, whereas the estimation was 1.99 USD resulting in a 6.39% surprise. The estimated earnings for the next quarter are 1.90 USD per share. See more details about APPLIED MATERIALS INC COM STK USD0.01 earnings.
APPLIED MATERIALS INC COM STK USD0.01 revenue for the last quarter amounts to 6.72 B USD despite the estimated figure of 6.52 B USD. In the next quarter revenue is expected to reach 6.48 B USD.
Yes, you can track APPLIED MATERIALS INC COM STK USD0.01 financials in yearly and quarterly reports right on TradingView.
0R1A stock has risen by 0.05% compared to the previous week, the month change is a 5.33% fall, over the last year APPLIED MATERIALS INC COM STK USD0.01 has showed a 74.18% increase.
0R1A net income for the last quarter is 2.02 B USD, while the quarter before that showed 2.00 B USD of net income which accounts for 0.75% change. Track more APPLIED MATERIALS INC COM STK USD0.01 financial stats to get the full picture.
Today APPLIED MATERIALS INC COM STK USD0.01 has the market capitalization of 161.19 B, it has decreased by 9.56% over the last week.
Yes, 0R1A dividends are paid quarterly. The last dividend per share was 0.32 USD. As of today, Dividend Yield (TTM)% is 0.66%. Tracking APPLIED MATERIALS INC COM STK USD0.01 dividends might help you take more informed decisions.
APPLIED MATERIALS INC COM STK USD0.01 dividend yield was 0.93% in 2023, and payout ratio reached 15.04%. The year before the numbers were 1.14% and 13.71% correspondingly. See high-dividend stocks and find more opportunities for your portfolio.
Like other stocks, 0R1A shares are traded on stock exchanges, e.g. Nasdaq, Nyse, Euronext, and the easiest way to buy them is through an online stock broker. To do this, you need to open an account and follow a broker's procedures, then start trading. You can trade APPLIED MATERIALS INC COM STK USD0.01 stock right from TradingView charts — choose your broker and connect to your account.
0R1A reached its all-time high on Mar 21, 2024 with the price of 214.80 USD, and its all-time low was 21.85 USD and was reached on Nov 6, 2014. View more price dynamics on 0R1A chart.
See other stocks reaching their highest and lowest prices.
See other stocks reaching their highest and lowest prices.
As of May 2, 2024, the company has 34.00 K employees. See our rating of the largest employees — is APPLIED MATERIALS INC COM STK USD0.01 on this list?
Investing in stocks requires a comprehensive research: you should carefully study all the available data, e.g. company's financials, related news, and its technical analysis. So APPLIED MATERIALS INC COM STK USD0.01 technincal analysis shows the sell today, and its 1 week rating is buy. Since market conditions are prone to changes, it's worth looking a bit further into the future — according to the 1 month rating APPLIED MATERIALS INC COM STK USD0.01 stock shows the buy signal. See more of APPLIED MATERIALS INC COM STK USD0.01 technicals for a more comprehensive analysis.
If you're still not sure, try looking for inspiration in our curated watchlists.
If you're still not sure, try looking for inspiration in our curated watchlists.
We've gathered analysts' opinions on APPLIED MATERIALS INC COM STK USD0.01 future price: according to them, 0R1A price has a max estimate of 260.00 USD and a min estimate of 160.00 USD. Watch 0R1A chart and read a more detailed APPLIED MATERIALS INC COM STK USD0.01 stock forecast: see what analysts think of APPLIED MATERIALS INC COM STK USD0.01 and suggest that you do with its stocks.
EBITDA measures a company's operating performance, its growth signifies an improvement in the efficiency of a company. APPLIED MATERIALS INC COM STK USD0.01 EBITDA is 8.12 B USD, and current EBITDA margin is 30.61%. See more stats in APPLIED MATERIALS INC COM STK USD0.01 financial statements.