Corn Futures in Dollars
No trades
Market insights

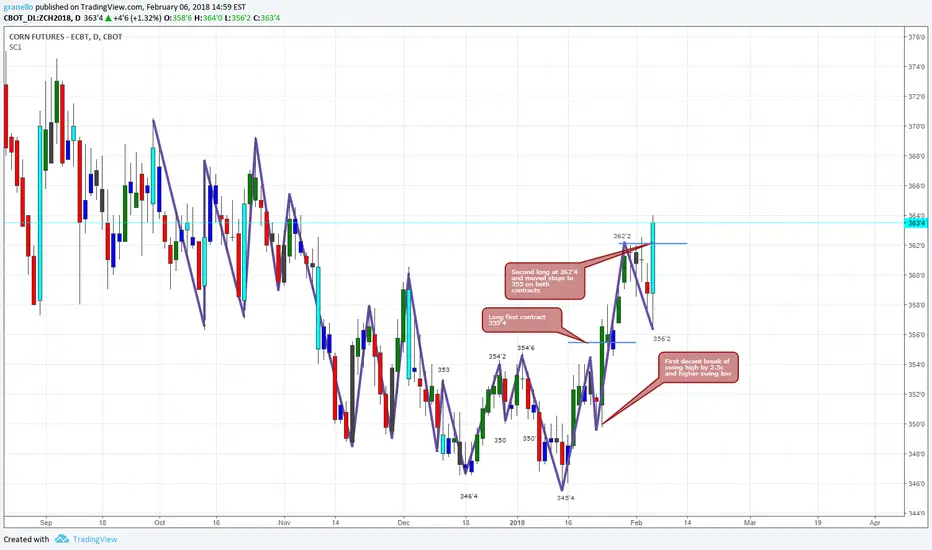
Finally movement in CornFirst time we have broken a swing high since this contract went active, crossed 354'6 by 2.5c. We crossed by 2.5c back in December but back then the December contract was active.

Corn H&S ChannelMarch Corn head and shoulders setup to bottom of channel and possibly beyond to S3 at 338'6.

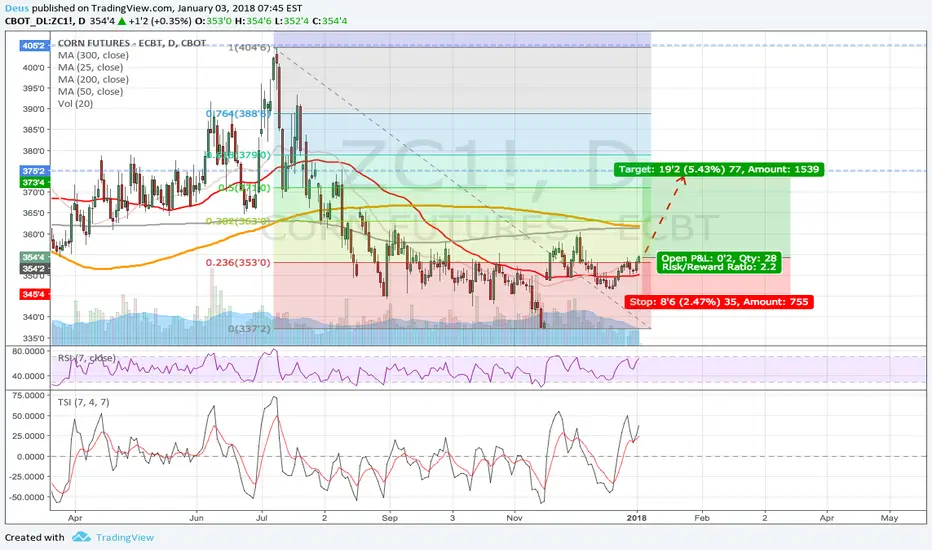
ZC : Tentatively bullish- Technical: in a range between 340 - 360, in the middle of the BB
-CoT: Commercial reduced there Longs a bit, thus fabvouring rising prices
- seasonal trend: neutral until February, than March rally
- Fundamental: high demand, but also ample suppy. This will favour the range for the next month
Summary: will wait for USDA report on Friday.
Then probably will sell OTM Puts on May Corn, at around 330.

Corn and other Soft Grains look Bullish 2018 $ZC_F interest rates going higher, enjoy the pull of inflation for your grains, that and colder weather forecast forget global warming, how about the cooling that is reality?

Corn bounced off 1x2 angleFriday we saw corn bounce off the 1x2 angle and should head towards the 1x1 angle for a sell opportunity.


Swing trading cornCorn has done 200% of last daily rally and you have been watching your monthly instead of useless short time frame charts then you would realise this was a buy weeks ago, just needed confirmation.

BUY July 2018 CornThis is an opportunity to BUY July 2018 Corn Futures for those who are trading Futures. BUY @ 365.00. See the analysis for the profit targets. SL must be below 360.00.

LArgest 4 or less traders in corn by GROSS Positions Please review CME group commitement of trader's report (4 or less largest)
As of Date: 7/3/2017Total OI: 1,753,868
Long - Short
156,094 --- 175,387
As of Date: 7/11/2017Total OI: 1,840,817
Long - Short
167,514 --- 213,535
As of Date: 8/22/2017Total OI: 1,874,724
Long - Short
185,598 --- 243,714
As of Date: 8/29/2017Total OI: 1,707,700
Long - Short
158,816 --- 203,216
Asset Active months March (H); May (K); July (N); Sep (U); Dec (Z)
CORN ZC
Open Interest :
Highest 2,080,000 contracts Average: 1,775,000 contracts
Lowest 1,470,000 contracts
Asset managers OI Date OI on date Percent of OI Ave. OI net
Most Bulish net OI 342,893 21/08/2012 2,073,500 16.54 1.48
Most bearish net OI (229,176) 8/3/2016 1,687,116 -13.58 Previous Change
current (64,945) 29/08/2017 1,707,700 -3.80 -0.91 -2.89
Producers OI Date OI on date Percent of OI Ave. OI net
Most Bulish net OI (13,396) 5/11/2013 1,941,041 -0.69 -13.65
Most bearish net OI (555,715) 14/06/2016 2,088,225 -26.61 Previous Change
current (231,883) 29/08/2017 1,707,700 -13.58 -13.72 0.14
Swap dealers/ deal OI Date OI on date Percent of OI Ave. OI net
Most Bulish net OI 305,017 7/10/2014 1,893,351 16.11 13.18
Most bearish net OI 197,349 13/06/2017 1,923,781 10.26 Previous Change
current 234,747 29/08/2017 1,707,700 13.75 12.11 1.64
Other reportables OI Date OI on date Percent of OI Ave. OI net
Most Bulish net OI 134,212 8/11/2016 1,751,431 7.66 4.40
Most bearish net OI 21,663 17/07/2012 1,916,920 1.13 Previous Change
current 63,374 29/08/2017 1,707,700 3.71 3.01 0.70


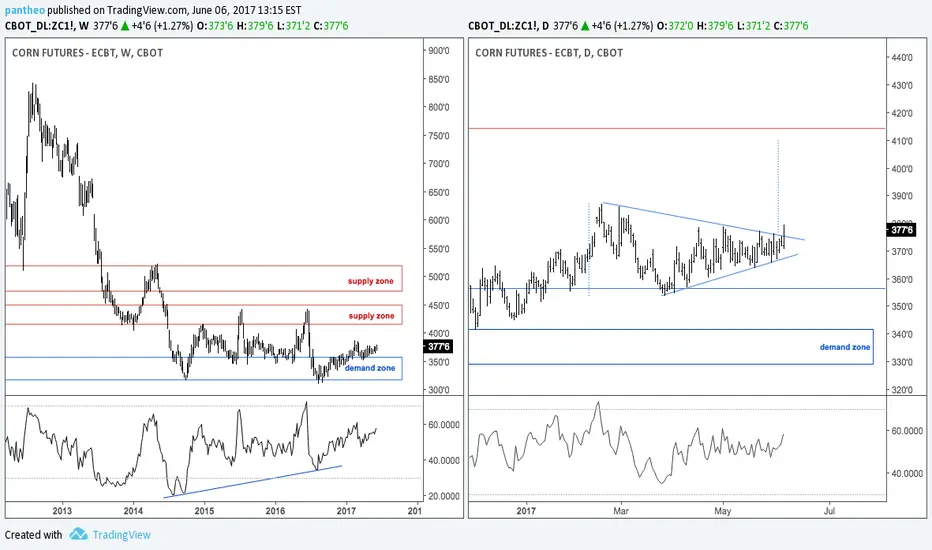
Deep pull back to complete a flat?Great Bullish potential on Weekly Chart, but the short term structure not very bullish, looks like an expanded flat could be underway

corn might ended 1500 days of downtrend from 2012. it can be hugcorn might ended 1500 days of downtrend from 2012. it can be hug


Still in middle of neutral range, but...... we must watch it closely, as Wheat price action may lift other major agri products as well.
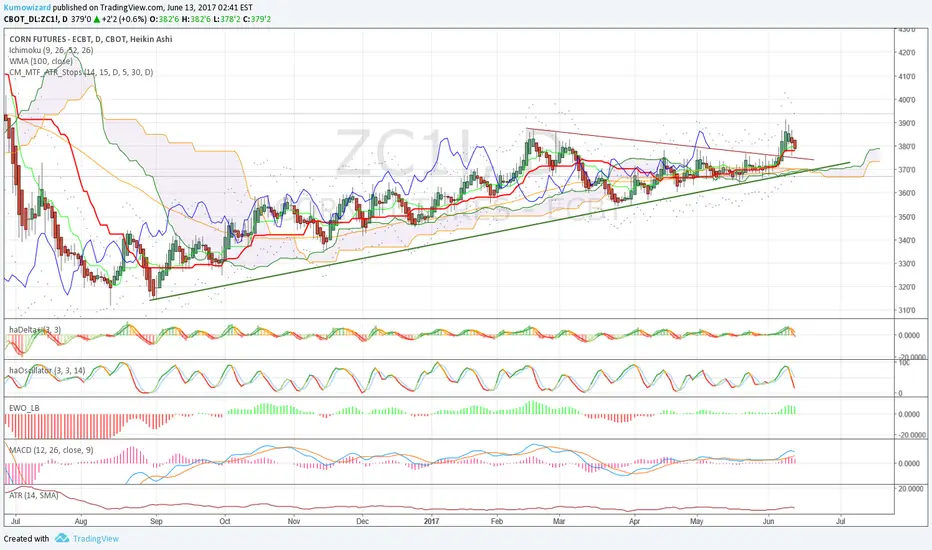
Weekly:
- Neutral Ichimoku, with minor bullish indication (see forward Kumo, and medium bullish Tenkan/Kijun setup in the spot cloud)
- Neutral/minor bearish Heikin-Ashi. Bit confusing, as price is exactly in the middle of the long term sideaway range, right at Kijun and 100WMA
- EWO has bullish bias
- MACD: neutral, consolidation
Daily:
- Ichimoku is neutral
- Heikin-Ashi gives possible buy signal t trendline support
- The real key level is 380-385. Should Corn close above, that would be a start of a major bullish tren

Don't listen to intraday chatters - #Corn is for longWhatever people say I don't care. I only care the setup and probabilities, and that is Bullish!
This means I use any dips to buy some more, until my trailing stop is hit. The thing is you must know what is the value level to buy, and what are your odds and your risk if you run a leveraged position.
short PUT on CornAccording to the seasonal pattern (summer rally), Corn Future is on its move to higher ground also raising volatility along its move upward. This trend is supported by the commercials' net long position, which comes from the closing out of the short positions. OI is rather low, meaning that public is not the driving source behind the price movement.
Option Trade Idea:
short Put 355
duration 60 days (July 17th 2017)
Premium: 1 7/8 (x5000) = appr. 100$ per option
Delta: 11
Volatility: 22.2%
