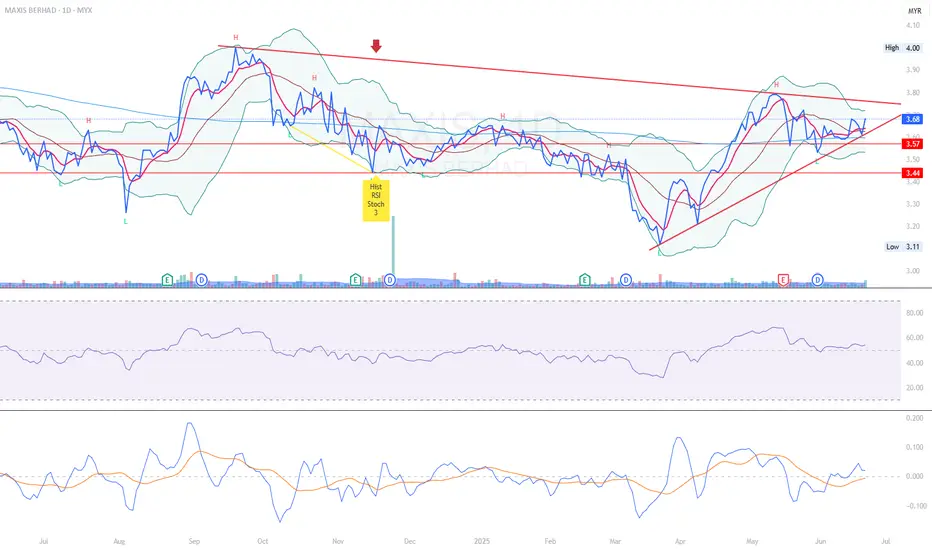
MAXIS Daily Chart Analysis & Trade Plan Summary - 4W June 2025Based on the daily chart, MAXIS is moving in an upward trend after bouncing from a strong support area.
The price is now approaching a long-term downtrend resistance, and your entry at RM3.63 is positioned just before this key level.
The plan is to take profit at RM4.01, which sits near the uppe
Next report date
—
Report period
—
EPS estimate
—
Revenue estimate
—
0.0490 USD
384.01 M USD
2.62 B USD
1.85 B
About Maxis Bhd.
Sector
Industry
CEO
Seow Eng Goh
Website
Headquarters
Kuala Lumpur
Founded
2009
IPO date
Nov 19, 2009
Identifiers
2
ISIN MYL6012OO008
Maxis Bhd. is an investment holding company, which engages in the provision integrated telecommunication services. It operates through Malaysia, and Other Countries geographical segments. It offers postpaid, prepaid, phones, and broadband. The company was founded on August 7, 2009 and is headquartered in Kuala Lumpur, Malaysia.
Related stocks

Maxis last year's performance may indicate unresolved challenges, given that it was worse than the annualised loss of 4% over the last half decade.
TSR of -24% for the last 5 years
i like to wait and see first


Long Idea for Maxis (Malaysia Stock)Assalamualaikum traders,
This is my analysis for Maxis, price has broke downward trend to the upside. I will be waiting for correction before entering trade.
T.A.Y.O.R

MAXIS (MYX) - Be CarefullGreetings
Humbled, we would like to thanks for your support who has already liked, commented and followed us. Your support, strengthens us, to help in analyzing the market. If you have any questions, do not be hesitant to send us message (inbox). Our Service : Signal recomendation, Trading Course, P

MAXIS (MYX) - Have Possibility to BounceGreetings
Humbled, we would like to thanks for your support who has already liked, commented and followed us. Your support, strengthens us, to help in analyzing the market. If you have any questions, do not be hesitant to send us message (inbox). Our Service : Signal recomendation, Trading Course, P


See all ideas
An aggregate view of professional's ratings.
Neutral
SellBuy
Strong sellStrong buy
Strong sellSellNeutralBuyStrong buy
Neutral
SellBuy
Strong sellStrong buy
Strong sellSellNeutralBuyStrong buy
Neutral
SellBuy
Strong sellStrong buy
Strong sellSellNeutralBuyStrong buy
Displays a symbol's price movements over previous years to identify recurring trends.
Frequently Asked Questions
The current price of MAXSF is 0.7100 USD — it has decreased by −28.28% in the past 24 hours. Watch Maxis BHD stock price performance more closely on the chart.
Depending on the exchange, the stock ticker may vary. For instance, on OTC exchange Maxis BHD stocks are traded under the ticker MAXSF.
We've gathered analysts' opinions on Maxis BHD future price: according to them, MAXSF price has a max estimate of 1.30 USD and a min estimate of 0.84 USD. Watch MAXSF chart and read a more detailed Maxis BHD stock forecast: see what analysts think of Maxis BHD and suggest that you do with its stocks.
MAXSF reached its all-time high on Dec 23, 2019 with the price of 1.2800 USD, and its all-time low was 0.7100 USD and was reached on Jun 28, 2022. View more price dynamics on MAXSF chart.
See other stocks reaching their highest and lowest prices.
See other stocks reaching their highest and lowest prices.
MAXSF stock is 39.44% volatile and has beta coefficient of 0.73. Track Maxis BHD stock price on the chart and check out the list of the most volatile stocks — is Maxis BHD there?
Today Maxis BHD has the market capitalization of 7.67 B, it has decreased by −2.60% over the last week.
Yes, you can track Maxis BHD financials in yearly and quarterly reports right on TradingView.
Maxis BHD is going to release the next earnings report on May 15, 2026. Keep track of upcoming events with our Earnings Calendar.
MAXSF earnings for the last quarter are 0.01 USD per share, whereas the estimation was 0.01 USD resulting in a 10.30% surprise. The estimated earnings for the next quarter are 0.01 USD per share. See more details about Maxis BHD earnings.
MAXSF net income for the last quarter is 93.48 M USD, while the quarter before that showed 97.69 M USD of net income which accounts for −4.30% change. Track more Maxis BHD financial stats to get the full picture.
Maxis BHD dividend yield was 4.62% in 2025, and payout ratio reached 87.81%. The year before the numbers were 4.66% and 95.40% correspondingly. See high-dividend stocks and find more opportunities for your portfolio.
EBITDA measures a company's operating performance, its growth signifies an improvement in the efficiency of a company. Maxis BHD EBITDA is 979.82 M USD, and current EBITDA margin is 37.30%. See more stats in Maxis BHD financial statements.
Like other stocks, MAXSF shares are traded on stock exchanges, e.g. Nasdaq, Nyse, Euronext, and the easiest way to buy them is through an online stock broker. To do this, you need to open an account and follow a broker's procedures, then start trading. You can trade Maxis BHD stock right from TradingView charts — choose your broker and connect to your account.