Trade ideas

Kahan Ja Ke Rukega?? Kahan Tak chamkega?Gold!
High Today 1.32Lac
A Hammer Candle on Daily Time Frame
I see Gold Slipping till 1.21Lac and if it cant hold that Leven
It Should Go Down till 1.11Lac
Lets Wait and Watch.....

Nears the Boss Resistance at $4,489 — Revaluation Era Incoming?Gold (GC1!) Nears the Boss Resistance at $4,489 — Revaluation Era Incoming? 🟡👑
No hype — this is it.
Gold Futures (GC1!) have pushed past $4,400 , approaching what I’ve long marked as the Boss Resistance at $4,489 . This is the final gate — and it's been sitting on my chart for years, untouched... until now.
That $4,000 level? It was our signal. The failed short attempt there wasn’t a mistake — it was confirmation. Since that breakout, gold’s been in vertical mode.
📍 Now we’re in the danger zone.
Expect chop, traps, or a reversal between $4,000 and $4,489 unless the Boss gets taken out with strength.
🔍 Big Picture: Revaluation May Be Coming...
The price action is wild — but the backdrop is even bigger.
🧾 Did you know the official U.S. valuation of gold is still $42.22 per ounce?
New research suggests Washington may be considering a gold revaluation — just like Roosevelt did in 1933. That move alone boosted U.S. gold wealth by 69% overnight.
Why revalue now? Here’s what’s brewing:
• 📉 National debt is exploding
• 🪙 Gold ETFs are soaking up demand
• 🌍 Central banks are stacking gold to escape USD dependency
• 💰 Revaluation would instantly add trillions in assets — without printing a dime
This isn’t just a rally — this is a structural reset.
📈 Levels Recap:
• Boss Resistance: $4,489 👑
• Breakout Floor: $4,000
• Intermediate Support: $3,602 and $3,000
• Long-Term Flip Zone: $2,537
Markets don’t move because of candles — they move because of confidence.
🧘 Mindset Check 🧘
Gold is rising because trust is falling.
We are entering an era where sound money is not just a preference — it’s a necessity.
One Love,
The FXPROFESSOR 💙
Gold front runs-----BTC Follows....


Gold Still Running Hot — No Real Pullback YetPrice exploded out of the 15m FVG during Thursday’s Asian session and hasn’t looked back. Took a long right off that 8PM impulsive candle, scaling in as we broke back above the Previous Daily High.
Now we’re holding steady above 4345 — the midpoint of the Asian range looks like short-term support. If bulls defend this level, we could see continuation toward 4380–4400.
Friday bias: Bullish, unless 4340 gives out.
No clean pullback = no reason to force entries. Let the market prove it.
#GoldFutures #MGC #ICTConcepts #NOFOMO #DayTrading

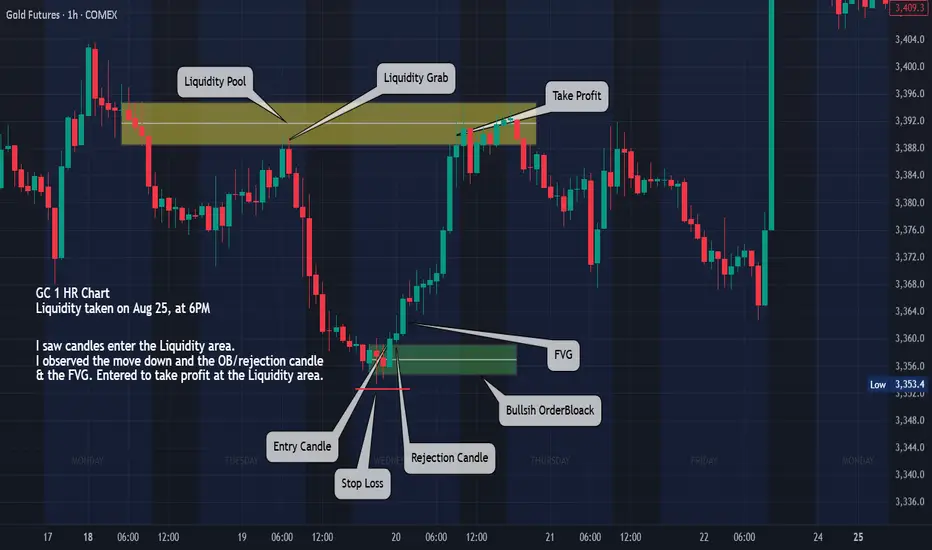
GC - 1 HOUR CHART Liquidity grab to FVRThis is my homework for the GC chart 1 Hour featuring the analysis for the liquidity grab, Order block and redelivery to the liquidity zone.
Is There an End to Gold’s Price Surge?The price of gold has already reached $4,300 per ounce. As we have repeatedly mentioned in our analyses, once gold starts moving upward, there’s no stopping it — and this prediction is now being confirmed.
Since mid-August 2025, gold has gained nearly $1,000 per ounce in just two months. Few could have imagined such a move, yet it was entirely foreseeable given today’s global conditions.
The world remains deeply unstable — with the shift toward digital currencies, ongoing wars, and soaring national debts that push governments to borrow endlessly. These factors drive investors and ordinary people alike to seek safety in gold and real estate.
The momentum behind gold is unlikely to end in the coming months. As we’ve projected before, the price trend remains strongly bullish.
At World-Signals, we expect a minor correction just before the $5,000 level, likely a pullback of $400–$500, followed by a continuation of the uptrend throughout 2026.
It’s not impossible that those holding just a few gold bars by 2026 could find themselves millionaires.
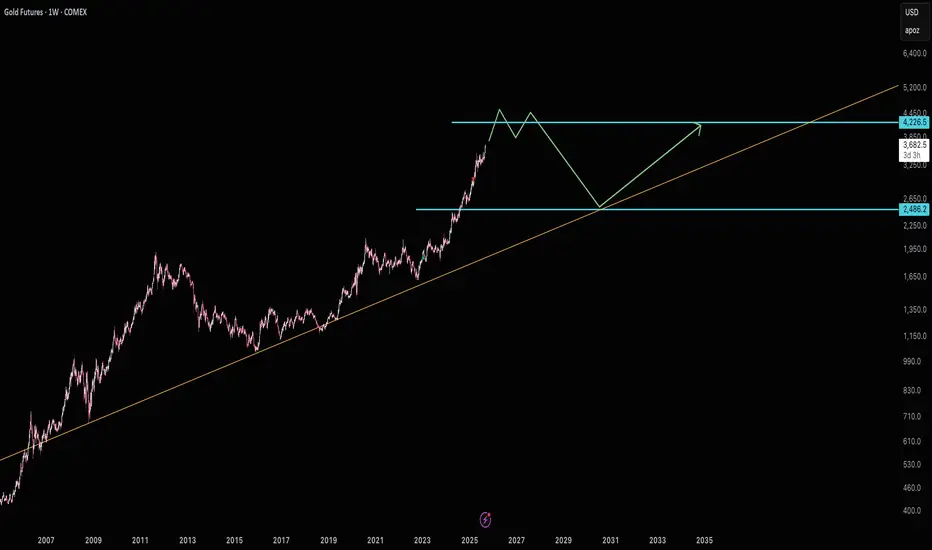
Gold is in a bubbleGold appears to be running straight up to resistance without ever forming support around $2486. This is not a good sign for gold buyers. I'm highly speculating gold will fall back to $2486. This move is similar to 1979. As in 1979 it went significantly higher than resistance before falling all the way back down to support. So be cautious, this could go much higher than $4220 before coming back to reality.
Good luck!
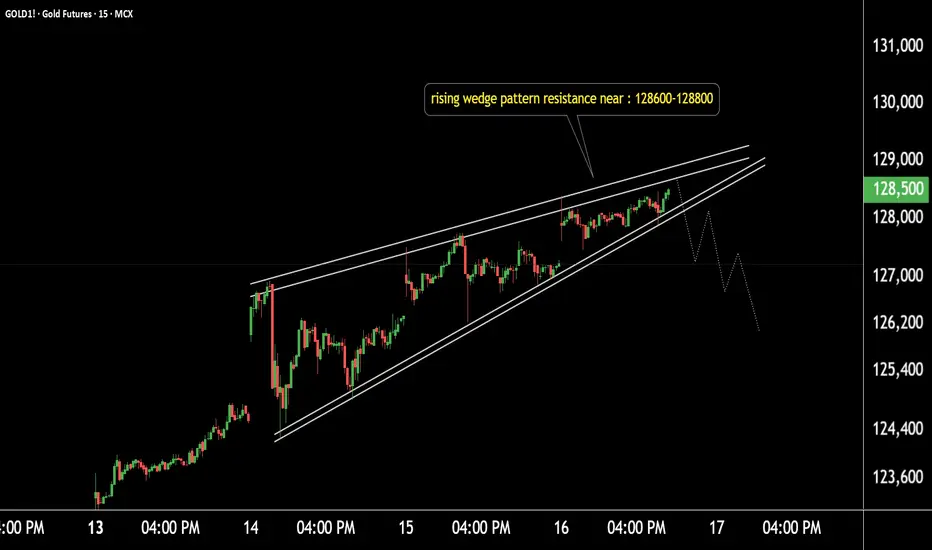
Gold at Risk of Pullback as Rising Wedge Pattern Emerges!Gold Technical Update (15-Min Timeframe)
Gold is forming a Rising Wedge pattern.
Resistance zone: 128600 – 128800.
If the resistance zone holds, selling pressure may increase.
The pattern indicates a potential downside move if price breaks below the lower trendline.
Traders should watch for a breakdown confirmation before taking any fresh positions.
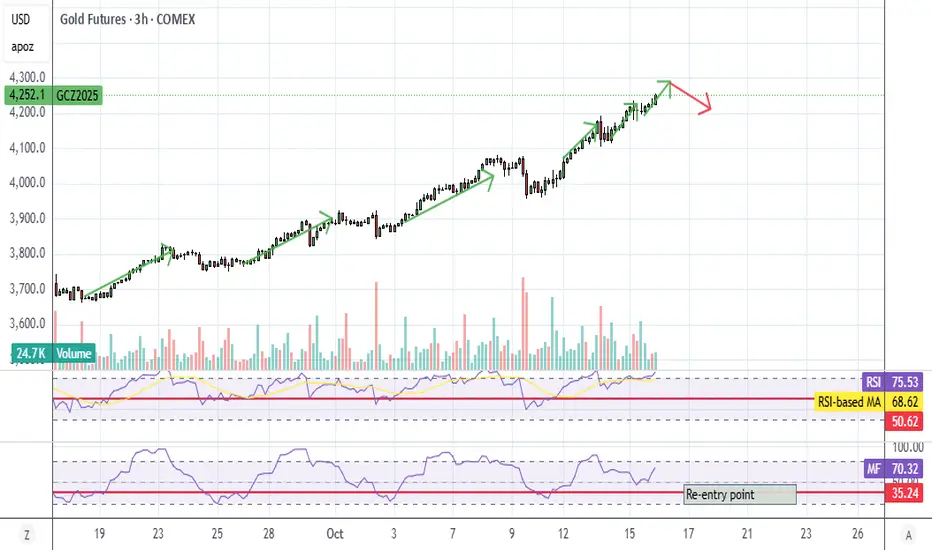
GOLD FUTURESAccording to Gann: Gold and the "Square of the Range"---3 squares up in price = 4411. Gold is hugely overbought some are so ready to sell. If December Gold gets to 4411 and shows signs of topping, that do not mean it is the end of the rally.
It is overdue for a pullback it just may continue for a few years.

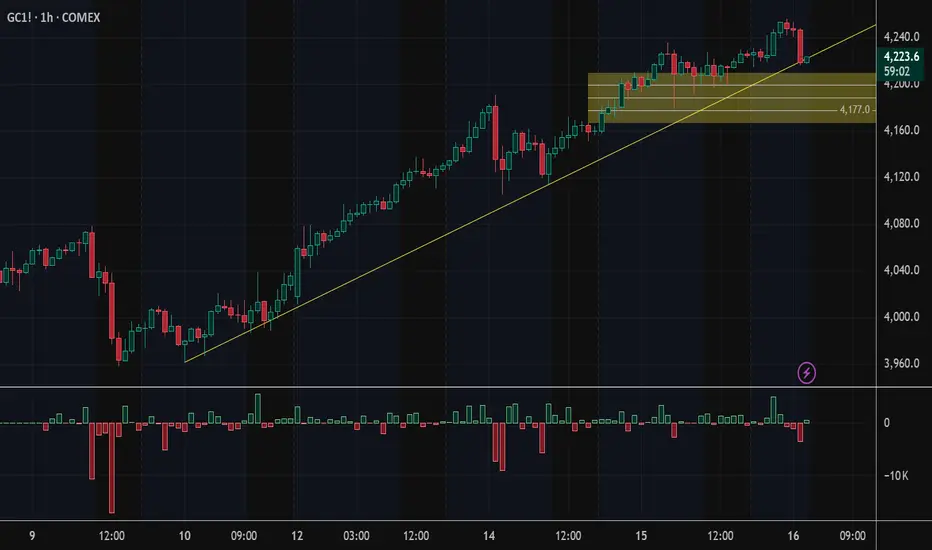
Key Levels to Buy Gold TodayFenzoFx—Gold is trading higher today, made a new ATH. As of this writing, XAU/USD trades at approximately $4,222.0, testing the ascending trendline as support. Going long is still in play, but we suggest waiting for a correction toward $4,177.0.
This area is last day's opening gap in the futures market. Therefore, there is a high probability for the price to decrease near this level before a new leg upward.
GC Update againSurprised they're pumping it again tonight. Appears MFI is not going to hit my red line, they're just gonna melt it up with no real drops.
Missed out, but I'd rather go big on a sure bet than hold a small position continuously. There's no way I'd have sunk $700k into gold for a long term play, though in hindsight I wish I had, lol
Asian Session Prep | Price Holding Above Yesterday’s HighNew day, new opportunity — and the bulls are still in control.
Price broke above yesterday’s high before the Asian killzone, showing strong intent early. Now, as we move into the session, it looks like we’re setting up for a continuation — using the previous Daily High (4234.7) as intraday support.
I’ll be watching for a clean reaction around that level during the next impulsive hour. As long as price continues respecting that structure, I’ll maintain a bullish bias.
💡 Key Notes:
Setup: Killzone Continuation
Bias: Bullish
Key Level: 4234.7 (Previous Daily High → Support)
Session Focus: Asian Killzone (8PM–11PM CST)
Target Zones: 4250 short-term, 4280 stretch target
Blind Spot: Price might retrace deeper before expansion — watch for liquidity sweeps near 4220 before continuation.
#Gold #Futures #DayTrading #PriceAction #AsianSession #KillzoneTrading #NoFOMO #Discipline #ICTInspired #TraderMindset

GC1 UpdateRevised overlay, expecting a dump sometime tonight or tomorrow morning. MFI pattern is similar to last push.
Target is still around 4500, but I could be wrong. Just watching for now.

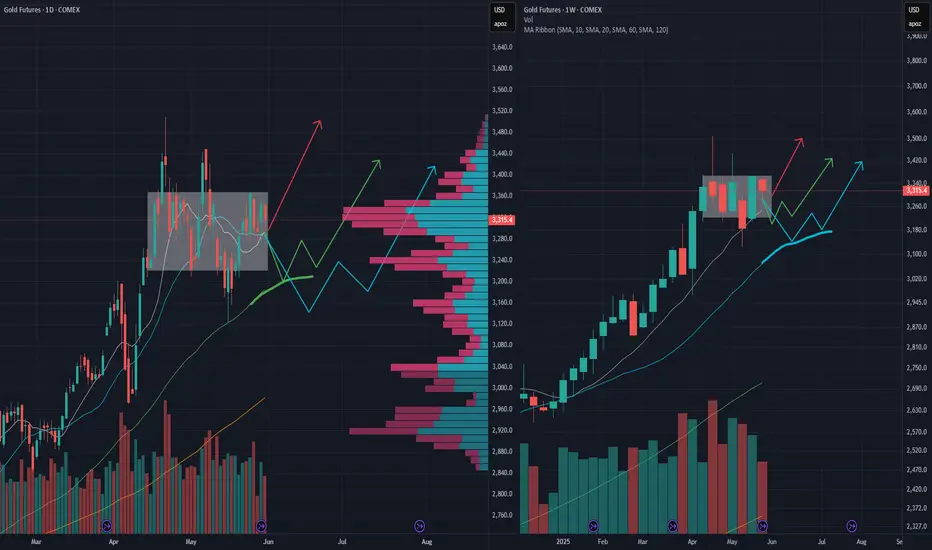
GC/GOLD bull rally setupHigh potential: looking for a 60 SMA support (~3200) in 2 weeks and then continue the bull rally (green path)
Medium potential: looking for a 20 weekly SMA support (~3140) in 1 month and then continue the bull rally (cyan path)
Low potential: directly break out next week (red path), but indicators do not quite support this case, so it may need some "external news"
Gold buy above 117815 tgt 120000 positonalGold buy above 117815 tgt 120000 positonal
Gold buy above 117815 tgt 120000 positonal
Gold buy above 117815 tgt 120000 positonalGold buy above 117815 tgt 120000 positonalGold buy above 117815 tgt 120000 positonalGold buy above 117815 tgt 120000 positonalGold buy above 117815 tgt 120000 positonalGold buy above 117815 tgt 120000 positonalGold buy above 117815 tgt 120000 positonalGold buy above 117815 tgt 120000 positonalGold buy above 117815 tgt 120000 positonalGold buy above 117815 tgt 120000 positonalGold buy above 117815 tgt 120000 positonalGold buy above 117815 tgt 120000 positonalGold buy above 117815 tgt 120000 positonal

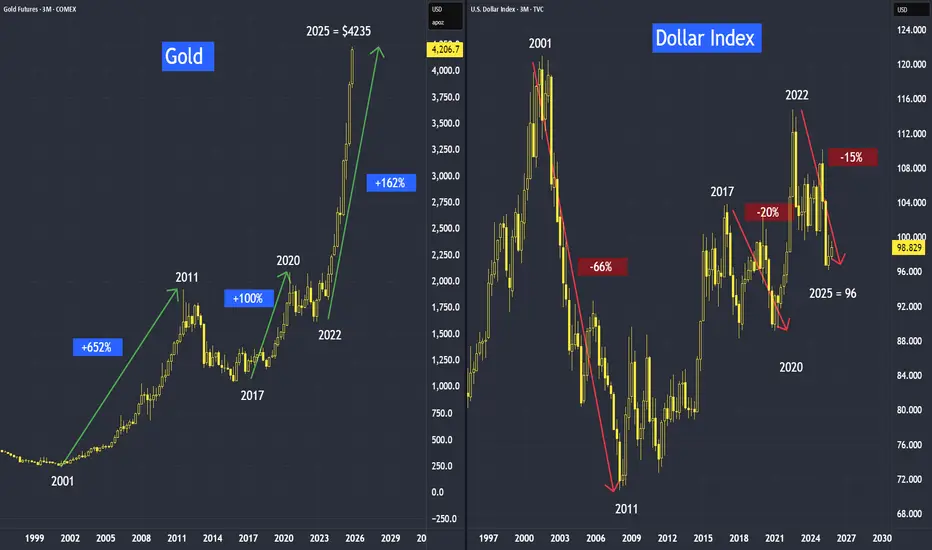
How High Will Gold Go? It Depends on the DollarThe inverse relationship between gold and the dollar is evident. Interestingly, we observe that when the dollar falls, gold rises—but the magnitude of gold’s increase is often greater than the dollar’s decline.
As we can see when dollar declines, gold went up.
From 2001 to 2011, when dollar was down, gold went up.
From 2017 to 2020, when dollar was down, gold went up.
And from 2022 to current, when dollar is down, gold is up.
With de-dollarization, this also means gold may have more upside potential.
Conversely, when the dollar increases, gold declines by almost the same magnitude.
Apart from de-dollarization, what are the other reasons dollar will face more headwinds?
There are three elements
• Existing debt,
• more money printing and
• tariffs,
All these 3 elements are not going to go away anytime soon, as long as the debt continue to rise, more money to be printed and more tariffs impose, dollar downtrend is likely to continue. When dollar is down, gold is up.
And these trends did not happen recently. It is taking shape over the past decades with a lower dollar, we can see how nicely the trends have seated on its historical troughs and peaks forming the channel for the dollar, and also in the gold over the decades.
This tutorial video version:
Mirco Gold Futures and Options
Ticker: MGC
Minimum fluctuation:
0.10 per troy ounce = $1.00
Disclaimer:
• What presented here is not a recommendation, please consult your licensed broker.
• Our mission is to create lateral thinking skills for every investor and trader, knowing when to take a calculated risk with market uncertainty and a bolder risk when opportunity arises.
CME Real-time Market Data help identify trading set-ups in real-time and express my market views. If you have futures in your trading portfolio, you can check out on CME Group data plans available that suit your trading needs www.tradingview.com
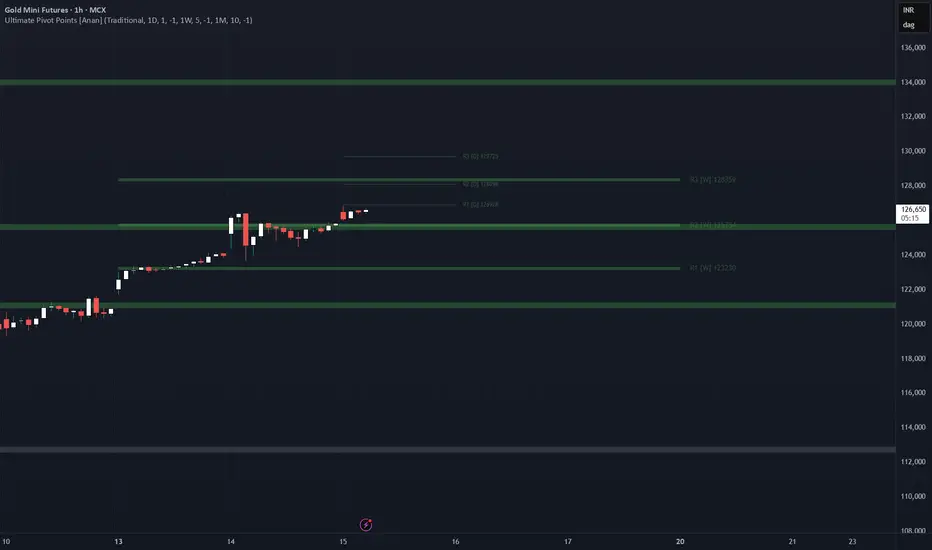
GOLD MCX 127000 Levels is where resistance can be seen nowGOLD MCX 127000 Levels is where resistance can be seen now
today's high need to be break and sustained above to see new Highs in Shining metal
Gold Buy near 126900 tgt 128900 intrdayGold Buy near 126900 tgt 128900 intrday
Gold Buy near 126900 tgt 128900 intrday
Gold Buy near 126900 tgt 128900 intrday
Gold Buy near 126900 tgt 128900 intrday
Gold Buy near 126900 tgt 128900 intrdayGold Buy near 126900 tgt 128900 intrdayGold Buy near 126900 tgt 128900 intrdayGold Buy near 126900 tgt 128900 intrdayGold Buy near 126900 tgt 128900 intrdayGold Buy near 126900 tgt 128900 intrday

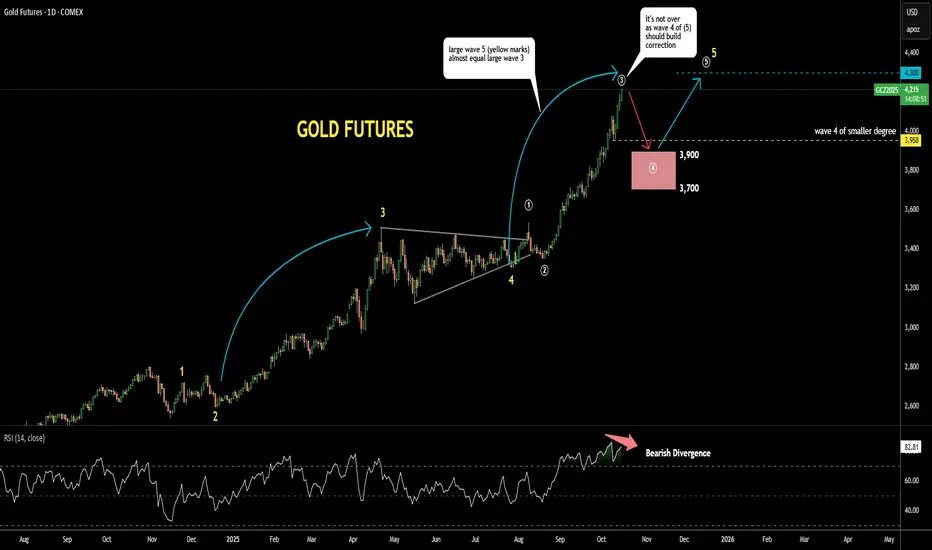
Gold Update 15OCT2025: RSI Hints at CorrectionGold continues to dominate headlines, printing new all-time highs one after another
The 4-hour Bearish Divergence earlier failed to halt the rally
Now, a Bearish Divergence has appeared on the daily time frame, as the latest price high was not confirmed by RSI
This signals that a peak may be forming
A corrective phase could soon unfold as wave 4 within the larger wave (5) structure
The expected retracement could reach the 38.2–61.8% Fibonacci zone of wave 3 of (5), targeting the pink box between $3,700 and $3,900
The low of the previous minor wave 4, near $3,958, may serve as initial support during the pullback
It is worth noting that the magnitude of wave (5) so far mirrors that of the prior large wave (3)
Therefore, the projected target for the final wave 5 of (5) remains around $4,300 as a conservative objective
However, if momentum extends further, wave 5 could evolve into an extended move and drive prices toward new record highs beyond that level
Momentum Breakout into Strength | D-H Flip ConfirmedStrong continuation from last session’s impulsive push.
I caught my move during the Tokyo impulsive hour after price broke cleanly above 4175 — confirming a momentum breakout setup on the 15-min chart.
The previous Daily High (4191.2) has now flipped into solid support, reinforcing the bullish narrative I’ve been tracking since the start of the week.
My original weekly target was 4200 — we’ve exceeded that level now, and the momentum still looks healthy.
Price action is slowing ahead of the London session, which could set the stage for another expansion leg. If bullish pressure holds, I’m watching 4230–4250 next, with 4500 as a stretch target.
💡 Key Notes:
Setup: Momentum Breakout
Bias: Bullish
Entry: 4177.3 | Exit: 4185.1
Result: +$386 (5 Contracts)
Time in Trade: 42m
Context: Daily High Flip + Strong Impulse Continuation
#Gold #Futures #DayTrading #PriceAction #Breakout #TradingView #MGC #Trader #NoFOMO #Discipline #MomentumBreakout #ICTInspired

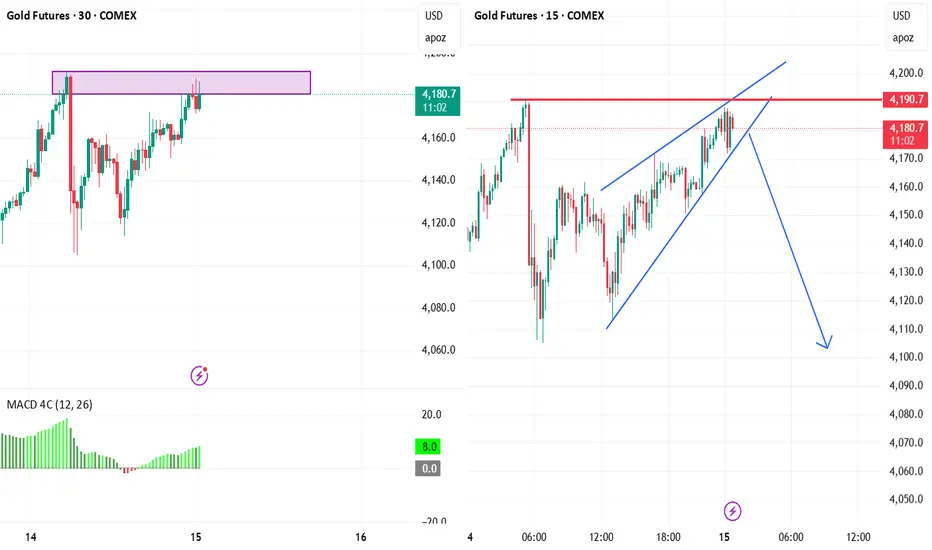
Gold Futures: Approaching Key Resistance with Bearish Rising WedGold futures are testing strong resistance near 4,190 on the 15-minute chart, forming a rising wedge pattern—a classic bearish reversal signal. Watch for a potential breakdown below wedge support that could trigger a sharp decline toward 4,110. Momentum indicators show weakening bullish strength, suggesting sellers may soon take control. Traders should monitor this critical zone for confirmation of trend reversal or a breakout continuation.
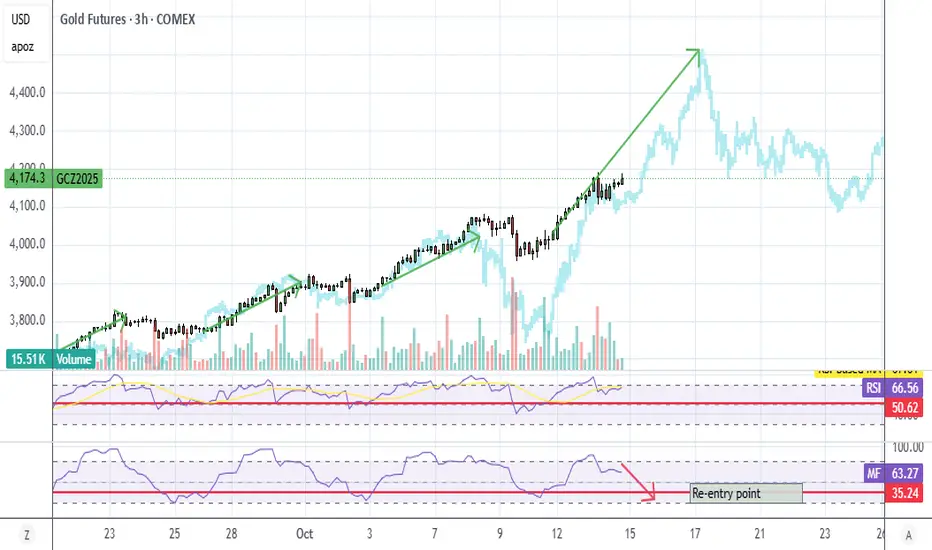
GC UpdateWaiting for re-entry, I was looking at the chart again, and it looks like RSI has to hit 50 AND MFI has to cross my red line before it's time to buy. Also, I recommend buying when it crosses back OVER the line, not on the way down. You don't need to time the exact bottom to make money.
It's looking a lot like tomorrow afternoon or Thu morning. I can't update during the day, but I will post a comment.