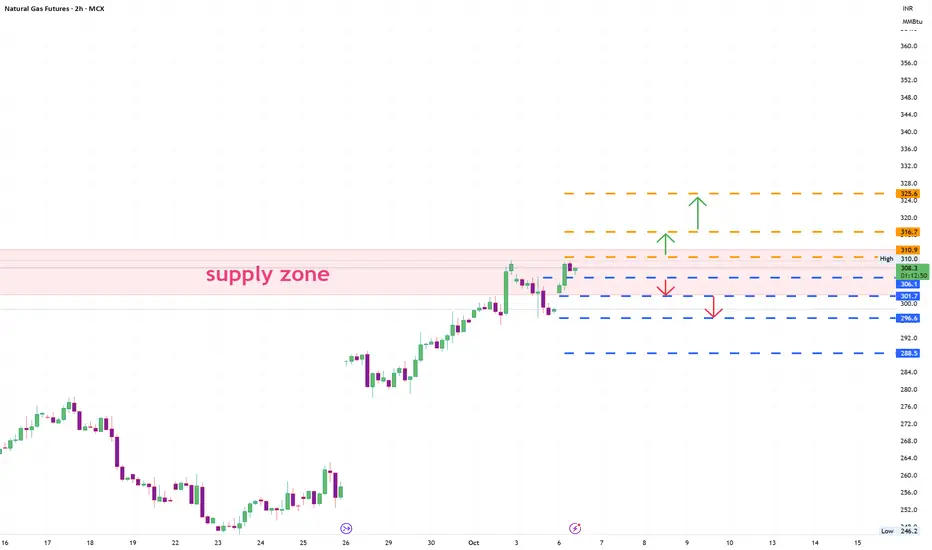
Naturalgas probable price movementAs of now price is at previous supplyzone
1. if crosses above price may test upper levels
2. if price goes below price may touch lower levels
Note. : price looks very strong and supplyzone may or maynot be respected.
Natural Gas Futures
NATURALGAS1! trade ideas
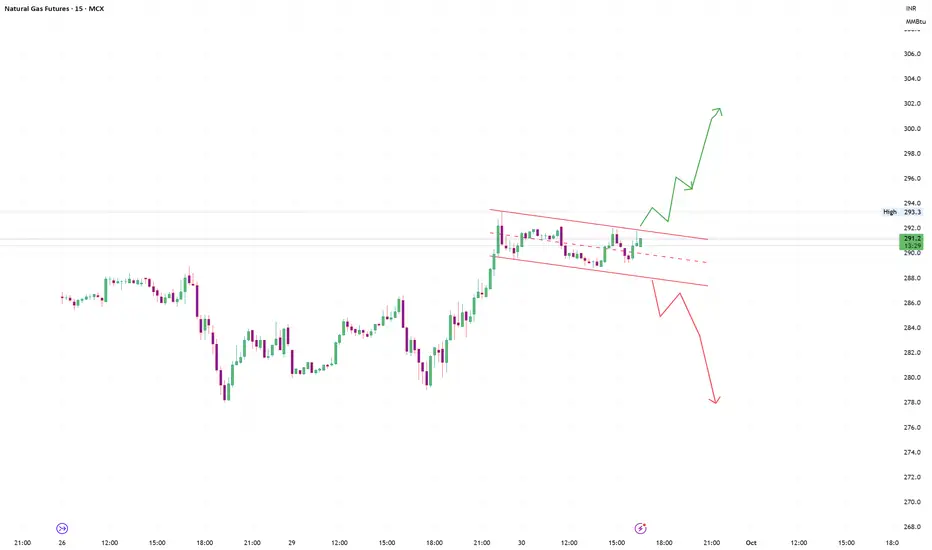
Natural gas Probable price movement1. above the parallel channel . price may move upwards
2. below it. price may move downward.
NATURAL GAS BULLISH CYCLEWith the continuous growing demand for electricity supply across the US for data centers, natural gas seems to be the fuel that will provide sufficient energy for the next 2 or 3 years for power plants that will generate many GWhs for these data centers. Here on the chart you can see that the current price action is following a pretty similar path with the cycle of September 2005 to July 2008. In a previous post i also noted that i am bullish on natural gas, when the US became the top supplier of Europe instead of Russia. I think the oncoming rally can drive the price towards the 5$ - 7$ level until the autumn of 2026.

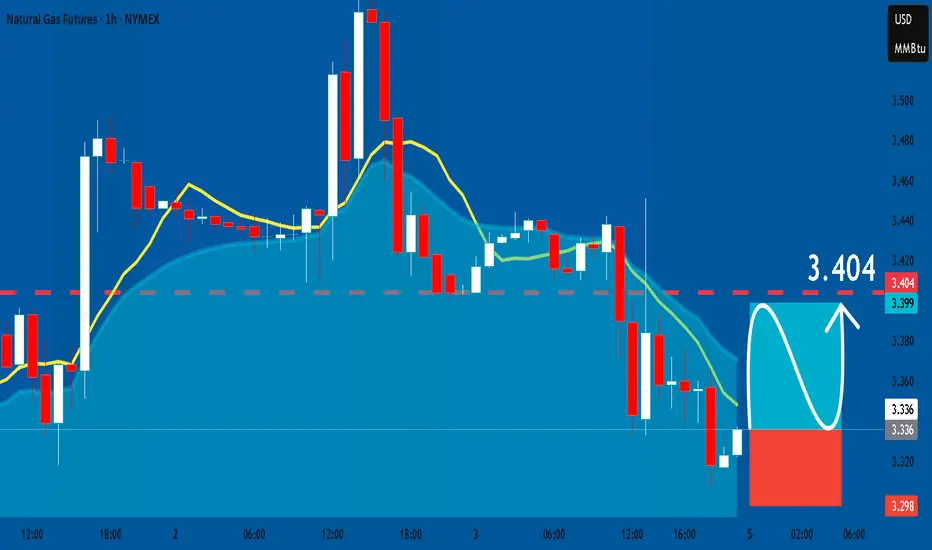
NATGAS Trading Opportunity! BUY!
My dear subscribers,
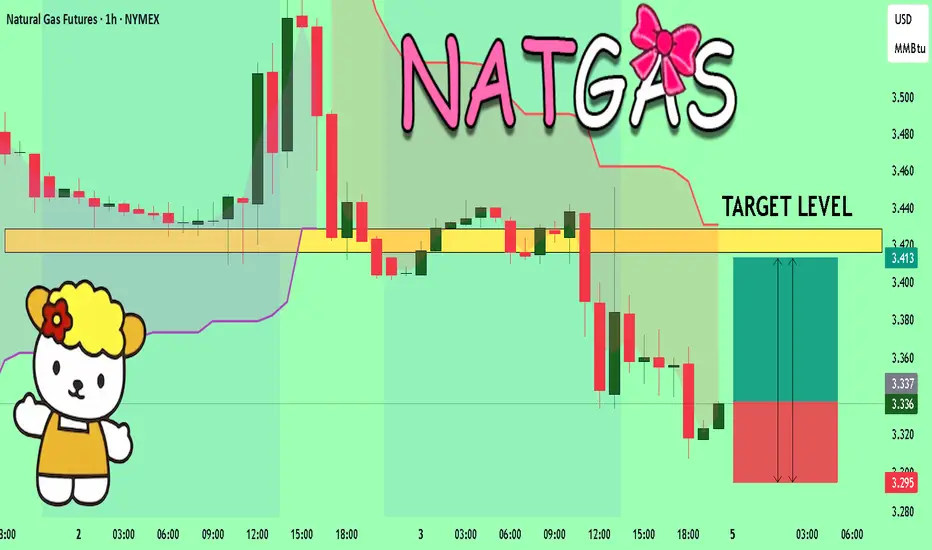
NATGAS looks like it will make a good move, and here are the details:
The market is trading on 3.336 pivot level.
Bias - Bullish
My Stop Loss - 3.295
Technical Indicators: Both Super Trend & Pivot HL indicate a highly probable Bullish continuation.
Target - 3.416
About Used Indicators:
The average true range (ATR) plays an important role in 'Supertrend' as the indicator uses ATR to calculate its value. The ATR indicator signals the degree of price volatility.
Disclosure: I am part of Trade Nation's Influencer program and receive a monthly fee for using their TradingView charts in my analysis.
———————————
WISH YOU ALL LUCK
NATGAS - LONG LONG TERM targetNATGAS - LONG LONG TERM target
This is my evaluation about NatGas for the next week with a long term vision for this winter.
So I think we are in final 5° wave and probably we can break resistence area in 4$ zone

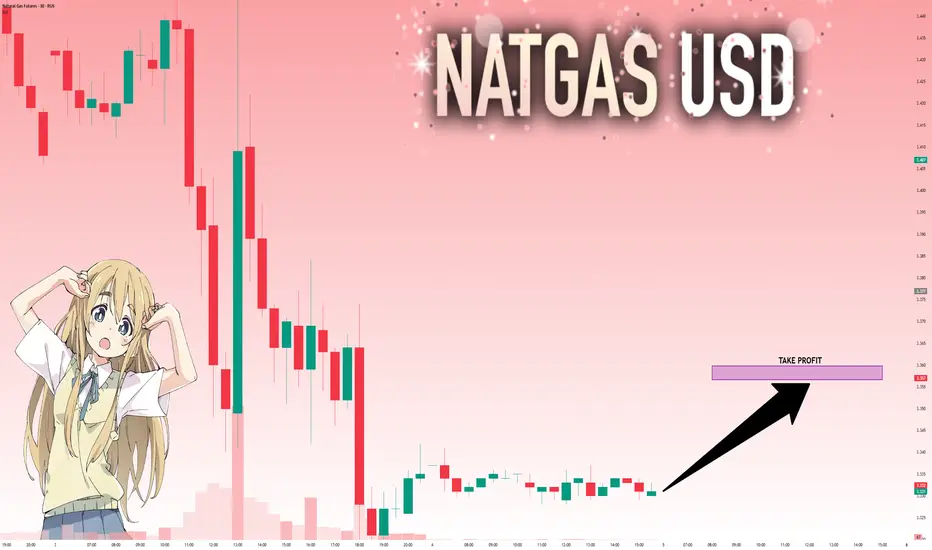
NATGAS FREE SIGNAL|LONG|
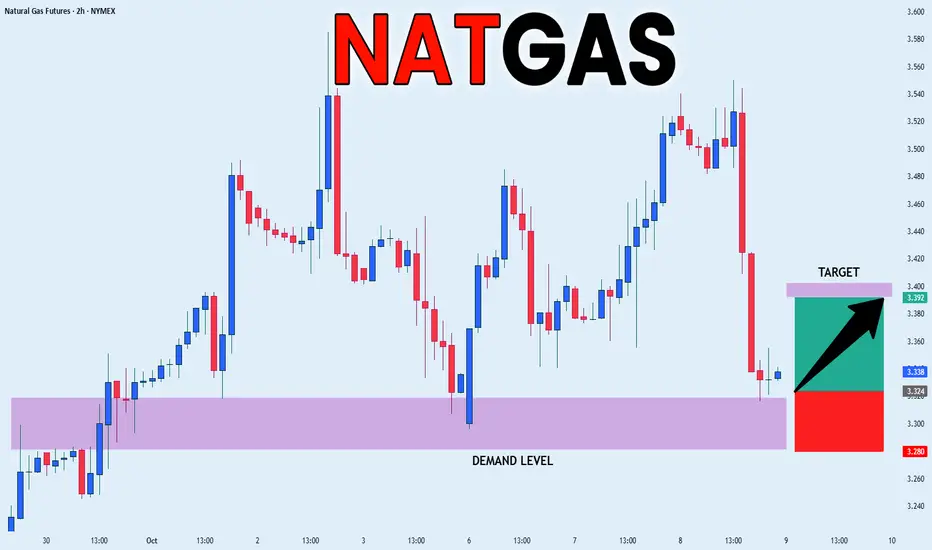
✅NATGAS reacts perfectly from the demand level, confirming bullish intent after liquidity sweep below structure. Buyers step in from discounted pricing, aiming for a recovery toward the 3.39$ target zone.
—————————
Entry: 3.33$
Stop Loss: 3.28$
Take Profit: 3.39$
Time Frame: 2H
—————————
LONG🚀
✅Like and subscribe to never miss a new idea!✅
NATURAL GAS BULLISHA great level to take entry for a bullish breakout as winter is ahead for the northern hemisphere, and the constant geopolitical conflicts are creating an environment for very bullish moves in commodities. I think that in the next 6 months, Natural gas futures will reach easily the 6.5$ level.

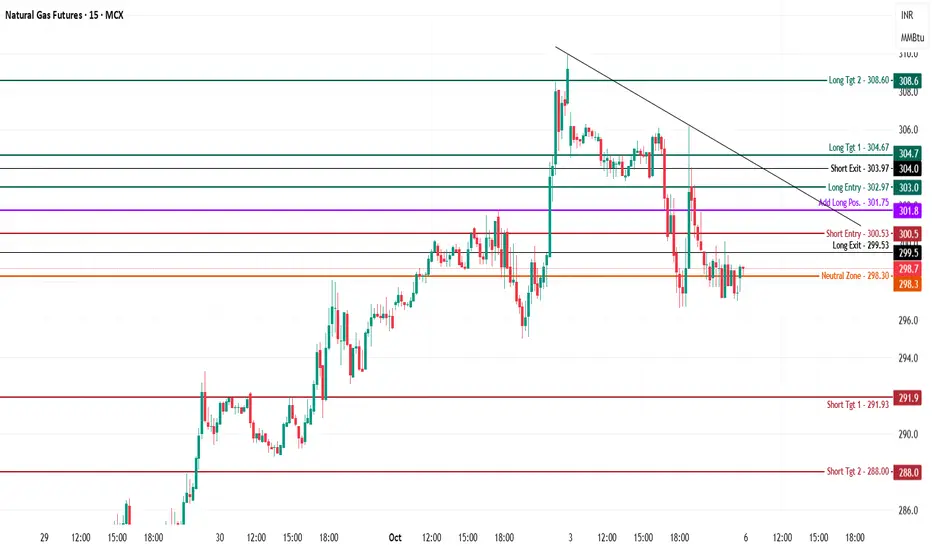
Natural Gas Futures (MCX) – Intraday Analysis - 6th Oct., 2025MCX:NATURALGAS1!
Natural Gas is trading at 298.7, consolidating below recent resistance and major supply after a minor downtrend, with price action holding around the neutral zone and awaiting a directional breakout.
Bullish (Long) Setup
Long Entry (303.0):
Initiate long trades above 303.0, which signals a breakout over the recent resistance and descending trendline, confirming buyers retaking control.
Additional exposure can be added near 301.75 if dips are bought and price forms a higher low.
Upside Targets:
304.7 (Target 1): Immediate supply and intraday high—key zone for partial booking.
308.6 (Target 2): The extended bullish target in case of strong momentum, mapping to higher channel resistance.
Stop Loss:
Place just below 299.5 (long exit level) or 298.3 (neutral zone) to contain risk from false breakouts.
Bearish (Short) Setup
Short Entry (300.5):
Shorts become actionable below 300.5, on sustained failure to reclaim resistance, giving further advantage to sellers.
Downside Targets:
291.9 (Target 1): Previous low and first major support area where covering may occur.
288.0 (Target 2): Deeper extension, marking aggressive selling or stop-loss sweep area.
Stop Loss:
Place above 301.8 (add-long band) to avoid losses on failed breakdowns.
Range/Neutral Logic
Neutral Zone (298.3):
Price consolidating in this area denotes indecision—await a clear breakout or breakdown before committing to trend trades.
Sustained acceptance above 303 confirms bulls; below 299.5 risks further slide.
Gold | Oil | Dollar | Silver | Natural Gas Price ForecastGold | Oil | Dollar | Silver | Natural Gas Price Forecast
COMEX:GC1! COMEX:SI1! AMEX:BOIL AMEX:KOLD

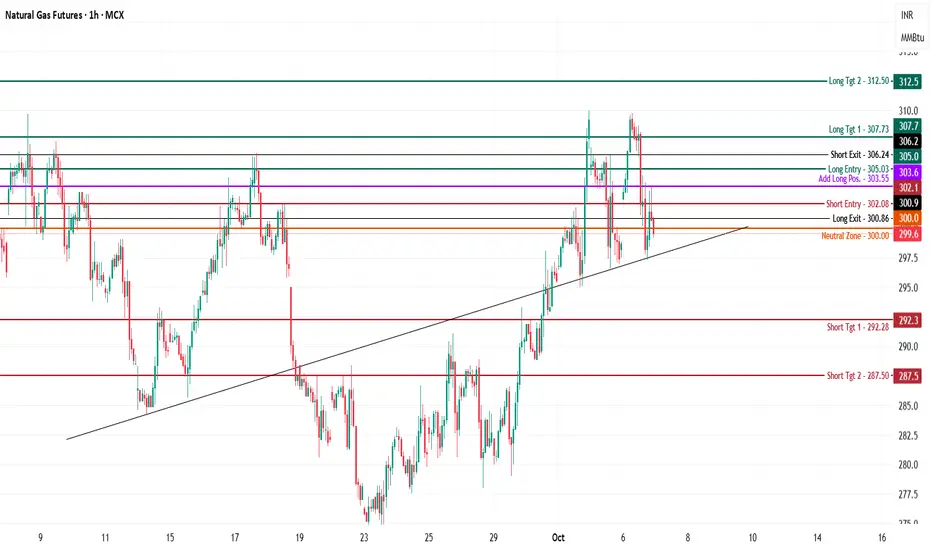
Natural Gas Futures (MCX) – Intraday Analysis for 7th Oct., 25 MCX:NATURALGAS1!
Natural Gas is trading at 299.6, consolidating just below the Neutral Zone (300), after failing to hold above resistance and forming lower highs in recent sessions. The chart shows increasing risk of volatility near the session trendline pivot.
Bullish Setup
Long Entry (305.03):
Fresh longs are attractive above 305.03 as price reclaims intraday resistance, confirming buyers have regained control.
Add more if price holds above 303.55 (add-long band), with dips supported and higher lows developing.
Upside Targets:
307.73 (Target 1): First supply, ideal for partial exit or trailing stops.
312.50 (Target 2): Extended bullish target if momentum expands.
Stop Loss:
Place below 300.86 (long exit) or trail as price moves up.
Bearish Setup
Short Entry (302.08):
Shorts trigger below 302.08 on breakdowns from intraday base, confirming sellers dominating price action.
Downside Targets:
292.28 (Target 1): Demand zone and prior reaction low, logical for profit booking.
287.50 (Target 2): Next mapped extension for aggressive downsides.
Stop Loss:
Cover shorts if price retakes 305.03 zone to reduce risk on failed breakdown.
Neutral/Range Logic
Neutral Zone (300):
Current price action near Neutral Zone signals indecision—expect range-bound moves until a clean break above 305.03 or below 302.08 for trend alignment.
Trendline support below may create whipsaw volatility if not held.
NG1!: Will Go Up! Long!
My dear friends,
Today we will analyse NG1! together☺️
The market is at an inflection zone and price has now reached an area around 3.332 where previous reversals or breakouts have occurred.And a price reaction that we are seeing on multiple timeframes here could signal the next move up so we can enter on confirmation, and target the next key level of 3.357.Stop-loss is recommended beyond the inflection zone.
❤️Sending you lots of Love and Hugs❤️
NATGAS: Long Signal Explained
NATGAS
- Classic bullish formation
- Our team expects pullback
SUGGESTED TRADE:
Swing Trade
Long NATGAS
Entry - 3.336
Sl - 3.298
Tp - 3.404
Our Risk - 1%
Start protection of your profits from lower levels
Disclosure: I am part of Trade Nation's Influencer program and receive a monthly fee for using their TradingView charts in my analysis.
❤️ Please, support our work with like & comment! ❤️
NATGAS Strong Bullish Bias! Buy!
Hello,Traders!
NATGAS After a bullish gap up, price confirmed strength with a breakout above the horizontal demand area. SMC bias points to continuation, targeting the 3.40$ region. Time Frame 9H.
Buy!
Comment and subscribe to help us grow!
Check out other forecasts below too!
Disclosure: I am part of Trade Nation's Influencer program and receive a monthly fee for using their TradingView charts in my analysis.

NATGAS - New Long PhaseNATGAS - New Long Phase
Potential new ABC long Phase with 2 target above this price level

Gold | Oil | Dollar | Silver | Natural Gas Price ForecastGold | Oil | Dollar | Silver | Natural Gas Price Forecast
AMEX:UNG AMEX:BOIL AMEX:KOLD COMEX:SI1!

3.6This channel is not providing individualized trading or investment advice, nor is it a banking service, brokerage service, trading service, investment service or money management service

NATGAS Massive Short! SELL!
My dear subscribers,
This is my opinion on the NATGAS next move:
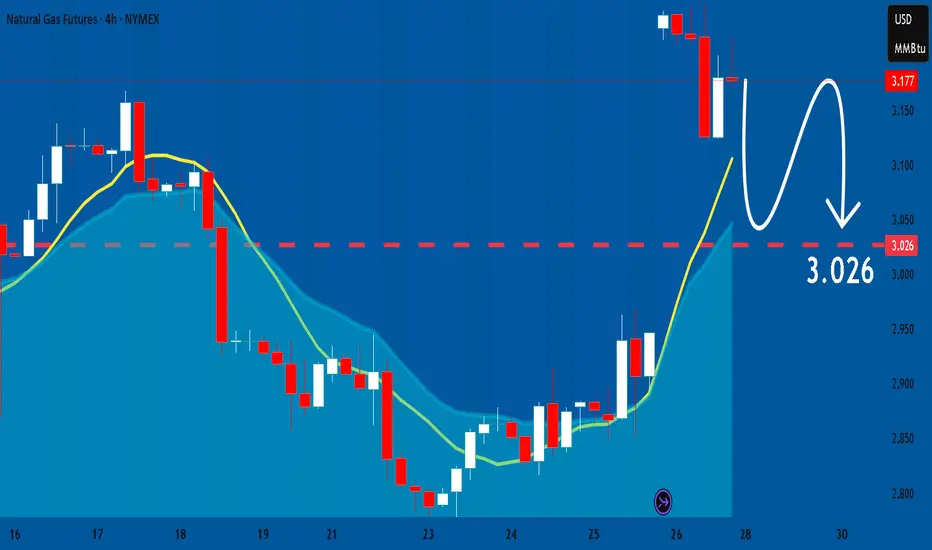
The instrument tests an important psychological level 3.177
Bias - Bearish
Technical Indicators: Supper Trend gives a precise Bearish signal, while Pivot Point HL predicts price changes and potential reversals in the market.
Target - 3.054
About Used Indicators:
On the subsequent day, trading above the pivot point is thought to indicate ongoing bullish sentiment, while trading below the pivot point indicates bearish sentiment.
Disclosure: I am part of Trade Nation's Influencer program and receive a monthly fee for using their TradingView charts in my analysis.
———————————
WISH YOU ALL LUCK

NATGAS: Market of Sellers
Balance of buyers and sellers on the NATGAS pair, that is best felt when all the timeframes are analyzed properly is shifting in favor of the sellers, therefore is it only natural that we go short on the pair.
Disclosure: I am part of Trade Nation's Influencer program and receive a monthly fee for using their TradingView charts in my analysis.
❤️ Please, support our work with like & comment! ❤️
NG1! BEARS ARE STRONG HERE|SHORT
NG1! SIGNAL
Trade Direction: short
Entry Level: 3.177
Target Level: 2.934
Stop Loss: 3.339
RISK PROFILE
Risk level: medium
Suggested risk: 1%
Timeframe: 9h
Disclosure: I am part of Trade Nation's Influencer program and receive a monthly fee for using their TradingView charts in my analysis.
✅LIKE AND COMMENT MY IDEAS✅

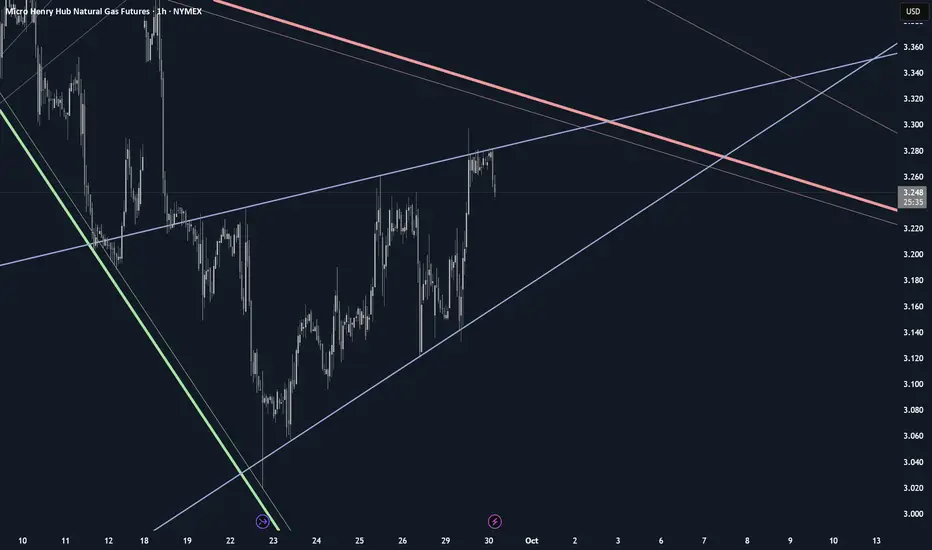
Weakening Natural GasNYMEX:MNG1!
Price is still well within it's high time frame downtrend.
Still within an expanding pattern, Refer to my previous post.
As noted a week ago, the recent rally is reaching exhaustion.
This is made apparent by the recent rising wedge that has formed.
Higher lows are increasing at a faster rate than higher highs.
Measured moved is roughly 5.4% decline from break.
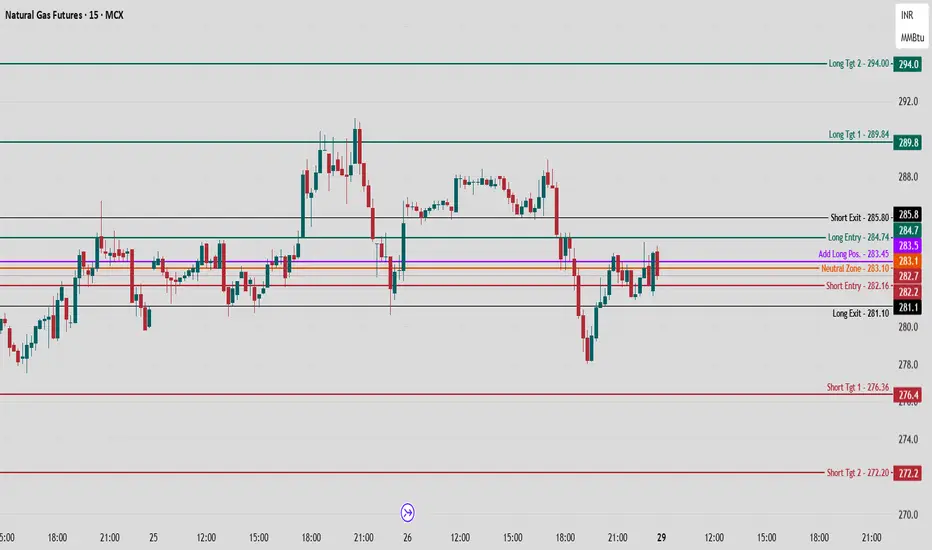
Natural Gas MCX Future - Intraday Technical Analysis 29th Sept.MCX:NATURALGAS1!
Natural Gas is currently trading at 282.7 after a period of high volatility and failed recovery attempts, moving around key inflection levels.
Bullish (Long) Setup
Long Entry (284.7):
Initiate longs above 284.7, as this breaks out from recent supply and confirms buyers regaining control over the session.
Add positions near 283.5 if dips are absorbed and price action forms higher lows above this level.
Upside Targets:
289.8 (Target 1): First major resistance and prior swing high, logical profit-taking zone.
294.0 (Target 2): Extension area, marking upper band of the visible range.
Stop Loss:
Place just below 283.1 (neutral zone) to reduce risk; breakdown here signals failed bullish momentum for this cycle.
Bearish (Short) Setup
Short Entry (282.2):
Enter shorts below 282.2. This confirms breakdown of support, indicating sellers regaining control and potential for rapid downside.
Downside Targets:
276.4 (Target 1): Historical bounce/readjustment level, typical for covering and first target booking.
272.2 (Target 2): Deeper extension, marking further weakness if sell pressure persists.
Stop Loss:
Above 283.5 to guard against sharp reversal.
Neutral/Range Logic
Neutral Zone (283.1):
Ranging bias between 283.1–283.5; best to wait for a decisive move outside these levels for clear trend alignment.
Sustained action above 284.7 signals buyers in control, below 282.2 puts sellers in charge.
This logical structure enables disciplined intraday setups with clearly defined risk-reward for Natural Gas MCX.
Follow Chart Pathik for more insight on Natural Gas on Daily basis.
NG1!: Strong Bullish Sentiment! Long!
My dear friends,
Today we will analyse NG1! together☺️
The market is at an inflection zone and price has now reached an area around 3.197 where previous reversals or breakouts have occurred.And a price reaction that we are seeing on multiple timeframes here could signal the next move up so we can enter on confirmation, and target the next key level of 3.224.Stop-loss is recommended beyond the inflection zone.
❤️Sending you lots of Love and Hugs❤️

Naturalgas probable price moments1. if takes support at trend line may move up
2. if breaks it may take the price lower
