Silver 4 hour The SLV ETF is in an uptrend channel above the heartline. Bullish inside bar awaiting next four-hour bar for confirmation.
Expecting price discovery soon as silver futures have wicked just below 48.00USD.
I have over 100 Call options into next year at $ 43.00 for February 2026. I am invested.
Not financial advice, just my thoughts on the tech analysis.
Silver Micro Futures
SILVERMICM2026 trade ideas


Expanding triangle and silverSword is not far from its all-time high which was 50 and it looks like it is going to go towards the 50 maybe a little bit higher it'll be interesting to look at this later today around 6 PM and get a sense of what it might be doing at that time even though the market technically opens up after the weekend.

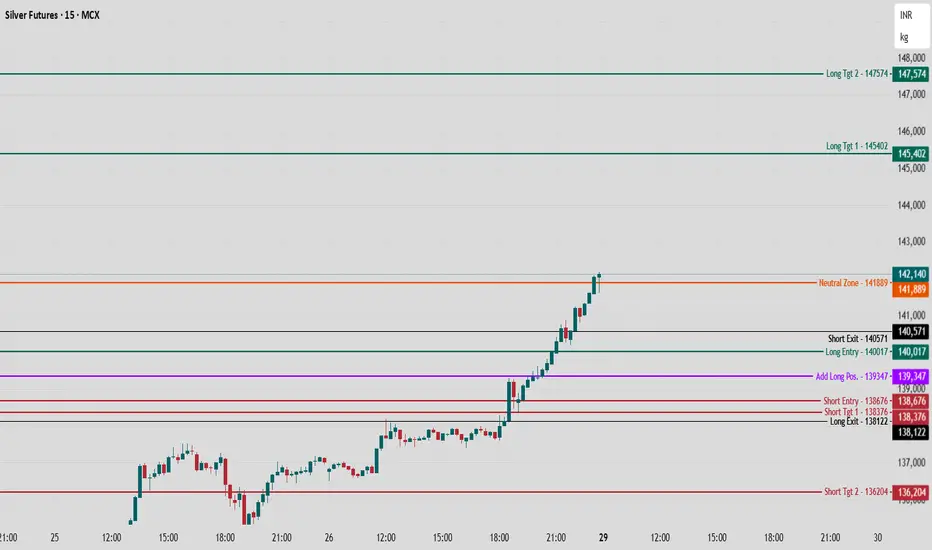
Silver MCX Dec. Future - Intraday Analysis - 29 Sept. 25 MCX:SILVER1!
Silver Futures have surged to 142,140, now testing major resistance after a steady rally and approaching a critical neutral decision zone.
Bullish (Long) Setup
Long Entry (140,017):
Initiate longs above 140,017 as rising momentum confirms reversal and break of previous resistance.
Additional exposure can be considered at 139,347 if dips are bought and price holds above this add-long level, supporting continuation of the uptrend.
Upside Targets:
145,402 (Target 1): Next mapped supply, logical for partial profit booking if momentum persists.
147,574 (Target 2): Higher resistance zone and extension target.
Stop Loss:
Tight stops below 139,000 to reduce risk, as breakdown signals failed bullish move.
Bearish (Short) Setup
Short Entry (138,676):
Short positions can be initiated below 138,676 if Silver reverses and breaks through fresh support, confirming bear control.
Downside Targets:
138,376 (Target 1): Prior bounce zone and first covering/profit area.
136,204 (Target 2): Deeper mapped extension for aggressive selling.
Stop Loss:
Shorts should be covered if Silver sustains above 140,017, minimizing drawdown on failed breakdowns.
Range/Neutral Logic
Neutral Zone (141,889):
Price near this pivot invites consolidation or choppy action; best to await breakout or breakdown outside the neutral range before committing major exposures.
Sustained action above 142,140 supports further buying, while slips below 141,889 hint at short-term reversal.
This setup ensures disciplined, risk-managed trading for both momentum and reversal participants in MCX Silver intraday.
Follow Chart Pathik on Day to Day update on Silver MCX Future.
Silver buy above 137520 tgt 139621 intrday stop loss ??Silver buy above 137520 tgt 139621 intrday stop loss 137330
Silver buy above 137520 tgt 139621 intrday stop loss 137330
Silver buy above 137520 tgt 139621 intrday stop loss 137330
Silver buy above 137520 tgt 139621 intrday stop loss 137330
Silver buy above 137520 tgt 139621 intrday stop loss 137330
Silver buy above 137520 tgt 139621 intrday stop loss 137330Silver buy above 137520 tgt 139621 intrday stop loss 137330Silver buy above 137520 tgt 139621 intrday stop loss 137330Silver buy above 137520 tgt 139621 intrday stop loss 137330Silver buy above 137520 tgt 139621 intrday stop loss 137330Silver buy above 137520 tgt 139621 intrday stop loss 137330Silver buy above 137520 tgt 139621 intrday stop loss 137330Silver buy above 137520 tgt 139621 intrday stop loss 137330Silver buy above 137520 tgt 139621 intrday stop loss 137330Silver buy above 137520 tgt 139621 intrday stop loss 137330

oil gold and silver9 24 2025 in this video I show the scalp trade for oil and I talked about some of the changes in gold and all so in silver I'm using some new equipment and I'm not sure if it's working correctly or not so if something looks wrong please send me a note.

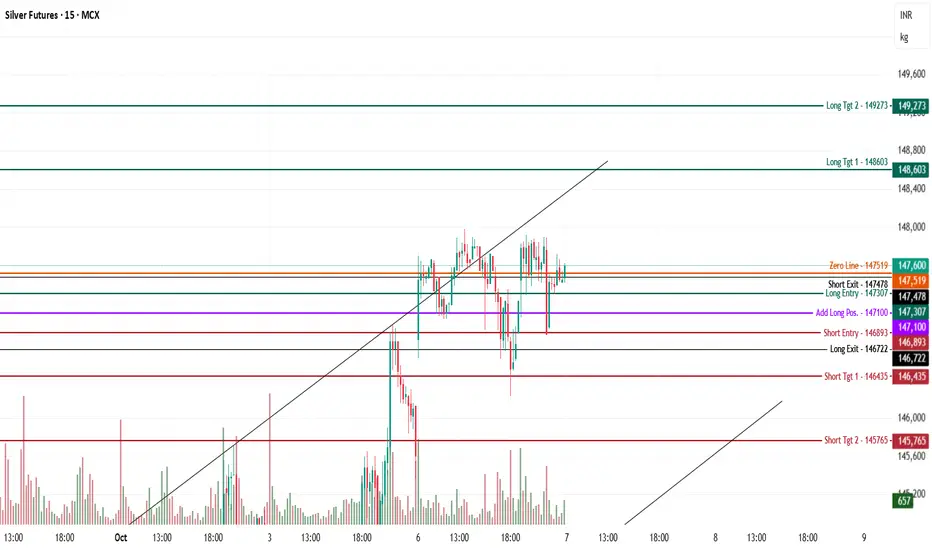
MCX Silver Futures – Intraday Analysis - 7th Oct., 25MCX:SILVER1!
Silver is trading at 147,600 and hovering right at the zero line (147,519), with price coiling in a narrow zone and recent whipsaws near both the long entry (147,307) and short exit (147,478) bands.
Bullish Scenario
Long Entry (147,307):
Initiate fresh longs above 147,307, as repeated dips have found support here and buyers are defending this pivot.
Consider adding further above 147,100 if higher lows persist and volume supports a potential breakout.
Upside Targets:
148,603 (Target 1): First mapped resistance and key profit booking area.
149,273 (Target 2): Extended bullish target if momentum remains strong.
Stop Loss:
Use below 146,893 (short entry zone) to minimize risk from failed breakouts.
Bearish Scenario
Short Entry (146,893):
Shorts are actionable below 146,893, defining a breakdown from recent support and a likely move lower.
Downside Targets:
146,435 (Target 1): Next bounce and potential covering/buyback level.
145,765 (Target 2): Mapped extension zone for further downside.
Stop Loss:
Cover if prices reclaim and sustain above 147,307 to avoid losses on failed breakdown.
Structure & Neutral Logic
Zero Line (147,519):
This is the current balance point—sustained holding above signals further buying and momentum setup, whereas persistent rejection or tight chop around this area raises risk of a correction back toward lower bands.
Wait for a clear break above 147,600 or below 146,893 for clean directional trades.
Silver10 6 2025 this is a follow-up for silver the market got to the 1.272 and at the time of this video there was a 2 bar reversal and normally I would consider exiting the market if I were already long on a two-bar reversal. I made a mistake in the video where I had to give my explanations which I am doing right now,,,,, I was explaining how markets move and then they'll range after the Market's been Trading in this case bullishly and I misstated because I a nice said that it was silver as my example and I meant to say that it was gold..... When gold made its all time high earlier this year it ranged for a period of time and we followed it and then it went to a new high and that's what I'm concerned about with silver even though it's not that far away from its all-time high. Be aware that my efforts are to show you how to get in to a market safely and get out of it before you lose your profit and I am aware that this is a form of scalping,,, so if you think the Market's going higher even though there's a two-bar reversal suggesting that it might correct a little bit before it goes higher then make sure you have stop the cover you and it certainly doesn't have to be where you got into the market on Friday in other words put in a stop that you can live with it may be and should be above where you got in before the market moved higher so you're only real the outcome may be that you have a market that made money but you gave some money back without losing capital and that's something you're going to do if you're trying to stay in the market longe. If I were to tell you what I really want to happen is that I want you to learn how to get in and out of a market without serious drawdown and when the market moves in your favorite enough if it looks good keep on trading it and make sure you don't give it all back
If you ask me what I think I think silver is going to make new highs but if I have a setup it's going to take me below my entry first then I'm going to get out of that market and watch it and a lot of times that's a good decision to make and the market ends up giving you a better entry anyway

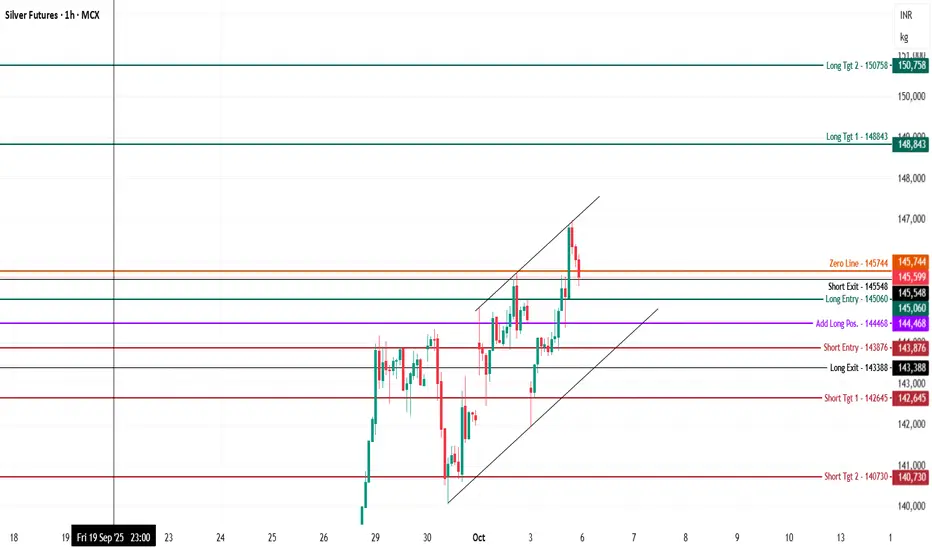
Silver Dec. Futures (MCX) – Intraday Analysis - 6th Oct., 2025MCX:SILVER1!
Silver is trading at 145,599, following a recent pullback from a rising wedge pattern near the upper channel boundary, currently testing the zero line level as support/resistance.
Bullish (Long) Setup
Long Entry (145,060):
Enter long above 145,060, confirming a bounce from the lower channel and support band, signaling buyers readiness to push higher.
Add more positions near 144,468 if dips are absorbed, sustaining higher lows.
Upside Targets:
148,843 (Target 1): The first major resistance and profit booking zone in the upward channel.
150,758 (Target 2): Projection target based on channel extension.
Stop Loss:
Stops should be kept below 143,388, corresponding to the lower wedge boundary and invalidating the bullish setup if broken.
Bearish (Short) Setup
Short Entry (143,876):
Initiate shorts below 143,876 upon breaching lower channel support, indicating sellers are in control.
Downside Targets:
142,645 (Target 1): Immediate support area, likely for short covering.
140,730 (Target 2): Deeper support target if momentum to the downside accelerates.
Stop Loss:
Cover shorts above 145,060 to protect against false breakdowns.
Technical Structure & Logic
The price is currently respecting a rising wedge pattern, with the zero line at 145,744 as a key pivot.
A break above the upper channel signals bullish continuation, while break below the wedge invites correction.
The zero line acts as a critical mid-channel point for sentiment balance.
LONG TERM VIEW FOR SILVERFor study purpose only. Silver is at a very interesting point , we may witness history in the making. Silver at the same time has been known to make a fool out of investors , so with a word of caution.

MCX Silver 48% and cont. gain in 2025 year INSANEThis year is phenomenal for critical metal Silver
it shines like no other trading near Strong Monthly R3 levels
Let's see make or break happen here!
⚠️ Disclaimer: This analysis is for educational purposes only and should not be considered financial advice. Always do your own research before making trading decisions.

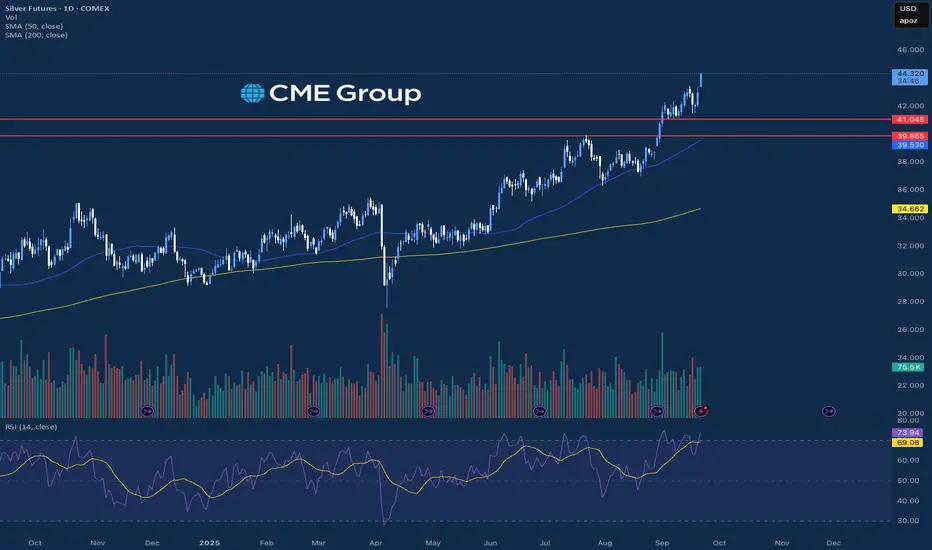
Precious Metals Lead Markets HigherThe resilience in the precious metals markets at this point can not be overstated with the sharp moves to the upside over the course of the year. After finishing the week on a strong note last week, Gold and Silver both traded higher again today and carved out a new all time high price with Silver leading the way trading up over 3%. Both of these markets have been trading in a technically “overbought” territory for most of September, and the markets have continued to go higher with the strength in the Euro relative to the Dollar.
Outside of the precious metals, the equity markets also traded marginally higher again today, and the S&P and Nasdaq were able to record a new all time high price today. There was little economic data released today, but there was news with NVIDIA about a $100 billion investment into OpenAI that helped boost the Nasdaq and other equity indices. For the rest of the week, there will be many key economic reports, especially GDP later in the week, that could add more volatility into these markets that are trading at elevated levels.
If you have futures in your trading portfolio, you can check out on CME Group data plans available that suit your trading needs tradingview.com/cme/
*CME Group futures are not suitable for all investors and involve the risk of loss. Copyright © 2023 CME Group Inc.
**All examples in this report are hypothetical interpretations of situations and are used for explanation purposes only. The views in this report reflect solely those of the author and not necessarily those of CME Group or its affiliated institutions. This report and the information herein should not be considered investment advice or the results of actual market experience.
Silver9 22 2025 there was a good trade on Silver last night. There's several things to think about including the buyers and the sellers the market went higher there's a chance if the market can take in breakout buyers then reverse the door a lot lower because of the structure. Trade would have occurred last night when most people wouldn't be looking at but last night the market moves above the clothes on Friday software may have told you that you're still on Friday.. The market was a great trade because the market opened and then went a little bit higher than the clothes on Friday and it moved into a very profitable trade no reverse of the market and if you had a stop just below your entry the market didn't take you out. I added a Fibonacci extension not everybody will know what that is but most people who are following will know what it is and I let the market get so the two which is the top of the extension and I would have used that to take my profits because my fear was that the smart money would drive the market higher and attract fires it's in reverse and take a substantial move lower which would take out the buyers because the market as bullish as it is is also potentially a reversal that will drive the market lower.... It doesn't have to be a lot lower but it's enough for the possibility of Monday's traders to be giving money back battle between buyers and sellers and I would use the extension to find my target. this can also happen in the middle of a night and your Market actually goes higher to give you a good profit but by the end of the night the market comes back and takes you out of your of your trade that you did early and then you're out of luck except if you have a stop the worse you're going to get is your stop which is small so I would have done that trade with the stop right below the two Farber reversal and I wouldn't have been greedy which is what I would have called myself at the marketing to complete reversal and you're doing this at night you don't want to be awake at night with the trade,

CHANDI CHANDI CHANDIChandi made classic triangle pattern on daily charts & its on the verge of breaking out of golden triangle .
Risk:Reward = 1:3
Could b bought above 93660 with short/long term stoploss & mentioned target.

Inflection Point in Silver Price Action Silver has been in a trend but consistently below this trendline. It has made its 3rd weekly close above which it has not done in 138 weeks-see description on chart

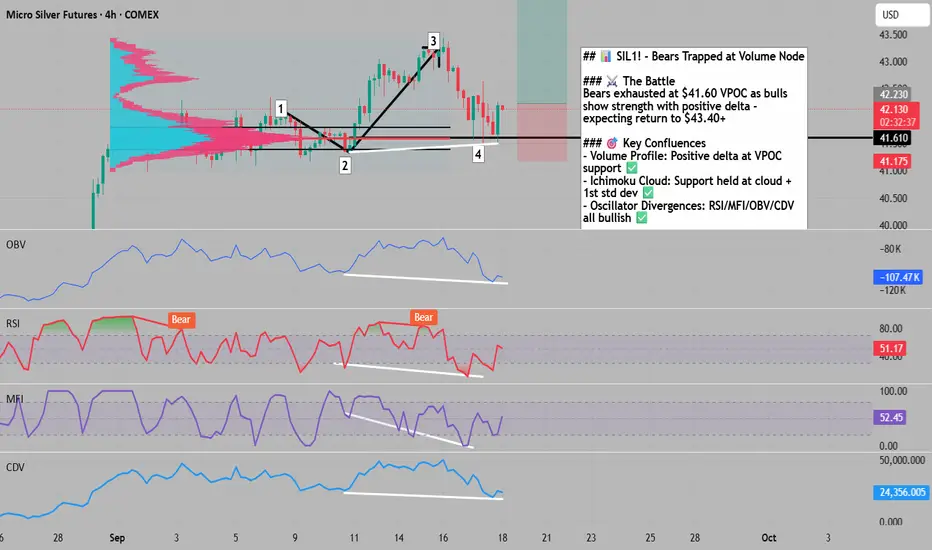
SIL1!: Bulls Reclaim Control at Volume Node - Bears Exhausted🎯 SIL1!: Bulls Reclaim Control at Volume Node - Bears Exhausted
The Market Participant Battle:
Bears who pushed silver from $43.40 (point 3) down to $41.61 (point 4) have been decisively beaten by bulls at a critical volume-weighted average price (VWAP) node. The exhaustion is evident through positive delta divergence and the first higher close in this entire decline sequence at point 2's turning zone. With RSI, MFI, OBV, and CDV all printing bullish divergences while price made a higher low, this setup suggests a powerful return move back toward the $43+ highs as trapped bears cover and new bulls enter at proven support.
Confluences:
Confluence 1: Volume Profile & Delta Divergence
The 4-hour volume footprint chart reveals critical market mechanics. At point 4, price returned precisely to the high-volume node (VPOC) where proven sellers from point 2 were expected. However, instead of continuation selling, we see positive delta prints and bullish imbalances on the recovery bar - the first time price closed higher than the previous bar during the entire 3-4 swing. This represents institutional accumulation at a key liquidity zone where bears expected continuation but found exhaustion.
Confluence 2: Ichimoku Cloud & Standard Deviation Return
The daily chart shows price returning to the first standard deviation from a significant origin point (the consolidation before the push to 3). The Ichimoku cloud structure remains bullish with price finding support at the cloud boundary. This mathematical mean reversion at a statistically significant level, combined with cloud support, creates a high-probability reversal zone that institutional algorithms recognize.
Confluence 3: Multiple Oscillator Divergences
The 4-hour chart displays clear bullish divergences across RSI, MFI, OBV, and CDV indicators. While price made a higher low at point 4 compared to point 2, all four oscillators printed lower lows. RSI shows oversold conditions with a "Bear" label, yet price structure suggests bear exhaustion. This quadruple divergence pattern historically precedes significant reversals in silver futures.
Web Research Findings:
- Technical Analysis: Silver futures show "strong buy" rating across multiple timeframes , with current consolidation around $43.30 after testing record highs
- Recent News/Earnings: Gold and silver futures retreated from record highs due to profit booking ahead of the Fed decision
- Analyst Sentiment: ING Think predicted silver would hover around $31, while UBS outlined a more bullish near-term target of $38-$40
- Data Releases & Economic Calendar: Fed cut rates by 25 basis points to 4-4.25% on September 17, the first cut since December 2024
- Interest Rate Impact: Markets betting on additional cuts in October and December with over 70% probability
Layman's Summary:
Silver just got a boost from the Fed's first rate cut of the year, making it cheaper to hold precious metals. The metal pulled back from near-record highs around $43 as traders took profits, but found strong support at $41.60 where big buyers stepped in. Technical indicators are flashing "oversold" just as the Fed signals more cuts coming - historically a powerful combination for silver rallies. With industrial demand from solar panels and EVs remaining strong, this temporary pullback looks like bears running out of steam rather than a trend change.
Machine Derived Information:
- Image 1: 4-hour volume footprint showing positive delta at VPOC support - Significance: Institutional accumulation visible at key level - AGREES ✔
- Image 2: Daily Ichimoku cloud with numbered swing points - Significance: Price respecting cloud support and mean reversion levels - AGREES ✔
- Image 3: 4-hour oscillator divergences across multiple indicators - Significance: Quadruple bullish divergence pattern confirming reversal - AGREES ✔
Actionable Machine Summary:
All three charts align perfectly: volume analysis shows buyers defeating sellers at a critical node, cloud structure confirms support holds, and oscillators scream oversold with divergences. The setup triggers when price reclaims $42.20 with volume, targeting $43.40 initially and $44+ on continuation. Risk is clearly defined below $41.50 where the thesis fails.
Conclusion:
Trade Prediction: SUCCESS
Confidence: High
The confluence of volume-based accumulation, mathematical mean reversion, oscillator divergences, and fundamental tailwinds from Fed easing creates a high-probability reversal setup. Bears who pressed their luck from $43.40 are now trapped as support held exactly where it should. With the Fed just beginning its easing cycle and industrial demand remaining robust, this pullback represents a gift for bulls who missed the initial rally. Risk/reward favors longs with 3:1 potential targeting the recent highs.
Speculative Silver target USD42 by November 2025Hello,
Its always a bit risky choosing a price target AND a timeframe, but here is mine, lets see how it unfolds.
Silver is looking like it is going to do a "short, sharp" correction, as the wave two correction (April to June 2025) was slow and complex. Then it will head for $42. The correction may be complete, or have a bit to go (as on my chart) before heading higher.
There is a chance that this last up wave will extend and elongate - as it is historically undervalued relative to gold and may be nearing a point where relative valuations will normalise quite quickly - see 1980 and 2011 when silver "take off." Lets see how it goes. Best of luck everyone. I'm in since $34.75 and will sell not based on silver price, but based on the gold silver ratio reverting to 50:1 or lower.

Silver Daily Channel After Breaking Above Major ResistanceI identified this channel at the beginning of August, and it has worked quite well for position trades to date. As daily fluctuations evolve, I may make minor adjustments to this channel using significant lows from the past, present, or future.
The following is my August video explaining the construction of the channel:
Micro Silver Futures
Ticker: SIL
Minimum fluctuation:
0.005 per troy ounce = $5.00
Disclaimer:
• What presented here is not a recommendation, please consult your licensed broker.
• Our mission is to create lateral thinking skills for every investor and trader, knowing when to take a calculated risk with market uncertainty and a bolder risk when opportunity arises.
CME Real-time Market Data help identify trading set-ups in real-time and express my market views. If you have futures in your trading portfolio, you can check out on CME Group data plans available that suit your trading needs tradingview.com/cme/

Silver (SIL1!): Bullish! Buy The Dip!Silver is at the highest its been since 2011.
There is no reason to short this market. A short term pullback should be seen as a long opportunity.
Price has taken the External Range Liquidity, and a move back to Internal Range Liquidity is naturally expected. The +FVG (blue) looks like a great place to look for high probability buys.
It is intersected by the old high, adding to the confluence of support at that level.
What do you think? Comment down below!
Disclaimer:
I do not provide personal investment advice and I am not a qualified licensed investment advisor.
All information found here, including any ideas, opinions, views, predictions, forecasts, commentaries, suggestions, expressed or implied herein, are for informational, entertainment or educational purposes only and should not be construed as personal investment advice. While the information provided is believed to be accurate, it may include errors or inaccuracies.
I will not and cannot be held liable for any actions you take as a result of anything you read here.
Conduct your own due diligence, or consult a licensed financial advisor or broker before making any and all investment decisions. Any investments, trades, speculations, or decisions made on the basis of any information found on this channel, expressed or implied herein, are committed at your own risk, financial or otherwise.

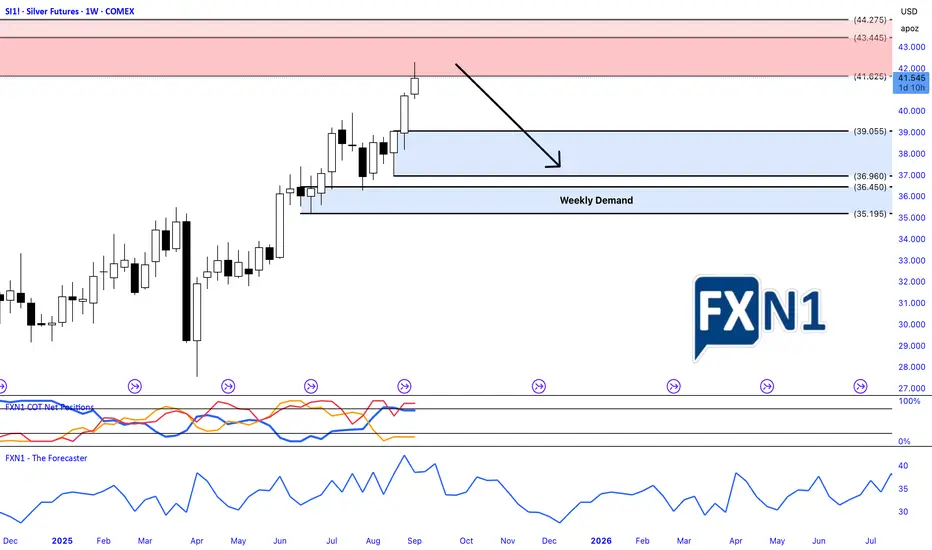
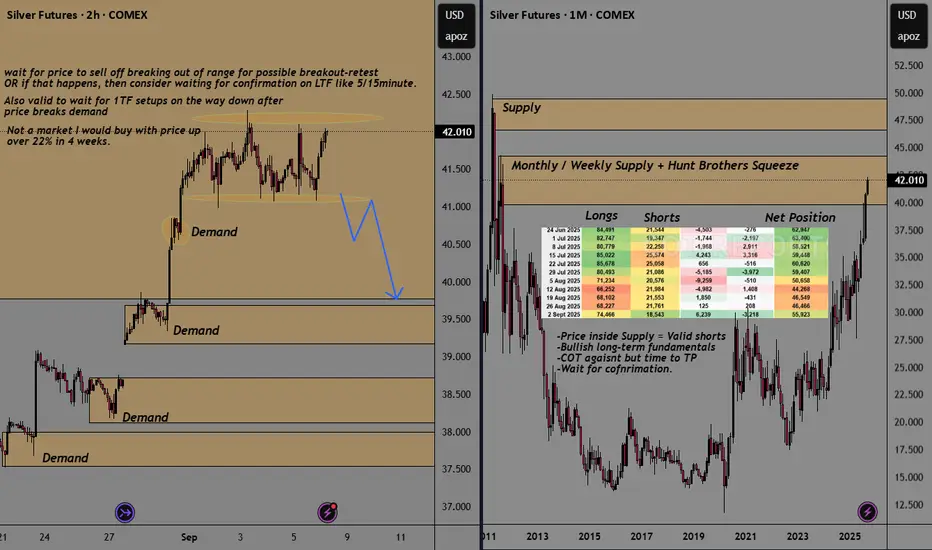
SILVER SI Supply-Demand AnalysisSee chart For Full Analysis
- Price inside HTF Weekly supply
- Strong Metals market, while I remain bullish long-term, I don't like the current
location price is in, and instead would like to see price sell off and see trader taking profits.
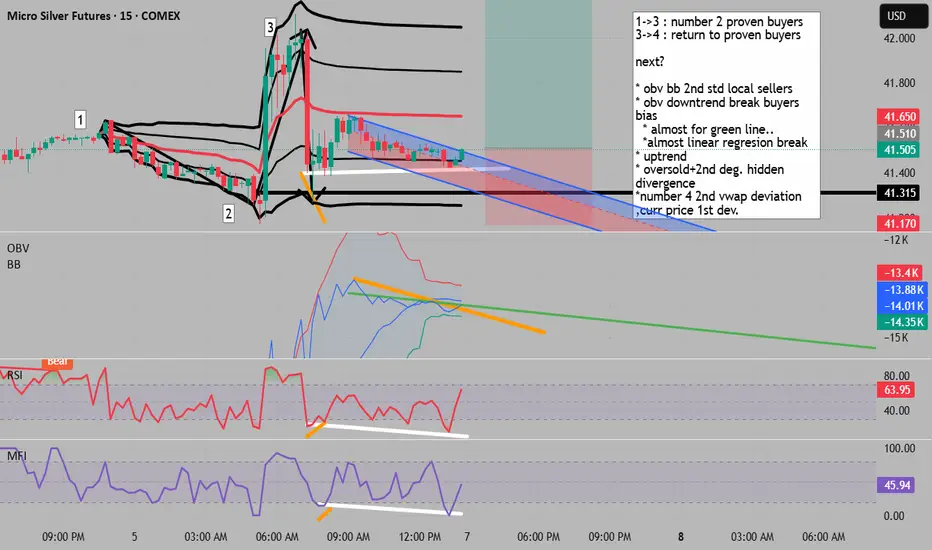
kind of late entry but solid theory for long1->3 : number 2 proven buyers
3->4 : return to proven buyers
next?
* obv bb 2nd std local sellers
* obv downtrend break buyers bias
* almost for green line..
*almost linear regresion break
* uptrend
* oversold+2nd deg. hidden divergence
*number 4 2nd vwap deviation ,curr price 1st dev.
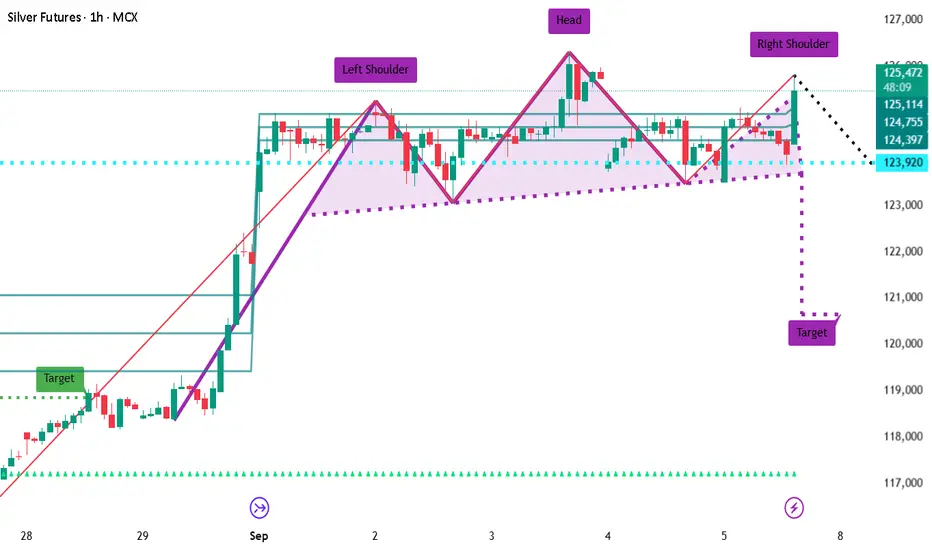
Head & shoulders pattern developed on SilverHead and Shoulder pattern on silver , it may fall and hit targets down side. cmp 125695 , target as mentioned on charts . lets see
Silver Trade Insights: Supply Levels, Seasonality and COTI have initiated a short position in silver as the price approaches a significant weekly supply zone. This entry was strategically determined based on an intra-day supply level identified on the daily chart. My outlook is primarily bearish, supported by seasonal patterns suggesting a potential downward trend. Additionally, non-commercial traders and institutional investors have been increasing their short positions, while retail traders continue to build long positions. I'm anticipating a possible trend reversal, but I also remain cautious of a retest of my designated supply area before any decisive move. As always, I recommend conducting thorough personal research before making any trading decisions.
✅ Please share your thoughts about Silver in the comments section below and HIT LIKE if you appreciate my analysis. Don't forget to FOLLOW ME; you will help us a lot with this small contribution.