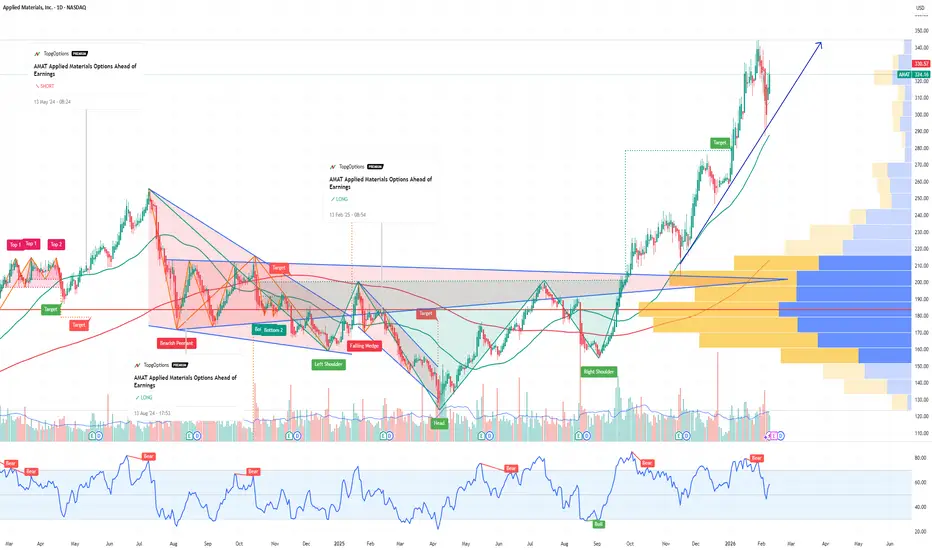
AMAT Applied Materials Options Ahead of EarningsIf you haven`t bought AMAT before the rally:
Now analyzing the options chain and the chart patterns of AMAT Applied Materials prior to the earnings report this week,
I would consider purchasing the 330usd strike price Calls with
an expiration date of 2026-3-20,
for a premium of approximately $25.0
Applied Materials, Inc.
No trades
Next report date
—
Report period
—
EPS estimate
—
Revenue estimate
—
8.30 EUR
6.07 B EUR
24.59 B EUR
791.14 M
About Applied Materials, Inc.
Sector
Industry
CEO
Gary E. Dickerson
Website
Headquarters
Santa Clara
Founded
1967
IPO date
Oct 5, 1972
Identifiers
3
ISIN US0382221051
Applied Materials, Inc. engages in provision of materials engineering solutions used to produce semiconductors. The firm also focuses on design, development, production, and servicing of the critical wafer fabrication tools used for customers to manufacture semiconductors. It operates through the following segments: Semiconductor Systems and Applied Global Services (AGS). The Semiconductor Systems segment includes designing, development, manufacturing and sale of equipment used to fabricate semiconductor chips referred to as integrated circuits. The AGS segment engages in provision of services, spares, and factory automation software to customer fabrication plants globally. The company was founded on November 10, 1967 and is headquartered in Santa Clara, CA.
Related stocks
AMAT: Pullback Within a Strong Uptrend Finds DemandAMAT is showing renewed demand as price pulls back toward key moving averages. The stock remains in a well-defined uptrend, characterized by higher highs and higher lows, with moving averages aligned bullishly and price holding above them—confirming underlying trend strength.
Applied Materials, Inc
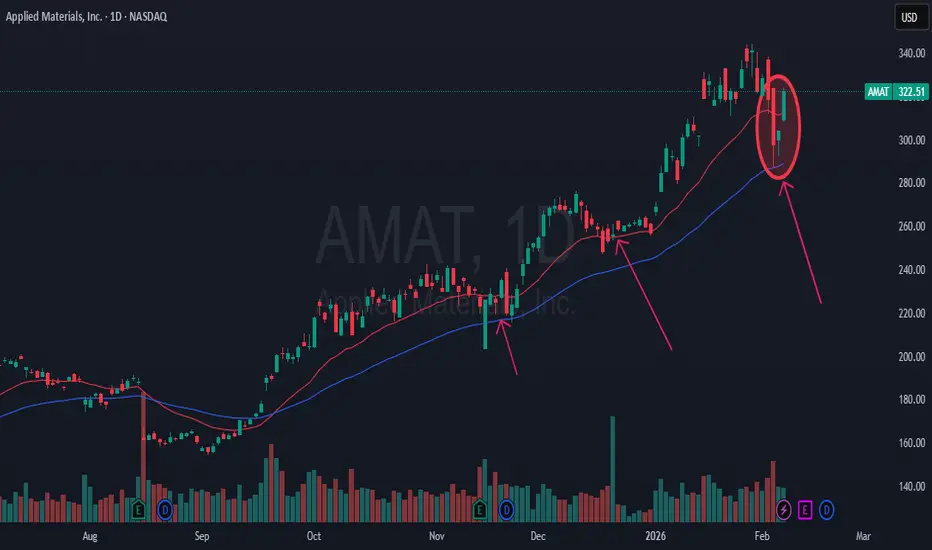
$AMAT: We are goood to continue the uptrend for meSupport worked, we can continue our uptrend, we see that the EMA200 worked well and acted as a support, and we have the uptrend continuing, still playing out

AMAT eyes on $228: Dual Fib zone ideal support for a Higher-LowAMAT has been lacking any direction for quite a while.
Dipped into a significant support zone at $227.70-227.99
Look for a clean bounce or a Break-n-Retest if dips below.
.
Previous Analysis that caught the EXACT BOTTOM:
Hit BOOST and FOLLOW for more such PRECISE and TIMELY charts.
=============

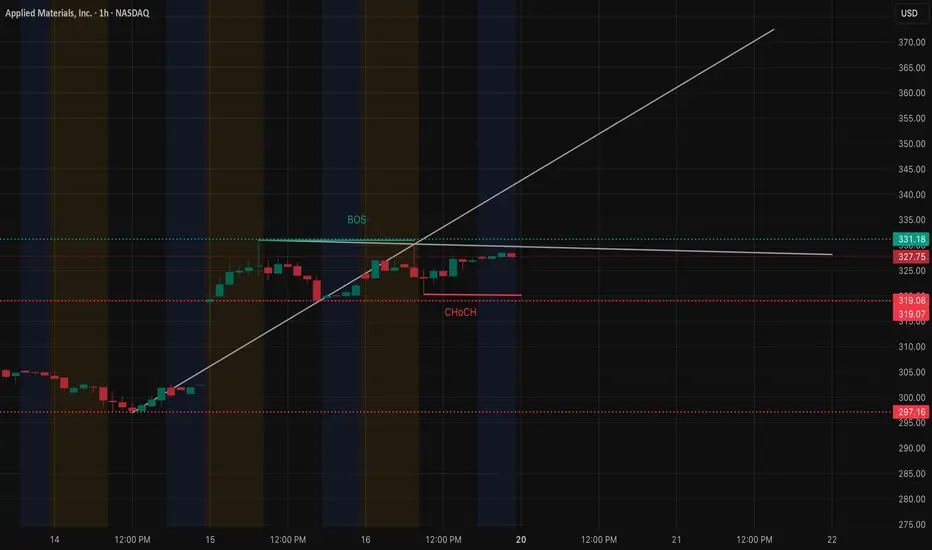
AMAT Weekly Outlook (Jan 20–23)Applied Materials (AMAT) — chip sector leader with strong activity.
Right now AMAT is in a bullish structure on the 1H, but price is starting to stall under a major resistance zone, so this week is more about breakout vs consolidation.
On the 1H, we had a clean CHoCH to the upside, followed by a st
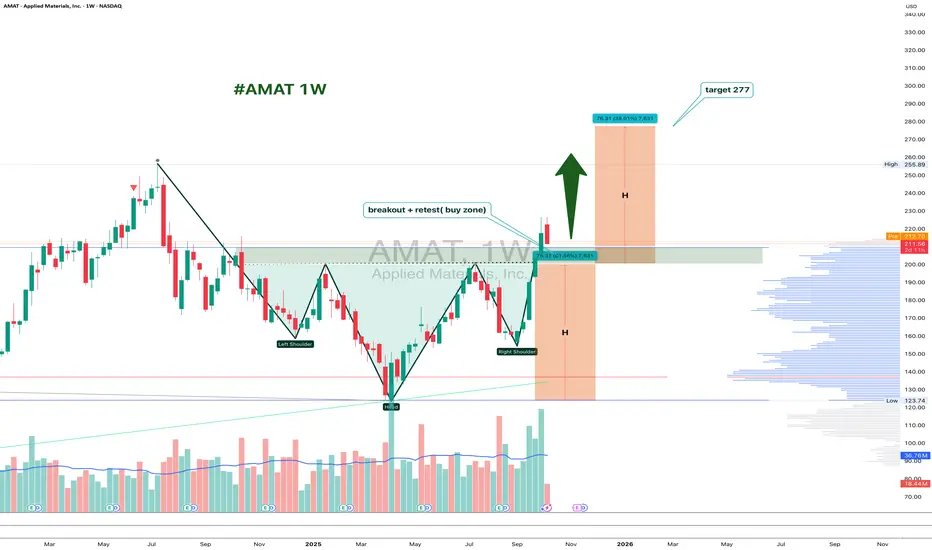
AMAT 1W: Retesting the Neckline Before the Next Move?On the weekly chart, Applied Materials (AMAT) has completed a clean inverted head and shoulders breakout around $226, and is now pulling back to retest the neckline zone near $200–211.
This area acts as strong support. If buyers defend it, the bullish pattern stays valid, with a projected target
$AMAT Tradespoon – Long Setup $281.64Tradespoon model signals a long bias for NASDAQ:AMAT . Predicted range: $281.64–$298.34. Trend: +0.19%, with strong upside probability as semiconductor capex momentum builds. NASDAQ:AMAT

AMAT DIC 2025AMAT rejected 252-255 distribution; absorption 235.
Bull T:340. Bear T:220-200 then 180.
#AMAT #SOXX #SMH #QQQ #SPY

AMAT - Bullish building blocks applied!=======
Volume
=======
-Stable
==========
Price Action
==========
- downtrend line of one year is broken in Jun 2025
- supported at $150 region for and rebounded at trendline
- Change of trend observed
=========
Oscillators
=========
- Ichimoku, price above cloud, kumo turns green, ba

AMAT IDEACurrent demand level is a weak one and we can expect that this level will induce early buyers which can get wiped out when we set another bearish leg down to the next demand level where we can look to buy from.

See all ideas
Summarizing what the indicators are suggesting.
Neutral
SellBuy
Strong sellStrong buy
Strong sellSellNeutralBuyStrong buy
Neutral
SellBuy
Strong sellStrong buy
Strong sellSellNeutralBuyStrong buy
Neutral
SellBuy
Strong sellStrong buy
Strong sellSellNeutralBuyStrong buy
An aggregate view of professional's ratings.
Neutral
SellBuy
Strong sellStrong buy
Strong sellSellNeutralBuyStrong buy
Neutral
SellBuy
Strong sellStrong buy
Strong sellSellNeutralBuyStrong buy
Neutral
SellBuy
Strong sellStrong buy
Strong sellSellNeutralBuyStrong buy
Displays a symbol's price movements over previous years to identify recurring trends.
AP2A
Applied Materials, Inc. 4.35% 01-APR-2047Yield to maturity
5.30%
Maturity date
Apr 1, 2047
AMAT4993873
Applied Materials, Inc. 2.75% 01-JUN-2050Yield to maturity
5.26%
Maturity date
Jun 1, 2050
AMAT.GH
Applied Materials, Inc. 5.85% 15-JUN-2041Yield to maturity
5.06%
Maturity date
Jun 15, 2041
AMAT6177155
Applied Materials, Inc. 4.6% 15-JAN-2036Yield to maturity
4.63%
Maturity date
Jan 15, 2036
US38222AK1
Applied Materials, Inc. 5.1% 01-OCT-2035Yield to maturity
4.62%
Maturity date
Oct 1, 2035
AMAT6177154
Applied Materials, Inc. 4.0% 15-JAN-2031Yield to maturity
4.05%
Maturity date
Jan 15, 2031
AMAT4993872
Applied Materials, Inc. 1.75% 01-JUN-2030Yield to maturity
4.01%
Maturity date
Jun 1, 2030
AMAT5827120
Applied Materials, Inc. 4.8% 15-JUN-2029Yield to maturity
3.84%
Maturity date
Jun 15, 2029
US38222AL9
Applied Materials, Inc. 3.3% 01-APR-2027Yield to maturity
3.77%
Maturity date
Apr 1, 2027
See all 1AMAT bonds
Frequently Asked Questions
The current price of 1AMAT is 301.10 EUR — it has increased by 10.27% in the past 24 hours. Watch Applied Materials, Inc. stock price performance more closely on the chart.
Depending on the exchange, the stock ticker may vary. For instance, on MIL exchange Applied Materials, Inc. stocks are traded under the ticker 1AMAT.
1AMAT stock has risen by 14.95% compared to the previous week, the month change is a 16.32% rise, over the last year Applied Materials, Inc. has showed a 73.30% increase.
We've gathered analysts' opinions on Applied Materials, Inc. future price: according to them, 1AMAT price has a max estimate of 395.96 EUR and a min estimate of 219.04 EUR. Watch 1AMAT chart and read a more detailed Applied Materials, Inc. stock forecast: see what analysts think of Applied Materials, Inc. and suggest that you do with its stocks.
1AMAT reached its all-time high on Feb 13, 2026 with the price of 315.15 EUR, and its all-time low was 109.10 EUR and was reached on Apr 7, 2025. View more price dynamics on 1AMAT chart.
See other stocks reaching their highest and lowest prices.
See other stocks reaching their highest and lowest prices.
1AMAT stock is 13.98% volatile and has beta coefficient of 1.53. Track Applied Materials, Inc. stock price on the chart and check out the list of the most volatile stocks — is Applied Materials, Inc. there?
Today Applied Materials, Inc. has the market capitalization of 237.32 B, it has increased by 2.88% over the last week.
Yes, you can track Applied Materials, Inc. financials in yearly and quarterly reports right on TradingView.
Applied Materials, Inc. is going to release the next earnings report on May 14, 2026. Keep track of upcoming events with our Earnings Calendar.
1AMAT earnings for the last quarter are 2.01 EUR per share, whereas the estimation was 1.86 EUR resulting in a 7.84% surprise. The estimated earnings for the next quarter are 2.23 EUR per share. See more details about Applied Materials, Inc. earnings.
Applied Materials, Inc. revenue for the last quarter amounts to 5.92 B EUR, despite the estimated figure of 5.80 B EUR. In the next quarter, revenue is expected to reach 6.42 B EUR.
1AMAT net income for the last quarter is 1.71 B EUR, while the quarter before that showed 1.64 B EUR of net income which accounts for 3.99% change. Track more Applied Materials, Inc. financial stats to get the full picture.
Yes, 1AMAT dividends are paid quarterly. The last dividend per share was 0.40 EUR. As of today, Dividend Yield (TTM)% is 0.50%. Tracking Applied Materials, Inc. dividends might help you take more informed decisions.
Applied Materials, Inc. dividend yield was 0.78% in 2025, and payout ratio reached 20.55%. The year before the numbers were 0.81% and 17.66% correspondingly. See high-dividend stocks and find more opportunities for your portfolio.
As of Feb 15, 2026, the company has 36.5 K employees. See our rating of the largest employees — is Applied Materials, Inc. on this list?
EBITDA measures a company's operating performance, its growth signifies an improvement in the efficiency of a company. Applied Materials, Inc. EBITDA is 7.47 B EUR, and current EBITDA margin is 31.39%. See more stats in Applied Materials, Inc. financial statements.
Like other stocks, 1AMAT shares are traded on stock exchanges, e.g. Nasdaq, Nyse, Euronext, and the easiest way to buy them is through an online stock broker. To do this, you need to open an account and follow a broker's procedures, then start trading. You can trade Applied Materials, Inc. stock right from TradingView charts — choose your broker and connect to your account.
Investing in stocks requires a comprehensive research: you should carefully study all the available data, e.g. company's financials, related news, and its technical analysis. So Applied Materials, Inc. technincal analysis shows the strong buy rating today, and its 1 week rating is strong buy. Since market conditions are prone to changes, it's worth looking a bit further into the future — according to the 1 month rating Applied Materials, Inc. stock shows the buy signal. See more of Applied Materials, Inc. technicals for a more comprehensive analysis.
If you're still not sure, try looking for inspiration in our curated watchlists.
If you're still not sure, try looking for inspiration in our curated watchlists.