Bullish on Amazon as the tide turns backAmazon’s recent job cuts aren’t a sign of weakness, they’re a strategic recalibration. The company is shifting from broad expansion to focused execution. In the AI era, scale isn’t just about size, it’s about precision.
Amazon has trimmed roles across Alexa, devices, and some corporate functions. T
Key facts today
Next report date
—
Report period
—
EPS estimate
—
Revenue estimate
—
6.15 EUR
57.23 B EUR
616.25 B EUR
9.60 B
About Amazon.com, Inc.
Sector
Industry
CEO
Andrew R. Jassy
Website
Headquarters
Seattle
Founded
1994
ISIN
US0231351067
FIGI
BBG00J7K8ZB8
Amazon.com, Inc. is a multinational technology company, which engages in the provision of online retail shopping services. It operates through the following segments: North America, International, and Amazon Web Services (AWS). The North America segment offers retail sale of consumer products, including from sellers, advertising, and subscriptions services through North America-focused online and physical stores. The International segment focuses on retail sale of consumer products, including from sellers, advertising, and subscription services through internationally-focused online stores. The AWS segment is composed of global sales of compute, storage, database, and other services for start-ups, enterprises, government agencies, and academic institutions. The company was founded by Jeffrey P. Bezos in July 1994 and is headquartered in Seattle, WA.
Related stocks
AMAZON flashing a massive 5-year Sell Signal.More than 5 months ago (May 28, see chart below), we gave a strong buy signal on Amazon Inc. (AMZN), which last Friday hit our $255 Target:
This time we come across a massive Sell Signal on the 1W time-frame as the price hit (and is so far being rejected on) the 5-year Higher Highs trend-line t

AMZN — Earnings Base Case: Short-Term Correction Before Next LegAmazon reports earnings tomorrow, and expectations look well-balanced. Fundamentally, the base case suggests in-line results near guidance — roughly $177–$178B revenue and ~$18B operating income. AWS growth likely holds steady around 17–18% YoY, and Ads should remain strong but may decelerate slight

20+ Stocks for November: Your Ultimate Investing Radar📅 October is wrapped up, and a new month always means a new chapter on the charts.
Monthly closes reveal which breakouts are real, not temporary spikes, but clear signs that investors are willing to pay higher prices than before.
📊 I’m looking for those moments where the market proves it has change

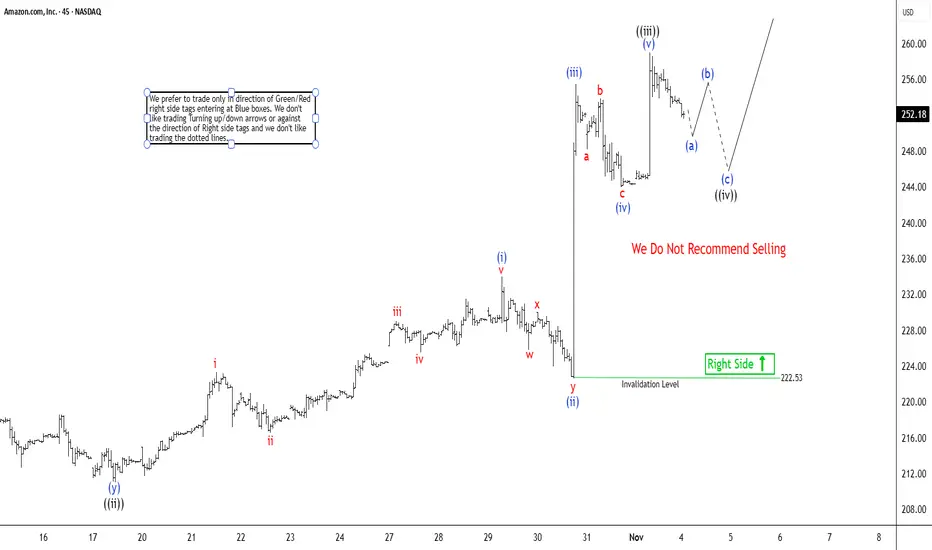
Amazon (AMZN) Impulse Pattern Remains IncompleteThe Short-Term Elliott Wave outlook from the October 11, 2025 low remains constructive, unfolding as a five-wave impulsive structure. From that low, wave ((i)) advanced and concluded at $222, followed by a corrective pullback in wave ((ii)), which bottomed at $211.03, as illustrated in the 45-minute
Stocks AmazonPDH/L Strategy with specific patterns that can give us an edge whjile fighting this war zone everyday.

Anatomy of a Breakaway Gap & What Happens NextAMZN is an excellent example of a Breakaway gap due to improvement of the company's fundamentals. The prior fundamental level is clearly defined on the chart and easy to see. The new fundamental level has not yet been fully established and will begin to form over the next few weeks.
Even if there

Why Your Next Trade Means Nothing
🧠 The Notebook Process #2 — Understanding the True Nature of Trading.
Some laws govern everything we do, and trading is no exception, even if it often feels like pure chaos.
Every tick looks random. Every trade feels unique. Yet beneath that noise, a hidden law quietly shapes your results. It’

AMAZONAMAZON has done exactly what we expected, now we will wait for correction to finish in this week for further upside.
Disclosure: We are part of Trade Nation's Influencer program and receive a monthly fee for using their TradingView charts in our analysis.

Amazon (AMZN): Ready for a New Breakout!Amazon isn’t just delivering packages — it’s delivering earnings surprises and a chart breakout too! 😎
After reporting strong Q3 earnings on 30 Oct 2025 , AMZN’s chart popped with a clean cup & handle breakout on 31 Oct 2025 — just in time for a bullish Halloween rally 🎃🐂
💰 Earnings Highligh

See all ideas
Summarizing what the indicators are suggesting.
Neutral
SellBuy
Strong sellStrong buy
Strong sellSellNeutralBuyStrong buy
Neutral
SellBuy
Strong sellStrong buy
Strong sellSellNeutralBuyStrong buy
Neutral
SellBuy
Strong sellStrong buy
Strong sellSellNeutralBuyStrong buy
An aggregate view of professional's ratings.
Neutral
SellBuy
Strong sellStrong buy
Strong sellSellNeutralBuyStrong buy
Neutral
SellBuy
Strong sellStrong buy
Strong sellSellNeutralBuyStrong buy
Neutral
SellBuy
Strong sellStrong buy
Strong sellSellNeutralBuyStrong buy
Displays a symbol's price movements over previous years to identify recurring trends.
US23135CK0
Amazon.com, Inc. 4.1% 13-APR-2062Yield to maturity
5.47%
Maturity date
Apr 13, 2062
AMZN4996701
Amazon.com, Inc. 2.7% 03-JUN-2060Yield to maturity
5.47%
Maturity date
Jun 3, 2060
US23135CC8
Amazon.com, Inc. 3.25% 12-MAY-2061Yield to maturity
5.47%
Maturity date
May 12, 2061
US23135CJ3
Amazon.com, Inc. 3.95% 13-APR-2052Yield to maturity
5.44%
Maturity date
Apr 13, 2052
AMZN4531868
Amazon.com, Inc. 4.25% 22-AUG-2057Yield to maturity
5.43%
Maturity date
Aug 22, 2057
AMZN5182959
Amazon.com, Inc. 3.1% 12-MAY-2051Yield to maturity
5.41%
Maturity date
May 12, 2051
AMZN4531866
Amazon.com, Inc. 4.05% 22-AUG-2047Yield to maturity
5.41%
Maturity date
Aug 22, 2047
US23135BT2
Amazon.com, Inc. 2.5% 03-JUN-2050Yield to maturity
5.40%
Maturity date
Jun 3, 2050
US23135AQ9
Amazon.com, Inc. 4.95% 05-DEC-2044Yield to maturity
5.22%
Maturity date
Dec 5, 2044
AMZN5182958
Amazon.com, Inc. 2.875% 12-MAY-2041Yield to maturity
5.13%
Maturity date
May 12, 2041
AMZN4531864
Amazon.com, Inc. 3.875% 22-AUG-2037Yield to maturity
4.79%
Maturity date
Aug 22, 2037
See all 1AMZN bonds
Curated watchlists where 1AMZN is featured.


Frequently Asked Questions
The current price of 1AMZN is 217.10 EUR — it has decreased by −1.03% in the past 24 hours. Watch Amazon.com, Inc. stock price performance more closely on the chart.
Depending on the exchange, the stock ticker may vary. For instance, on MIL exchange Amazon.com, Inc. stocks are traded under the ticker 1AMZN.
1AMZN stock has risen by 9.58% compared to the previous week, the month change is a 14.83% rise, over the last year Amazon.com, Inc. has showed a 20.69% increase.
We've gathered analysts' opinions on Amazon.com, Inc. future price: according to them, 1AMZN price has a max estimate of 296.13 EUR and a min estimate of 209.03 EUR. Watch 1AMZN chart and read a more detailed Amazon.com, Inc. stock forecast: see what analysts think of Amazon.com, Inc. and suggest that you do with its stocks.
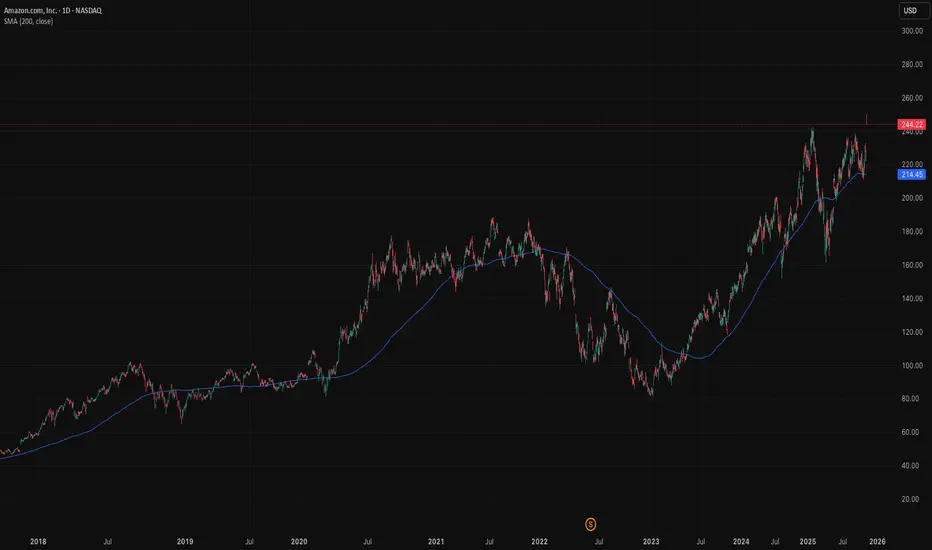
1AMZN reached its all-time high on Feb 4, 2025 with the price of 233.70 EUR, and its all-time low was 48.20 EUR and was reached on Nov 21, 2017. View more price dynamics on 1AMZN chart.
See other stocks reaching their highest and lowest prices.
See other stocks reaching their highest and lowest prices.
1AMZN stock is 2.26% volatile and has beta coefficient of 1.36. Track Amazon.com, Inc. stock price on the chart and check out the list of the most volatile stocks — is Amazon.com, Inc. there?
Today Amazon.com, Inc. has the market capitalization of 2.32 T, it has increased by 3.35% over the last week.
Yes, you can track Amazon.com, Inc. financials in yearly and quarterly reports right on TradingView.
Amazon.com, Inc. is going to release the next earnings report on Jan 29, 2026. Keep track of upcoming events with our Earnings Calendar.
1AMZN earnings for the last quarter are 1.66 EUR per share, whereas the estimation was 1.34 EUR resulting in a 24.34% surprise. The estimated earnings for the next quarter are 1.70 EUR per share. See more details about Amazon.com, Inc. earnings.
Amazon.com, Inc. revenue for the last quarter amounts to 153.54 B EUR, despite the estimated figure of 151.62 B EUR. In the next quarter, revenue is expected to reach 183.69 B EUR.
1AMZN net income for the last quarter is 18.06 B EUR, while the quarter before that showed 15.42 B EUR of net income which accounts for 17.10% change. Track more Amazon.com, Inc. financial stats to get the full picture.
No, 1AMZN doesn't pay any dividends to its shareholders. But don't worry, we've prepared a list of high-dividend stocks for you.
As of Nov 6, 2025, the company has 1.56 M employees. See our rating of the largest employees — is Amazon.com, Inc. on this list?
EBITDA measures a company's operating performance, its growth signifies an improvement in the efficiency of a company. Amazon.com, Inc. EBITDA is 120.73 B EUR, and current EBITDA margin is 19.15%. See more stats in Amazon.com, Inc. financial statements.
Like other stocks, 1AMZN shares are traded on stock exchanges, e.g. Nasdaq, Nyse, Euronext, and the easiest way to buy them is through an online stock broker. To do this, you need to open an account and follow a broker's procedures, then start trading. You can trade Amazon.com, Inc. stock right from TradingView charts — choose your broker and connect to your account.
Investing in stocks requires a comprehensive research: you should carefully study all the available data, e.g. company's financials, related news, and its technical analysis. So Amazon.com, Inc. technincal analysis shows the buy rating today, and its 1 week rating is strong buy. Since market conditions are prone to changes, it's worth looking a bit further into the future — according to the 1 month rating Amazon.com, Inc. stock shows the buy signal. See more of Amazon.com, Inc. technicals for a more comprehensive analysis.
If you're still not sure, try looking for inspiration in our curated watchlists.
If you're still not sure, try looking for inspiration in our curated watchlists.