NVDA Earnings, FOMC Minutes, US Non-Farm OH MY!!!All eyes on NVDA and earnings - they matter (a lot)
More important than a beat or miss is the price action around NVDA earnings
-bulls have a long ways to go to reclaim all-time highs
-bears have pressured NVDA enough that it seems like major support could break
FOMC Minutes today
-CME Fed Watch
Next report date
—
Report period
—
EPS estimate
—
Revenue estimate
—
7.45 EUR
3.62 B EUR
22.78 B EUR
311.66 M
About Constellation Energy Corporation
Sector
Industry
CEO
Joseph Dominguez
Website
Headquarters
Baltimore
Founded
1960
ISIN
US21037T1097
FIGI
BBG01TNXCNZ5
Constellation Energy Corp. engages in the generation, supply, and marketing of clean electricity, and renewable energy products and solutions. The firm also offers wholesale energy, retail products and services. It operates under the following geographical segments: Mid-Atlantic, Midwest, New York, Electric Reliability Council of Texas (ERCOT), and Other Power Regions Segment. The company was founded in 1960 and is headquartered in Baltimore, MD.
Related stocks

NASDAQ: CEG — Strong Rebound from Support, Uptrend Still Intact?On the daily chart, CEG found solid support and began to rebound.
The September price action shows a clear higher high, higher low structure — confirming a healthy uptrend. The upward trendline (green) continues to act as reliable dynamic support.
In October, the stock broke above the previou

Constellation Energy Back Up to $350CEG is on major support and *likely* to rise back up to $350 and above. That would be the next major support if it gets above.
Good luck!

Constellation Energy CEG Clean Energy Utility Leader BUYConstellation Energy is the largest producer of carbon-free energy in the U.S., leading in nuclear, wind, solar, and hydro power generation. With utilities shifting to renewable solutions, CEG offers investors a stable yet growth-oriented play on the clean energy transition.
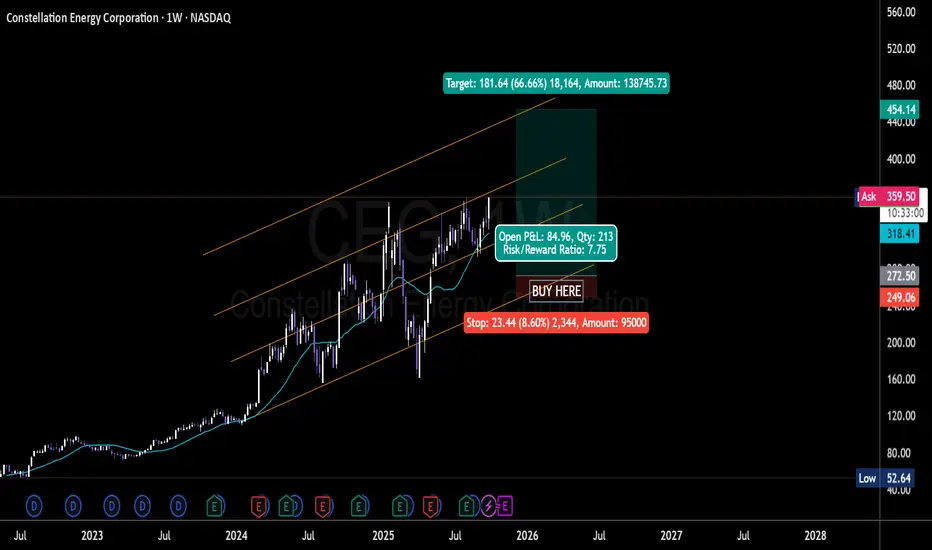
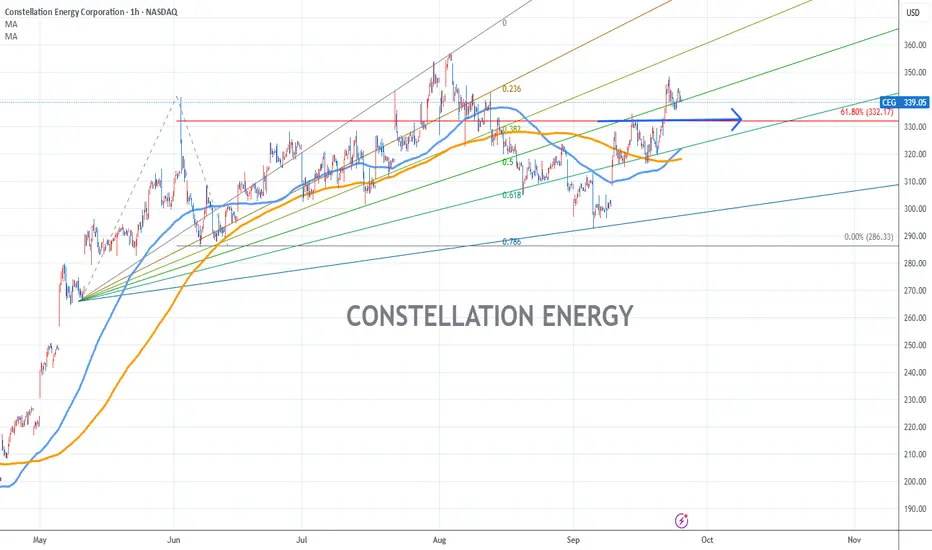
Constellation Energy Chart Fibonacci Analysis 092425Trading Idea
1) Find a FIBO slingshot
2) Check FIBO 61.80% level
3) Entry Point > 332/61.80%
Chart time frame:B
A) 15 min(1W-3M)
B) 1 hr(3M-6M)
C) 4 hr(6M-1year)
D) 1 day(1-3years)
Stock progress:A
A) Keep rising over 61.80% resistance
B) 61.80% resistance
C) 61.80% support
D) Hit the bottom
E)
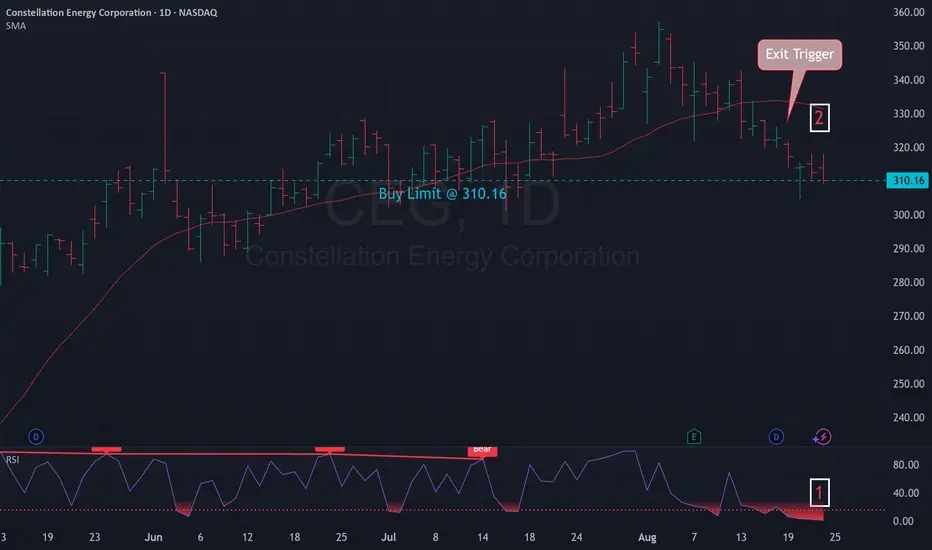
Mean Reversion Setup: CEG1. RSI in oversold region
2. Price likely to rebound back the the mean
Trade Rules:
Entry Trigger - RSI has cross below oversold region, enter limit buy at close price
Exit Trigger - Close at market when close price cross above exit trigger (Red Line)
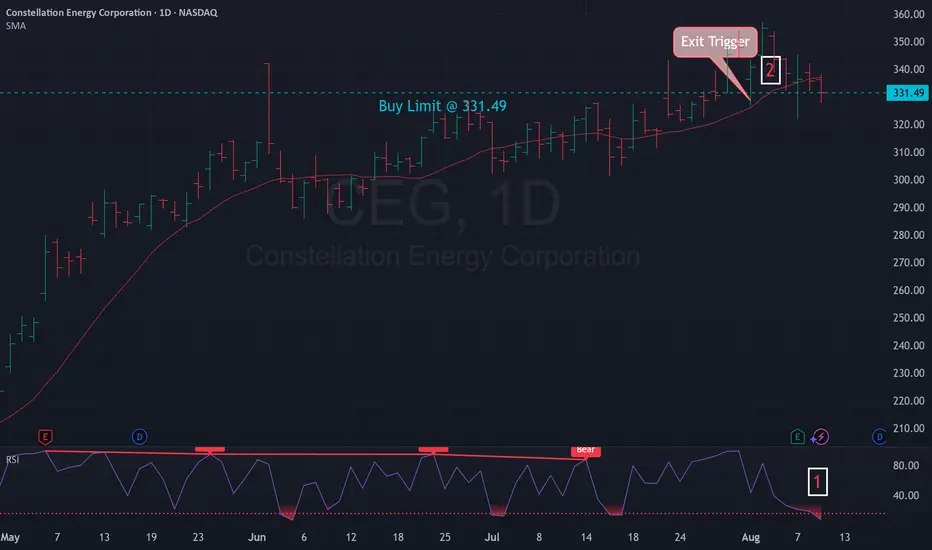
Mean Reversion Setup: CEG1. RSI in oversold region
2. Price likely to rebound back the the mean
Trade Rules:
Entry Trigger - RSI has cross below oversold region, enter limit buy at close price
Exit Trigger - Close at market when close price cross above exit trigger (Red Line)
Comeback for Constellation Energy?Constellation Energy has been powering down for the last month, but now some traders may think the electricity stock is ready for a comeback.
The first pattern on today’s chart is the weekly close of $297.49 on May 23. CEG tested and held that zone several times in early June. Prices returned to th

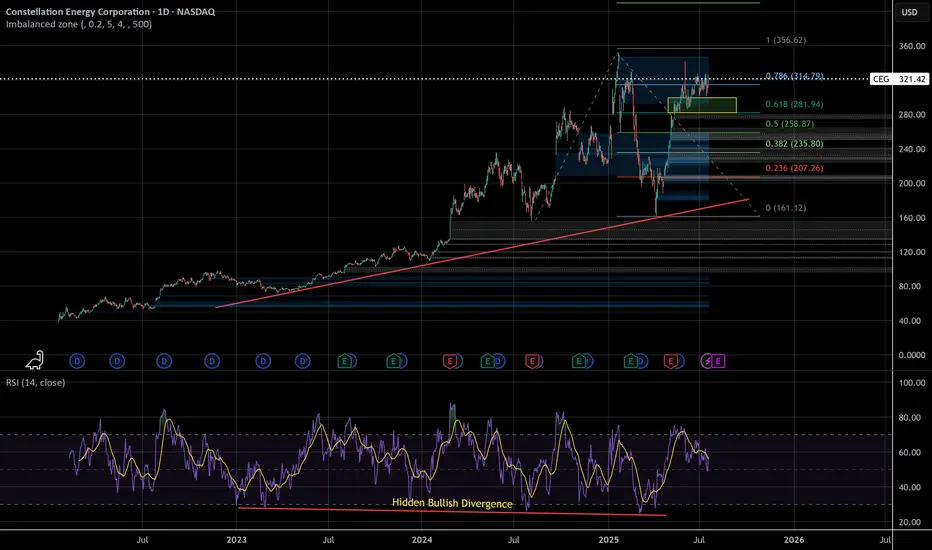
Great looking setupI see no bearish divergence, with hidden bullish divergence forming. Waiting for a dip below the current support for a buy, this looks great to me personally.
This also fits in with the general narrative of nuclear power being on the rise, it's about time.
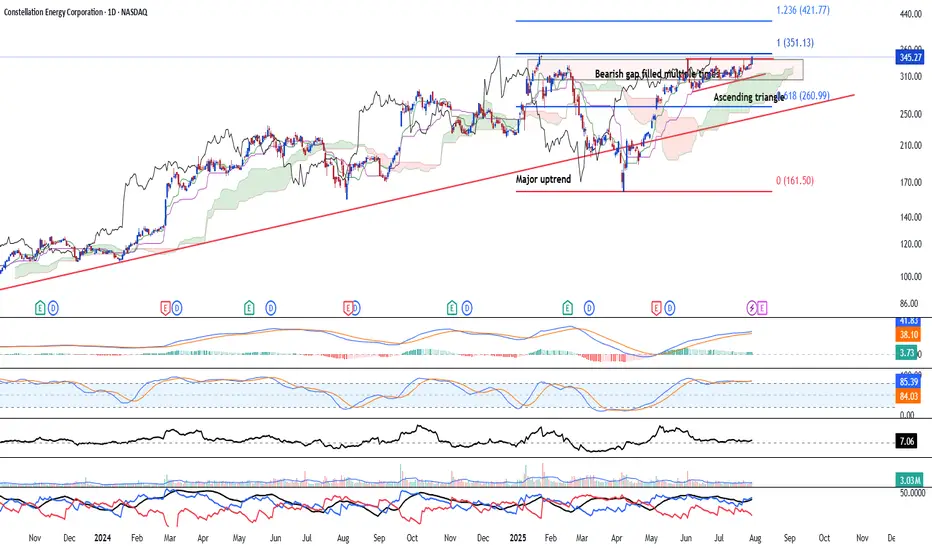
Upside break likelyNASDAQ:CEG Constellation Energy Corp (US: CEG) is likely to break above after the bearish gap has been filled multiple times and closes higher. Ascending triangle formation is likely to see bullish continuation to the upside and major uptrend remain intact since its inception. Volume remain health
See all ideas
Summarizing what the indicators are suggesting.
Neutral
SellBuy
Strong sellStrong buy
Strong sellSellNeutralBuyStrong buy
Neutral
SellBuy
Strong sellStrong buy
Strong sellSellNeutralBuyStrong buy
Neutral
SellBuy
Strong sellStrong buy
Strong sellSellNeutralBuyStrong buy
An aggregate view of professional's ratings.
Neutral
SellBuy
Strong sellStrong buy
Strong sellSellNeutralBuyStrong buy
Neutral
SellBuy
Strong sellStrong buy
Strong sellSellNeutralBuyStrong buy
Neutral
SellBuy
Strong sellStrong buy
Strong sellSellNeutralBuyStrong buy
Frequently Asked Questions
The current price of 1CEG is 292.05 EUR — it has decreased by −7.11% in the past 24 hours. Watch Constellation Energy Corporation stock price performance more closely on the chart.
Depending on the exchange, the stock ticker may vary. For instance, on MIL exchange Constellation Energy Corporation stocks are traded under the ticker 1CEG.
1CEG stock has risen by 6.49% compared to the previous week, the month change is a −5.58% fall, over the last year Constellation Energy Corporation has showed a 54.34% increase.
We've gathered analysts' opinions on Constellation Energy Corporation future price: according to them, 1CEG price has a max estimate of 414.34 EUR and a min estimate of 303.39 EUR. Watch 1CEG chart and read a more detailed Constellation Energy Corporation stock forecast: see what analysts think of Constellation Energy Corporation and suggest that you do with its stocks.
1CEG reached its all-time high on Oct 16, 2025 with the price of 348.70 EUR, and its all-time low was 189.20 EUR and was reached on Apr 25, 2025. View more price dynamics on 1CEG chart.
See other stocks reaching their highest and lowest prices.
See other stocks reaching their highest and lowest prices.
1CEG stock is 7.65% volatile and has beta coefficient of 1.76. Track Constellation Energy Corporation stock price on the chart and check out the list of the most volatile stocks — is Constellation Energy Corporation there?
Today Constellation Energy Corporation has the market capitalization of 91.60 B, it has decreased by −6.85% over the last week.
Yes, you can track Constellation Energy Corporation financials in yearly and quarterly reports right on TradingView.
Constellation Energy Corporation is going to release the next earnings report on Feb 19, 2026. Keep track of upcoming events with our Earnings Calendar.
1CEG earnings for the last quarter are 2.59 EUR per share, whereas the estimation was 2.65 EUR resulting in a −2.32% surprise. The estimated earnings for the next quarter are 1.97 EUR per share. See more details about Constellation Energy Corporation earnings.
Constellation Energy Corporation revenue for the last quarter amounts to 5.60 B EUR, despite the estimated figure of 5.29 B EUR. In the next quarter, revenue is expected to reach 4.28 B EUR.
1CEG net income for the last quarter is 792.54 M EUR, while the quarter before that showed 712.23 M EUR of net income which accounts for 11.28% change. Track more Constellation Energy Corporation financial stats to get the full picture.
Yes, 1CEG dividends are paid quarterly. The last dividend per share was 0.33 EUR. As of today, Dividend Yield (TTM)% is 0.45%. Tracking Constellation Energy Corporation dividends might help you take more informed decisions.
Constellation Energy Corporation dividend yield was 0.63% in 2024, and payout ratio reached 11.85%. The year before the numbers were 0.97% and 22.52% correspondingly. See high-dividend stocks and find more opportunities for your portfolio.
As of Nov 24, 2025, the company has 14.26 K employees. See our rating of the largest employees — is Constellation Energy Corporation on this list?
EBITDA measures a company's operating performance, its growth signifies an improvement in the efficiency of a company. Constellation Energy Corporation EBITDA is 6.10 B EUR, and current EBITDA margin is 28.25%. See more stats in Constellation Energy Corporation financial statements.
Like other stocks, 1CEG shares are traded on stock exchanges, e.g. Nasdaq, Nyse, Euronext, and the easiest way to buy them is through an online stock broker. To do this, you need to open an account and follow a broker's procedures, then start trading. You can trade Constellation Energy Corporation stock right from TradingView charts — choose your broker and connect to your account.